
CHAPTER OBJECTIVES
To define and explain business cycles.
To understand how total spending drives the economy's levels of employment and production, and influences prices.
To examine the spending behavior of households, businesses, government units, and the foreign sector.
To identify the macroeconomy's “leakages” and “injections” and to show how they affect economic activity.
To introduce the multiplier effect.
To discuss how expectations affect the economy's output and price levels.
To identify the role of total spending in macroeconomic policies.

Part of the daily news coverage on the Internet, CNN, major television and cable networks, and newspapers is devoted to the state of the economy. There are stories on the stock market, jobs, and inflation, forecasts of recovery or recession, updates on the status of foreign trade, and numerous other topics devoted to reporting the pulse of the economy. What should be clear from the media is that the U.S. economy continually changes: It goes through upswings and downswings, or periods of expansion and contraction, and never stays at a particular level of activity. Two data series discussed in Chapter 4 attest to this movement: the unemployment rate and real GDP, both of which change on a regular basis.
This chapter deals with fluctuations in the level of production, or economic activity, in the macroeconomy. It identifies the pattern of these fluctuations and provides a foundation for understanding why they occur.
CHANGES IN MACROECONOMIC ACTIVITY
Generally, when people say that the economy is getting better or worse, going into an upswing or downswing, or expanding or contracting, it is because the economy's real GDP is increasing or decreasing. Sometimes, however, people focus on changes in the unemployment rate as their gauge of changes in the economy. Regardless, these two indicators are related: Changes in real GDP cause changes in unemployment. Increases in production bring about reductions in unemployment, and decreases in production increase unemployment.
Figure 5.1 shows changes in real GDP from 1980 through 2011 in the upper graph and changes in the unemployment rate over the same period in the lower graph. In the top graph, notice that real GDP constantly changes and that it does not change at the same rate from year to year. In some years, growth or decline was more rapid than in other years. In the bottom graph, notice the change in unemployment that results from changes in real GDP. For example, unemployment began to grow when real GDP fell in late 1990, in 2001, and in 2008.
While the connection between production and employment is fairly straightforward, the connection between production and price levels is not. We learned in the last chapter that when real GDP approaches its full production level and people continue to spend, demand-pull inflation may occur. However, when real GDP increases, but is well below the full-production level, or when real GDP decreases, price levels may remain relatively stable. Since price levels may, or may not, be affected by production levels, we use the expression “changes in economic activity” to refer to changes in production and employment and not prices.
Business Cycles
Changes in economic activity do not occur randomly or haphazardly, but rather in wavelike patterns called business cycles. These patterns provide some degree of predictability that enables us to better use macroeconomic policy tools to address downswings. Business cycles are recurring periods of growth and decline in real output, or real GDP. A business cycle goes through four phases: a recovery, which is an expansionary phase during which real GDP increases; a peak, where maximum output occurs; a recession, during which real GDP falls; and a trough, where real GDP reaches its minimum.1 Figure 5.2 illustrates the wavelike movement of business cycles and shows how the phases of the cycle are repeated.
Business Cycles
Recurring periods of growth and decline (or expansion and contraction) in an economy's real output, or real GDP.
Recovery, Peak, Recession, Trough
The phases of the business cycle during which real GDP, or output, increases, reaches its maximum, falls, and reaches its minimum, respectively.
FIGURE 5.1 Real Gross Domestic Product and the Unemployment Rate for 1980 through 2011a

A market economy, such as that of the United States, constantly goes through upswings and downswings in its level of output. There is a generally inverse relationship between the economy's level of output and the rate of unemployment: As output decreases or increases, unemployment tends to rise or fall, respectively.
a GDP is given in chained 2005 dollars and the unemployment rate is seasonally adjusted for civilian workers.
Source: Economic Report of the President (Washington, DC: U.S. Government Printing Office, 2012), Tables B-2, B-35. 2011 numbers are preliminary.
The economy is always in some phase of a business cycle. It does not remain stationary at a particular level of output until some force causes it to increase or decrease. Instead, the economy is always expanding, contracting, or at a turning point in activity.
FIGURE 5.2 Phases of the Business Cycle

The economy is always in one of the four phases of the business cycle. Activity is either at a peak, in a recession, at a trough, or in a recovery.
Cyclical Behavior of the U.S. Economy Figure 5.3 gives us a good historical view of business cycles in the United States by tracing these wavelike patterns since the early 1920s. It also points out some important properties of business cycles. First, the phases of business cycles are not of equal length: Some phases last just a few months, whereas others last for years. Notice also that after the 1940s, periods of expansion outweigh periods of contraction and there is less severity in the cycles. This might be due in part to the federal government's commitment to a healthy economy, a better understanding of the economy, and improved information to make economic decisions. A second important property of business cycles is the unequal intensity, or strength, of expansions and contractions. For example, the output declines from 1929 to 1932 and in 1945 were dramatic, whereas others, like the decline in the early 1980s, are not as severe.
FIGURE 5.3 Economic Activity: A Long-Term View

The length of each phase and the intensity of the change in output differ from cycle to cycle.
Every business cycle is unique in the lengths of its phases and the intensity of its recovery and recession. Regardless of the messages of some financial gurus, as you can see, there is no exact rule for determining the duration and magnitude of recessions and recoveries or for defining the exact amount of time required for each business cycle.
Causes of Economic Fluctuations
What causes the economy to expand and contract? This is likely the most important macroeconomic question to be asked. If we understand why we have recessions and recoveries, we can foster the upswings and control the downswings.
For centuries, people have pondered the causes of economic fluctuations. Over the years, some theories, like one attributing business cycles to sunspots, have emerged and disappeared while others have been accepted and refined. And some, like the conspirators theory in Applications 5.1, “What's Causing the Economy to Change?,” go beyond what one typically expects to hear.
Today, there are several theories about what causes economic activity to change. When considering the merits of these theories, it is helpful to remember what we learned in Chapter 1: Theories are abstractions that are based on assumptions and focus on the relationship between two variables. That is, different macroeconomic theories use different assumptions and variables, and explain the economy's behavior from different perspectives.

Source: Tom King, “Industrial Production Index,” Board of Governors of the Federal Reserve System, G.17 Industrial Production and Capacity Utilization, updated 09/14/2012..
APPLICATION 5.1
 WHAT'S CAUSING THE ECONOMY TO CHANGE?
Over the years there have been some interesting explanations for changes in the macroeconomy that are not based on reasons one would describe as “economic.” Let's take a brief look at a few of them.
Sunspots In 1837, 1847, and 1857 the British economy went through a series of downswings. William Stanley Jevons, a highly regarded economist at that time, argued that these downswings may have been caused by sunspots—which show up about every 10 years. Actually, now we know that a connection between sunspots and economic activity is not that far-fetched. Sunspots can adversely affect weather, which in turn can reduce crop yields. The British depended on India to buy exported British products. But since a major source of income for India was its crops, when the crops failed (presumably due to sunspots) India had less income to buy British exports. In turn, the British economy suffered.
Conspirators During the Great Depression and the administration of President Franklin D. Roosevelt, a theory emerged that downswings are caused by conspirators. Some people said that a group was conspiring to do damage to the economy and that these conspirators were using a popular comic strip to openly communicate with each other. One of the characters in this comic strip was a cigar smoker. According to the conspiracy theorists, smoke coming up from his cigar in a given day's comic signaled one thing to the conspirators and ashes falling from his cigar signaled something else.
Psychology and Theology Explanations for movements in the economy have also been built on psychological and theological foundations. It has been suggested by some that people go through waves of optimism and pessimism, and that these emotional waves in turn cause the economy to go through waves of expansion and contraction. Others have argued that downswings in the economy are punishment for sins committed while the economy was prospering.
There are several popular theories today that deal with causes of recessions and recoveries. In addition to this chapter, Chapter 9 presents several other generally accepted theories. However, to fully appreciate and understand the working of the macroeconomy, as well as these macroeconomic theories, it is important to have a solid grasp of some basics. That is the goal of this chapter.
TOTAL SPENDING AND MACROECONOMIC ACTIVITY
Analyzing the macroeconomy is not easy: Sometimes it is difficult to bring orderly relationships to such a large picture. To ease our study, economists tend to think of the macroeconomy as having four large groups or sectors: households, businesses, government, and the foreign sector. All macroeconomic activity falls into one of these groups, and each group makes decisions that play an important role in the health of the economy.
Economists have also identified an important macroeconomic relationship that we need to understand: Changes in total (aggregate) spending in the economy cause changes in total (aggregate) production and employment. Total, or aggregate, spending is all of the spending for all new goods and services that occurs in the economy. Total spending is the spending of each of our major groups—households, businesses, government units, and foreign buyers—together.
Total, or Aggregate, Spending
The total combined spending of all units in the economy (households plus businesses plus government plus foreign) for new goods and services.
In a market economy, spending is the driver. As long as buyers spend their money, producers will continue to produce goods and services and hire people to do so. If total spending decreases—people quit buying homes, the government cancels a major aircraft order, developers quit building shopping centers—producers respond by decreasing production, which in turn results in a decrease in employment and in incomes. If total spending increases, producers respond by increasing output, which in turn results in an increase in employment and in incomes. Thus, a reduction in spending leads to a recession because of its dampening effect on output, employment, and income. An increase in spending leads to a recovery because of its expansive effects. The relationship between spending and output, employment, and income is summarized in Figure 5.4.
FIGURE 5.4 Total Spending and the Level of Economic Activity

Changes in total, or aggregate, spending lead to changes in output, employment, and income.
Obviously the spending behavior of households, businesses, the government, and foreign buyers is critical to the health of the macroeconomy. In the next few pages, we will examine each group and the factors that significantly influence its spending behavior.
The Household Sector
Households constitute the largest spending group in the economy and buy far more goods and services than do businesses, government, and foreign purchasers combined. For example, households purchased almost $11 trillion of the approximately $15 trillion output produced in 2011.2 Furthermore, individuals do not radically alter their spending patterns from year to year, making this spending fairly stable as it generally increases. It is fortunate for the economy that the largest spending group is so steady in its spending patterns.
Technically speaking, we call aggregate household spending on new goods and services personal consumption expenditures. Figure 5.5 plots real personal consumption expenditures for 1980 through 2011.3 Notice that the line almost always slopes upward with little fluctuation.
Personal Consumption Expenditures
Household spending on new goods and services.
FIGURE 5.5 Real Personal Consumption Expenditures for 1980–2011a

Total spending by households does not fluctuate widely from year to year, and the growth of personal consumption expenditures is relatively stable over time.
a Given in chained 2005 dollars; 2011 numbers are preliminary.
Source: Economic Report of the President (Washington, DC: U.S. Government Printing Office, 2012), Table B-2; 2011 number is preliminary.
The Household Sector and the Circular Flow Most of the spending that we do comes from income that we earn. We deliver pizzas, work as CEOs, own and run bed-and-breakfasts, and do a host of other activities to earn money. In the macroeconomy, then, we know that the majority of spending by the household sector on new goods and services comes from the income earned by households, or is income-determined spending.
Income-Determined Spending
Household spending on new goods and services that comes from income earned from providing resources to producers.
Figure 5.6 builds on the circular flow model introduced in Chapter 2; it illustrates some of the important factors that influence household spending and how they are related. For now, observe lines 1, 2, 3, and 4. Line 1 shows a flow of earned income from selling factors of production to businesses (line 2), and line 4 shows a flow of personal consumption expenditures for goods and services (line 3). You can see that earned income provides the spending power to purchase goods and services.
FIGURE 5.6 Household Spending, Borrowing, Transfers, Saving, and Taxes

Household spending, which is influenced mainly by the size of earned income, is also affected by transfers and borrowing, which provide injections into the spending stream, and by saving and taxes, which are leakages from the spending stream.
While earned income is the major source of household spending, it is not the only source. Households can also spend from funds that they borrow through bank loans, credit card purchases, or such, and from government transfer payments, which are payments from the government for which no direct work is performed in return. Social Security payments, unemployment compensation, and agricultural subsidies are examples of transfer payments. Checks from working for a government are not transfer payments.
Transfer Payment
Money from the government for which no direct work is performed in return.
When households make personal consumption expenditures from money that they borrow or receive in transfers, we call that nonincome-determined spending. It is important to separate income- and nonincome-determined spending. Since nonincome-determined expenditures are based on sources other than earned income, they become injections into the spending stream. That is, they are expenditures over and above what household earned income alone would allow. Injections into the spending stream are important because they lead to an expansion of output, employment, and income in the economy as businesses produce more to meet this additional demand. In Figure 5.6, transfers and borrowing are shown as injections into the circular model.
Nonincome-Determined Spending
Spending that is generated from sources other than household earned income.
Injections into the Spending Stream
Spending that comes from a source other than household earned income; nonincome-determined spending.
We also know that households do not spend all of their income: Some is used to pay taxes and some is saved. Households pay a variety of taxes to various government units. Households also save in a variety of ways through the use of financial institutions such as banks, brokerage houses, credit unions, and insurance companies. Both saving and taxes are leakages from the spending stream because they are income that households are not spending. Leakages from the spending stream cause output, employment, and income in the economy to shrink as businesses cut back production in response to a reduced demand.
Financial Institutions
Organizations such as banks, credit unions, and insurance companies that provide a means for saving and borrowing.
Leakages from the Spending Stream
Uses for earned income other than spending, such as paying taxes and saving.
UP FOR DEBATE
 IS SAVING A HEALTHY HABIT?
Issue From the time we are children we are encouraged to save. Grandparents often give savings bonds and accounts to celebrate a birthday; banks frequently provide penny accounts; and some parents attempt to encourage savings habits by matching amounts saved. By the time a person enters adulthood, regularly saving money may be a lifestyle habit.
But the argument that it is smart to save seems to contradict a basic economic relationship that we've just explored: Increased spending leads to more output and employment, and decreased spending—or more saving—leads to declines in output and employment. In other words, for the good of the economy, it is healthier to spend than to save. Faced with these contradictory messages, we need to ask: Is saving a healthy habit?
Yes People should save on a regular basis. Good planning for the future involves good financial planning, which encourages saving. The ability to qualify for a mortgage, send kids to college, or retire comfortably is affected by the amount a person has saved. In addition, the peace of mind afforded by a cushion of certificates of deposit, stocks, mutual funds, and other assets may lessen everyday stress.
Saving also provides a means for increasing income through interest and dividends. As one saves more, the income earned from saving increases and affords additional funds for more saving or spending.
It is also important to develop good savings habits and build up a reserve of funds because life throws us curves that can be better negotiated if we have money. Job loss, illness, or an auto accident could be disastrous without money to assist us through such a crisis. Life can also throw us opportunities that can be seized if we have the funds—traveling, an interesting nonpaying internship, a stock tip, and a partnership in a business, to name a few.
No People need to be careful that they do not save too much because, while saving may be good for the individual, the health of the economy depends on the overall level of spending. And, since ordinary consumers like us are part of the largest spending group, it is important that we buy goods and services and not save too much money.
When we increase our saving, businesses respond by cutting back on production. For example, if we all decided to wait to buy a car until we have saved enough to pay cash, car sales and production would fall dramatically, jobs would be lost in the auto and related industries, and the economy would slow down. This applies to services also. Saving rather than going to the dentist or even taking piano lessons causes a reduction in some incomes.
Increases in saving could kick off a downward spiral into a recession, with resulting job losses. Without jobs, there is no income to save. If we all listen to the adages about the value of saving, we could hurt ourselves.
In summary, the amount that households spend is influenced by
- earned income,
- borrowing,
- transfers,
- saving, and
- taxes.
When people earn more or less, change their saving habits, or change any of the other factors just listed, total personal consumption expenditures and the economy as a whole can be affected. For example, fear of a recession could cause people to increase saving, with a resulting decline in spending; or a decrease in interest rates could encourage people to borrow for new cars, home remodeling, and other spending purposes.
Although personal consumption expenditures is the largest component of total spending, the impact on the economy of changes in the household sector is affected by spending in the business, government, and foreign sectors. As a result, we need to examine the other sectors and consider all of them together before drawing any conclusions about the economy.
Up for Debate, “Is Saving a Healthy Habit?”, examines conflicting messages about saving. Do you agree with the underlying message that what may be good for the individual may not be good for the group?
FIGURE 5.7 Real Gross Investment for 1980–2011a
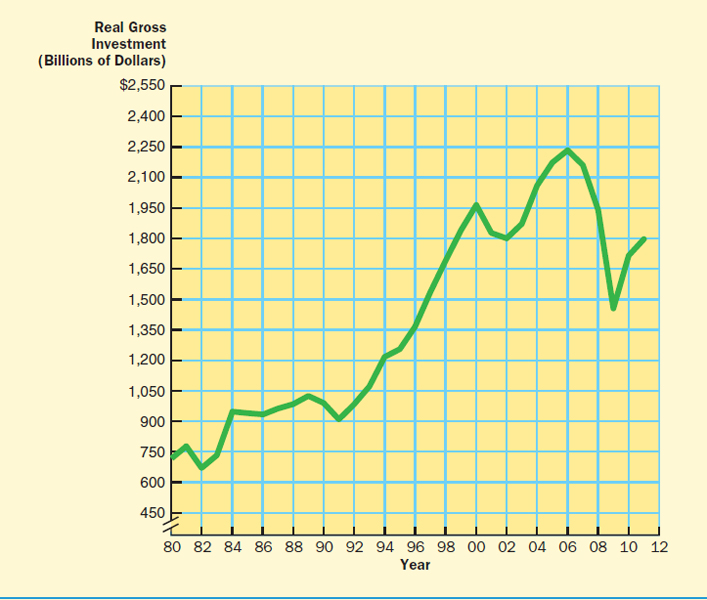
Investment spending can fluctuate widely from year to year and is a major cause of changes in economic activity.
a Gross investment is outright purchases of investment goods plus a depreciation allowance for capital that was used up during the current year; numbers are in chained 2005 dollars.
Source: Economic Report of the President (Washington, DC: U.S. Government Printing Office, 2012), Table B-2; 2011 number is preliminary.
The Business Sector
Businesses play an extremely important role in the macroeconomy because of their spending habits. The size of business spending on new goods is huge: Each year they put hundreds of billions of dollars into new machinery and equipment, replacement parts, buildings, inventories, and the like. Technically, we term this investment spending, and we label it nonincome-determined spending because investment spending does not come from household earned income.
Investment Spending
Business spending on new goods, such as machinery, equipment, buildings, and inventories; nonincome-determined spending.
Investment spending is not steady and tends to fluctuate from year to year. Figure 5.7 plots real gross investment for 1980 through 2011 and shows how this spending fluctuates. This figure gives us an excellent picture of a very important piece of macroeconomic reality: Changes in investment spending are a primary cause of changes in economic activity. When business spending declines, it can bring about a slowdown or recession; when it increases, it can help pull the economy into a recovery. Figure 5.7 shows serious declines in investment spending in 1982, 1990 and 1991, 2001 and 2002, and a dramatic decline that began in 2008. During these years the United States experienced recessions and increasing unemployment rates.
Business Spending and Profit Expectations Why does business spending fluctuate? Business spending habits in the aggregate are very different from household habits because the motivation for spending is different. Householders look to their earned income as the basis for spending to support a lifestyle. Households tend to have fairly stable expenditures for housing, food, and other necessities and/or luxuries. Businesses look for the potential to make a profit as their basis for spending. Businesses invest in new buildings and equipment and larger inventories if they expect to earn enough profit from the investment to make it worthwhile. The reason Wal-Mart constructs a new Sam's Club or Ford retools a truck plant is that these companies expect to increase their profit levels with these expenditures.
Sometimes businesses plan for new investment spending—perhaps a technology upgrade—but “hold on” to those plans and postpone them because the timing is not right. Most investment spending is postponable: Building a new box store, constructing a new ride at a theme park, remodeling corporate headquarters, or even buying a new pizza oven by a mom-and-pop operation are likely not expenditures that must be made for day-to-day operations to continue. Since most businesses can delay major capital expenditures until profit expectations increase, this adds to the reasons for fluctuations in business spending.
An important factor that influences expected profit and investment spending is expectations of future overall levels of economic activity. Fear of a recession can discourage investment spending as businesses speculate that falling demand and growing inventories of unsold goods will make their operations unprofitable. Likewise, expectations of healthy sales and a surge in economic activity can bring about an increase in business spending. Predictions of economic doom-and-gloom coupled with the reality of falling demand and rising unemployment from the end of 2008 through 2010 helped to scare businesses into postponing investment spending plans. The economy was so skittish that the stock market reacted to many announcements, even the possible spread of swine flu.
The price tag on a business's investment plans can be staggering. Imagine the construction costs for a new stadium for one of the major league baseball teams or even for a medical center in your hometown. Since most businesses borrow the funds for their investment spending, the interest rate that they must pay to borrow greatly influences the level of investment spending. If the interest rate is high, businesses may decide that it is best to postpone spending because the high cost of borrowing reduces the expected profitability of the investment. If the interest rate is low, businesses may take advantage of the reduced cost of funds and increase their borrowing.
Application 5.2, “Interest Rates and Investment Spending,” provides a very simple example of how an investment decision can be affected by the interest rate. In this application, a 5-year loan for $200,000 at an 18 percent interest rate would cost a business owner $1,212.10 more in monthly payments, or a total of $72,726 more than would the same loan at a 6 percent interest rate. The importance of the effect of changes in the interest rate on economic activity will be discussed further in Chapter 8.
APPLICATION 5.2
INTEREST RATES AND INVESTMENT SPENDING
Quite a few young adults are combining a passion for healthy food with an entrepreneurial spirit that is bringing fresh, wholesome breads, baked goods, and more to markets. Usually, a motivating factor for opening a business is the possible money that can be made. But, sometimes, the passionate baker is looking first for the ability to cover costs and not lose money on a risky venture.
Let's take the case of Serious Bread and its owners. They have been selling some varieties of their wonderful bread at the local farmers market and to a number of restaurants and are receiving rave reviews. The owners/bakers would very much like to combine a bread baking facility with a retail space so that their customers have ready access to their bread.
Serious Bread has determined that it needs to borrow $200,000 to make the dream a reality. But, one of the critical considerations in going forward is whether or not they can make payments on the principal and interest for this $200,000 loan. Can they afford these payments every month to retire this loan?
In simple terms, an annual interest rate of 6 percent means that the interest payment alone for one year on $200,000 is $1,200 (.06 × $200,000). An interest rate of 12 percent means an annual interest cost of $24,000, and an 18 percent interest rate is $36,000. And, as a small business without established credit, the owners know that a higher rate is likely.
Assume now that the owners decide to go for it and explore taking out a loan for $200,000 that they will repay over 5 years. The following table summarizes the payments they will need to make each month. (The calculations in this table are complex because loan payments are based on a declining principal.)
Notice the substantial difference in monthly payments that must be made on this loan as well as the total interest paid over five years as the interest rate rises. The owners must be able to assess whether their bread baking operation and sales are capable of making these monthly payments. Also, you can understand why they will search for someone who will loan them money at the lowest interest rate.

The Business Sector and the Circular Flow The circular flow model in Figure 5.8 shows the role of the business sector in economic activity. Line 1 is business investment spending, which is an injection into the spending stream because it is nonincome-determined spending. Line 2 represents business saving, called retained earnings. Line 3 represents business taxes: corporate income tax, sales tax, and license fees, to name a few. Both business saving and taxes are leakages from the spending stream.
Retained Earnings
The portion of a business's accumulated profits that has been retained for investment or other purposes.
Notice the addition of financial institutions to Figure 5.8. These are important for business saving and investment borrowing. Businesses use financial institutions to hold their savings through deposits, stocks, bonds, or some other security that earns money until the funds are needed. Financial institutions also provide the means for financing investment spending through loans, new shares of stock, or simply redeeming the retained earnings.
The Saving–Borrowing Relationship This is a good time to point out a critical flow in the macroeconomy: the saving–borrowing relationship. Figure 5.9 adds household saving and borrowing back into the circular flow and allows us to see a fuller picture of saving and borrowing. Through financial institutions, dollars saved by households and businesses—dollars that are leakages from the spending stream—can be borrowed and spent by other households and businesses and thereby returned to the spending stream. In other words, financial institutions are vehicles for changing leakages from the spending stream into injections.
Saving–Borrowing Relationship
The relationship between the amount saved by households and businesses and the amount returned to the spending stream through business and household borrowing.
FIGURE 5.8 Business Investment Spending, Saving, and Taxes

Business investment spending is an injection into the spending stream, and business saving and taxes are leakages from the spending stream.
FIGURE 5.9 Saving, Investing, and Borrowing by Households and Businesses

The relationship between saving and investment spending and household spending from borrowing can cause the economy's levels of output, employment, and income to increase, decrease, or remain unchanged.
Since the motivations for saving and for borrowing are not the same, it is important to understand that the amount saved may not equal the amount borrowed. In other words, the economy could experience conditions where savings are greater than borrowing, savings are less than borrowing, or savings equal borrowing.
Because saving is a leakage from the spending stream and spending from borrowing is an injection into the stream, overall spending in the economy and the resulting levels of output and employment are influenced by this relationship. When saving is greater than borrowing, the relationship will foster a decrease in total spending and a downturn in the economy. When saving is less than borrowing, the relationship will foster an increase in total spending and an upturn in the economy. We need to understand that, at this point, we have isolated this saving–borrowing relationship. Before we draw any big picture conclusions, we need to put other relationships into the model.4
The Government Sector
Government—federal, state, and local—is another sector that has a major impact on the economy because of its own spending as well as its power to influence spending in the other sectors through the taxes that are imposed. And, as we will soon learn in Chapter 6, the federal government can use its spending and taxing to change the direction of the economy. We classify government spending into two major categories: purchases of goods and services, and transfer payments.
Governments provide us with many needed services and, as a result, make government purchases of goods and services to do so: fire trucks, police radar detectors, defense systems, park benches, paper, and the services of government employees to fix roads and maintain a court system, to name a few. Technically, we classify government purchases of goods and services as nonincome-determined spending because they do not come directly from household earned income. Government purchases have the same impact on the economy as does other spending: Increases in government purchases can increase economic activity and decreases can decrease output, employment, and income.
Government Purchases of Goods and Services
Government spending on new goods and services; nonincome-determined spending.
In most years, government spending for new goods and services is the second largest component of total spending. Figure 5.10 plots real government purchases of goods and services for 1980 through 2011. This figure shows that, like household spending and unlike business spending, government purchases tend to be stable and increase over time.
Government also uses a substantial portion of its funds for transfer payments, such as Social Security and unemployment compensation, which go to individuals or households that perform no direct work in return. These transfer payments can then be used to buy groceries, pay for prescriptions or rent, or make other personal consumption expenditures. Household spending from transfers is nonincome-determined spending because it does not come from household earned income. In 2011, about $2.3 trillion went from government to households as transfer payments.5
We want to point out the importance of thinking of government spending in terms of the two categories just discussed: government purchases and transfer payments. This distinction will help you to better understand the material in this chapter and the following one.
FIGURE 5.10 Real Government Purchases of Goods and Services for 1980–2011a

The growth in government purchases of goods and services has been relatively stable.
a Numbers are in chained 2005 dollars.
Source: Economic Report of the President (Washington, DC: U.S. Government Printing Office, 2012), Table B-2; 2011 number is preliminary.
The Government Sector and the Circular Flow The government sector is added to the basic circular flow model in Figure 5.11. Line 1 shows the flow of transfer payments, which can be used for consumption spending; line 2 represents government purchases of goods and services; and lines 3 and 4 show taxes going from households and businesses to government. This model shows that government purchases are a direct injection into the spending stream, transfers provide an injection through households, and taxes are a leakage.
The Government Taxing–Spending Relationship There is another relationship like the saving–borrowing one that is important to economic activity: the government taxing–spending relationship. This one, however, is slightly more complicated because while government taxing and spending may be equal, the amount leaked from the spending stream may not equal the amount injected because of saving. That is, taxpayers may pay their taxes using part of their incomes that would have been saved and part that would have been spent, and transfer recipients may save part of their payments. For readers who want to explore the details of this complication, footnote 6 gives that information.6 For our purposes here we will discuss the amounts leaked from and injected into the spending stream through the government sector, rather than taxes and spending.
FIGURE 5.11 The Government Sector and the Circular Flow

Government purchases of goods and services and spending from transfer payments are injections into the spending stream, and taxes paid to government by businesses and households are leakages from the spending stream.
Sometimes the amount that flows into the government in taxes does not equal the amount that is returned to the spending stream through government purchases and spending from transfers. When the amount that is leaked through taxes is greater than the amount returned through these injections, a downswing in economic activity is fostered. When the amount that is leaked in taxes is less than the amount returned through these injections, an upswing in economic activity could result. When they offset each other, there is no change in economic activity from this relationship.
When we complete our discussion of all four economic sectors, we will put the government sector relationships together with the others to get a complete picture.
The Foreign Sector
The fourth major sector that has an impact on the direction of the macroeconomy is the foreign sector. While it is the smallest of the four, it has been growing significantly in importance. Most of us interface daily with some aspect of today's global economy: We buy electronics manufactured in Asia, work on farms that have corn sold to Mexico, wear shoes from Brazil and China, read foreign papers, go to college credit programs in Europe, and surf for good foreign stock opportunities. In short, the lines between domestic and foreign products and services have become increasingly blurred.
We term goods and services produced in the United States and sold abroad as U.S. exports, and goods and services produced in foreign countries and sold in the United States as U.S. imports. Generally speaking, exports increase spending in the economy and imports take spending out of the economy. As a result, we tend to think of exports as injections and imports as leakages. In 2011, exports were 13.8 percent of GDP and imports were equal to 17.7 percent of GDP.7
Exports
Goods and services that are sold abroad.
Imports
Goods and services purchased from abroad.
The real values of U.S. exports and imports from 1980 through 2011 are plotted in Figure 5.12a. Notice that the values of exports and imports have generally grown over the years and that the value of U.S. imports has usually been more than U.S. exports. When we subtract imports from exports, we get the difference between their values, or net exports. Net exports is positive when exports are greater than imports and negative when exports are less than imports. Net exports of goods and services for 1980 through 2011 is plotted in Figure 5.12b. Negative net export years fall below the zero line on the graph. It is easy to observe that for most years net exports is negative—and exceptionally negative between between 2002 and 2008.
Net Exports
Exports minus imports; is positive when exports exceed imports and negative when imports exceed exports.
In addition to the impact on total spending levels from large, consistent negative net export numbers, there are other serious consequences from the substantial flow of dollars to other countries. Chapter 17, International Finance, explores this area in greater detail. It will help you to understand a declining value of the dollar for U.S. citizens traveling abroad as well as the increased purchases of U.S. assets like buildings and stock by foreign dollar holders.
The Foreign Sector and the Circular Flow Figure 5.13 uses a variation of the circular flow model to show the effect of exports and imports on the U.S. economy. Line 1 represents the injections into the U.S. economy that result from expenditures by foreign buyers on exported goods and services. Line 2 represents the leakages from the U.S. economy that result from expenditures by U.S. buyers on imported goods and services. Imports and exports have the same effect as the other leakages and injections: Purchases of imports deflect spending from the economy and foster a downswing, and purchases of exports by foreign buyers increase spending and foster an upswing. Spending on exports is another example of nonincome-determined spending since it does not come from U.S. household earned income.
Here, once again, is another important relationship—the export-import relationship—to consider. And, again, as with the other sectors, injections and leakages may not be equal. Exports can be greater than imports, which makes net exports positive, causing injections to be greater than leakages and overall spending in this sector to grow. Imports can be greater than exports, which makes net exports negative, causing leakages to be greater than injections and overall spending in this sector to decline. This relationship needs to be considered with the others in evaluating the direction of the overall economy.
FIGURE 5.12 Real U.S. Exports, Imports, and Net Exports of Goods and Services for 1980–2011a

In general, real U.S. exports and imports of goods and services have increased since 1980, and imports have been greater than exports.
a Numbers are in chained 2005 dollars.
Source: Economic Report of the President (Washington, DC: U.S. Government Printing Office, 2012), Table B-2; 2011 number is preliminary.
FIGURE 5.13 The Foreign Sector and the Circular Flow

Exports of goods and services generate injections into the U.S. economy's spending stream, and imports cause leakages from the U.S. economy's spending stream.
Summary of Aggregate Spending, Leakages, and Injections
Let us review. Total, or aggregate, spending drives the economy's production, employment, and income levels. When total spending increases, the economy expands as output, employment, and income increase; when total spending decreases, the economy contracts as output, employment, and income fall. We compute total spending by aggregating the spending of households, businesses, governments, and foreign buyers. It is important to remember that of these four groups, business investment spending, because of its size and instability, is a major cause of changes in economic activity.
Some actions in each of the four spending sectors cause leakages from the spending stream. These include
- saving by households and businesses,
- paying taxes by households and businesses, and
- importing foreign goods and services.
Other actions in the four sectors cause injections into the spending stream. These include
- household spending from borrowed dollars,
- household spending from government transfer payments,
- business investment spending,
- government purchases of goods and services, and
- foreign purchases of exported goods and services.
The relationship between leakages and injections influences aggregate spending and, in turn, the economy's production and employment levels. Up to this point in our discussion, we have identified three important relationships: the saving–borrowing, the tax–government expenditures, and the import–export relationships. To assess the economy as a whole, we must consider these relationships together. For example, while saving could exceed borrowing, causing a downswing, government expenditures could exceed taxes, causing an upswing.
TABLE 5.1 Leakages, Injections, and Changes in Economic Activity
The economy's levels of output, employment, and income depend on the combined impact of all leakages from and all injections into the spending stream.

In looking at the big picture, we know that
- if all leakages from the spending stream are equal to all injections, the economy will not change;
- if leakages are greater than injections, the economy will fall into a recession; and
- if injections are greater than leakages, the economy will expand into a recovery.
These cause-and-effect relationships are summarized in Table 5.1.
Each of the pieces of the macroeconomic puzzle that we have just created is extremely important because of the impact that each can have on the economy. Even a ban on genetically altered grain and seed exports could have macroeconomic implications. As a result, these various pieces are watched closely by those concerned with the state of the economy. And the media are particularly interested in reporting consumer confidence indexes, saving patterns, transfer payment changes, investment declines, and such.
The Multiplier Effect
In this chapter, we have identified spending as either income-determined or nonincome-determined. There is just one example of income-determined spending: the spending on goods and services that comes from people's earned incomes. All of the other spending that we discussed—from borrowing and transfer payments, investment spending, government purchases, and spending on U.S. exports—is nonincome-determined spending because it does not come directly from household earned income.
It is important to make a distinction between income-determined and nonincome-determined spending. This is because nonincome-determined spending, when it is injected into the economy, is subject to a multiplier effect. An increase or decrease in nonincome-determined spending causes changes in output and employment that are far greater than the initial change in spending. An increase, for example, of $100 million in nonincome-determined expenditures will cause the economy to grow by much more than $100 million because of the multiplier effect.
Multiplier Effect
The change in total output and income generated by a change in nonincome-determined spending is larger than, or a multiple of, the spending change itself.
TABLE 5.2 Effect on Total Output and Income from a Nonincome-Determined Spending Injection of $10,000,000
Because of the multiplier effect, an injection of nonincome-determined spending into the spending stream causes total output and income to increase by more than the amount of the nonincome-determined spending itself.

Why is there a multiplier effect? How does it work? Nonincome-determined spending is not part of the “basic circle” of the circular flow model. That is, it is spending that does not come from income earned from production that is taking place. Instead, it comes from outside the core circle of the economy, or is injected into the economy. Once the injection enters the economy, it becomes part of the basic circle and these dollars are spent over and over again.
Let's work through an example. Suppose that a developer borrows $10,000,000 to invest in building homes. As the homes are constructed, the developer uses the $10,000,000 to hire people and buy materials and other resources. This spending by the developer puts $10,000,000 into the economy that was not previously there. In other words, this investment injection of $10,000,000 initially creates $10,000,000 in output (the homes) and incomes.
People who receive the $10,000,000 in income from this injection will now take part of it and spend it—they can buy cars, go on vacation, eat in trendy restaurants—and use part for saving and taxes. We will assume that they spend $8,000,000. Since this $8,000,000 is “new” to the economy, it will result in $8,000,000 of new production and incomes. The income earners of the $8,000,000 will now take part of that, say $6,400,000, and spend it.
The process does not stop here but continues through the economy in a circular pattern, creating more output and income along the way. In the end, the initial injection of $10,000,000 in the economy creates a substantial amount of output and income. Table 5.2 illustrates this example of the multiplier process through several rounds. When this example is carried through enough successive rounds to approach a zero increase in the last round, and the output and income created in each round are summed, $50,000,000 in total output and income results. This means that the initial injection of $10,000,000 has been multiplied, or magnified, to $50,000,000 of output and income; there has been a multiplier effect equal to five times the initial change in spending.
Calculating the Multiplier Effect There is an easier way to calculate the multiplier effect than to go through each round of spending, as in Table 5.2. To do so, divide the initial change in nonincome-determined spending by the percentage of the additional income received by households that is not spent. Expressed as a formula, the multiplier effect is
![]()
In the preceding example, the initial change in nonincome-determined spending was $10,000,000 and households receiving that $10,000,000 as income spent $8,000,000, or 80 percent, and did not spend $2,000,000, or 20 percent. The households that received $8,000,000 in income spent $6,400,000, or 80 percent, and did not spend $1,600,000, or 20 percent, and so on. Accordingly, in this example, the initial change in nonincome-determined spending of $10,000,000 would be divided by 0.20, the percentage of additional income not spent in each round, to result in an answer of $50,000,000, the total change in output and income.8
The multiplier effect is dependent on how much is spent and not spent from each successive round of income and output that is created: The more that is spent, the greater the multiplier effect; the less that is spent, the smaller the multiplier effect. If households in the preceding example had spent only 75 percent and not spent 25 percent of each successive round of newly created income, the level of economic activity would have grown by $40,000,000 ($10,000,000/0.25 = $40,000,000) rather than $50,000,000.
The multiplier effect also applies when nonincome-determined expenditures are cut back. For example, a decrease in investment spending of $10,000,000, by the time it works its way through the economy, will cause the level of economic activity to decline by more than the initial $10,000,000 decrease.
The multiplier effect is frequently used in local impact studies. Sometimes colleges and universities, for example, will conduct economic studies and use a local multiplier to show how they bring positive economic benefits to a community. Students can be regarded as bringing injections into a local economy as they buy courses, housing, food, books, and such. In addition, multipliers are used to justify large public projects like stadiums. The case is frequently made that a new stadium brings more fans into an area, becomes a tourist magnet, encourages spending for hotels and food, and thus creates additional employment and income for the area.
In summary, changes in nonincome-determined spending, such as investment spending, government and foreign purchases, and household expenditures from transfer payments or borrowing, will cause changes in economic activity that are a multiple of the initial change in spending.
Application 5.3, “Ripples through the Economy,” provides three examples of the multiplier effect. The first deals with slumps experienced in western Pennsylvania because of coal and steel; the second with rewards from attracting conventions and sporting events to a city; and the third with recent problems in the auto industry. Keep in mind that the multiplier effect applies to both increases and decreases in spending.
APPLICATION 5.3
RIPPLES THROUGH THE ECONOMY
Western Pennsylvania Certainly the older generation in western Pennsylvania, home to coal mining and steel making for over a hundred years, experienced the ripple effect caused by the multiplier principle. Most families in this area knew what it meant when these two industries began to lay off workers.
All one needed was a visit to Pittsburgh or one of the smaller towns like Monesson or Uniontown to see how the slump in steel or coal affected the entire community. As steelworkers or coal miners no longer clocked in to their jobs, the lines formed at the unemployment offices for some relief.
But being out-of-work meant little or no spending at car lots, restaurants, and local shops, and even church collections fell. These establishments then had no choice but to lay off workers, too. As the flower shops, shoe stores, restaurants, remodeling companies, and even churches laid off some of their employees, families had little choice but to cut back on their spending. And you could see it as towns lost their vibrancy. The ripple effect hit almost everyone.
Bring on the Visitors Cities and towns today know the value of attracting tourists, conventions and conferences, and major sporting events. Dynamic communities are funding visitor and convention bureaus, websites, and magazine ads designed to bring people to their towns.
Why are they doing this? It is very simple—the multiplier principle. Consider a major convention like the American Medical Association annual meeting in June 2012 in Chicago. This largest association of medical doctors brought people from all over the United States to Chicago who rented hotel rooms, ate three meals a day, shopped, visited museums, or, in short, spent a lot of money in Chicago. This provided more jobs and income for many Chicagoans, from hotel to museum staff. This convention, like others in Chicago, boosted that city's economy.
This also explains the competition to attract major sporting events like the Super Bowl and the Final Four, or for cities to cheer their baseball teams on to the World Series. Think about the money that flows into a local economy from four World Series games. Visitors to a city, from the media folks to out-of-town baseball fans, leave the community with millions of dollars that would not have been injected without the event.
The Snowball Effect In the spring of 2009, the economy continued a downward decline that began in the fall of 2008. This downhill spiral was exacerbated by a substantial drop in car sales and uncertainty over the future of General Motors and Chrysler.
When Chrysler announced in May 2009 that it would close a large number of car manufacturing plants in the United States as part of its bankruptcy plan, near panic occurred in cities like Fenton, Missouri, the home of two large Chrysler assembly plants. This would mean a job loss of another 1,000 employees at facilities that just a few years ago employed more than 7,000 people.
Without the plants, suppliers of parts for the Fenton facility—like a nearby car seat company—feared the possibility of going out of business, causing even more workers to be unemployed. And businesses that grew because of the Chrysler plants—from bars and restaurants to grocery stores—worried that their customer base would be gone and they, too, would be forced to shut down.
In addition, the city and the local school district were concerned. How many employees would have to be “let go” because the taxes generated by these facilities would no longer be collected? The plants provided for about 10 percent of the Fenton city budget and paid $5.7 million annually to the school district.
Fenton officials and business owners were not optimistic about the downward spiral that this old river town could now face. The owner of a local tea house and gift shop was worried about declining customers as spouses of plant workers pinch pennies. “I'm afraid of the snowball effect,” she said.
Source: Stephen Deere and Tim O'Neil, “Fenton braces for loss,” St. Louis Post-Dispatch, May 3, 2009, www.stltoday.com.
A Word about Inflation
We must be careful to understand that it is not always to the benefit of the economy to encourage more spending. When the economy expands, the full production-full employment level of output sets a limit on how far spending can cause production and employment to increase. If spending continues to grow when the economy is at or close to the full production-full employment level of output, demand-pull inflation may result.
TEST YOUR UNDERSTANDING
 CHANGES IN ECONOMIC ACTIVITY
In the following examples, explain the effect on output and employment that would result from each action taken alone. Unless specifically indicated, the economy is not at full employment when the action occurs.
- Businesses install new telecommunications systems.
- Congress increases personal income tax rates by 5 percent.
- A decrease in mortgage loan rates and a continued strong demand for housing cause a boom in the home construction business.
- Overseas buyers purchase a large amount of road-building equipment manufactured in the United States.
- Newspaper headlines continually carry predictions of a recession in the months to come.
- Because the economy is at full employment, several major credit card companies successfully campaign to increase the number of, and usage by, cardholders.
- The interest rates for borrowing money increase.
- Net exports of goods and services changes from a negative to a positive number.
- Social Security benefit payments are increased by 2.3 percent.
- Households, fearing that prices will spiral upward because the economy is at full employment, immediately purchase big-ticket items such as cars and furniture.
- Businesses postpone their expansion plans while they wait for better economic times.
- Political pressure prompts Congress to cut its spending on highway projects.
- Each U.S. taxpayer receives a tax rebate check when the economy is at full employment.
- A law is passed limiting the number of new foreign automobiles that can enter the country each year.
- U.S. citizens begin to change their attitudes toward thrift and start to save more.
The following examples relate to the multiplier effect. Determine the direction and size of the change in total output and income that will result from each change in nonincome-determined spending.
- After several years of drought, farmers in central Illinois spend $50 million on irrigation equipment at a time when households do not spend 25 percent of the additional income they receive.
- The federal government cuts defense expenditures by $35 billion at a time when households are not spending 40 percent of the additional income they receive.
- Developers borrow $120 million for new home construction in northern Virginia at a time when households are spending 70 percent of the additional income they receive.
- Business spending for machinery and equipment falls by $6 billion after predictions of a recession. Households spend only 50 percent of the additional income they receive due to these predictions.
- Exports increase by $20 million at the same time that imports increase by $25 million. Households spend 60 percent of the additional income they receive.
- (Be careful!) Government transfer payments increase by $100 million at a time when households spend 80 percent of the additional income they receive.
Answers can be found at the back of the book.
Inflation may occur if injections into the spending stream are greater than leakages when the economy is at or near full employment. Too much spending through investment, household borrowing, exporting, and/or government expenditures, or too little saving, importing, and/or taxing could cause prices to rise.
A Word about Expectations
Earlier we noted that expectations of a recession might induce businesses to cut back investment spending in anticipation of a decline in sales. Expectations of a recession could also cause households to increase their saving because they fear possible job losses. Such actions prompted by the fear of a recession can actually trigger a recession. Fear-induced increases in saving bring about a greater leakage from the spending stream, and a reduction in investment lessens this injection into the spending stream. As saving is increased and investment is reduced, the resulting decrease in spending causes output, employment, and income to fall, and the economy slips into a recession.
Expectations
Anticipations of future events; can affect current actions by households and businesses and the likelihood that the future events will occur.
Expectations can also cause or worsen inflation. If households and businesses expect prices to rise, they may try to beat the price increases by buying now what they want and need in the future. This surge in spending may serve only to cause or worsen the inflation that is feared.
It is important to maintain good, positive expectations about the economy. Recovery from a recession is more difficult when households and businesses are unwilling to spend because they are pessimistic about the prospects of recovery. Controlling inflation is more difficult if households and businesses believe that prices will continue to go up in the future and that they will be penalized for postponing their expenditures.
You can check your knowledge of the impact of spending, leakages, injections, the multiplier, the full employment ceiling, and expectations on the economy by completing Test Your Understanding, “Changes in Economic Activity.”
MACROECONOMIC PREDICTORS AND POLICIES
Chapters 4 and 5 have provided a wealth of basic information about the macroeconomy, from data to key terminology to an understanding of the forces that impact how the economy behaves. You now know the indicators of good and bad health in the economy and how that is defined. The constant coverage of economic conditions by the media and the expressions that are used should make you smart about evaluating that coverage.
Part of the interest in economic conditions is in predicting the future, or where the economy is headed. Is it moving into or out of a recession or a recovery? Some of the economic data we have examined give the state of the economy: unemployment and GDP figures, for example. Other data, such as consumer spending and interest rates serve more as predictors. When consumers are fearful of times ahead and cut back on their spending, it has a negative impact on economic activity. Likewise, an increase in interest rates makes investment spending less profitable and inclines businesses toward postponement. The list of predictors, however, is not limited to these data as people also watch many other indicators such as changes in business inventories and measures of consumer confidence. You might enjoy Application 5.4, “Unconventional Indicators of Economic Health,” which gives some of the more unique and quirky predictors that various people have found.
Regardless of where the economy is moving, the goals continue to be full employment, price stability, and full production and economic growth. Since total spending is the fundamental driver of production and employment and sometimes price levels, policies have been designed to affect spending in the economy.
Fiscal policy modifies spending by changing government taxes, transfer payments, and purchases of goods and services. Fiscal policy can increase spending to redirect the economy into an expansion or decrease spending to slow it down. The workings of this strategy for influencing the economy will be discussed in the next chapter.
Fiscal Policy
Influencing the levels of aggregate output and employment or prices through changes in federal government purchases, transfer payments, and/or taxes.
Monetary policy focuses on changing borrowing and, to a lesser degree, saving, or the injections and leakages that flow through financial institutions. This policy falls into the domain of the Federal Reserve, whose actions can change interest rates and the amount of funding available for loans. The Federal Reserve can create conditions that encourage borrowing and spending by households and businesses, or tighten credit and discourage borrowing and spending. The Federal Reserve, loan making, interest rates, and monetary policy are covered in Chapters 7 and 8.
Monetary Policy
Influencing the levels of aggregate output and employment or prices through changes in interest rates and the money supply.
APPLICATION 5.4
UNCONVENTIONAL INDICATORS OF ECONOMIC HEALTH
Over the years, there have been a number of “studies” of unusual predictors of the state of the economy. Here are a few. What do you think might be missing from this list?
Hemline Index
This index is attributed to Wharton Professor George Taylor in 1926, who observed that in good times, like the Roaring Twenties, hemlines were short. When the Depression came in the 1930s, hemlines fell. Thus came the conclusion that has fascinated many over the decades: hemlines are short in good times and long in bad times. The mini made its debut in good times; the long hippy skirts in bad times. Explanations of this trend have varied, including the idea that women couldn't afford stockings during the Depression.
Men's Underwear and Neckties
It is said that these two male wardrobe items are good predictors. Since men's underwear sales tend to be relatively flat, a decline in sales foretells a recession where an increase in sales is just the opposite. A new necktie is a relatively inexpensive way to improve one's appearance when seeking a new job or living in fear of losing one: necktie sales up, economy down.
Lipstick Index
This index was proposed by Estee Lauder's chairman who found that lipstick sales go up in a down economy, which was even true in the Great Depression. It was thought that this is a small luxury when women have less discretionary spending.
The Movies
In bad times, people tend to escape to the movies. Both movie attendance and home movie rentals tend to go up when times are tough. Do you think popcorn sales trend the same way?
Diesel Fuel Sales
An economist at UCLA believes that truckers' diesel purchases are a leading indicator of economic activity. More sales mean more goods and services are being moved; a decline indicates production is going down.
Urban Forecasts
Several urban economists and planners have unusual data they scour. In San Francisco, one looks at Rapid Transit passenger numbers and cars in parking garages closest to a major shopping area. In New York, a measure of Broadway ticket sales tells a story about tourism. In Jacksonville, Florida, it is social services usage that provides needed information. Another economist is eager to find a way to monitor Craigslist for prices on various items while another wants to measure web searches on various topics.
Abandoned Boats
While there does not appear to be a statistical study, there is indication that during a recession people tend to abandon more boats along coastal waterways. When people can't afford the payments on boats, or to maintain or fuel them, or to pay for the costs of proper disposal, they tend to abandon them, leaving local or state governments to deal with the issue.
Urban Farming
Indications are that people are taking up urban farming to save money on groceries, not just because it is trendy.
Sources: Matthew Palevsky and Stephanie Harnett, “Top Ten Unconventional Indicators of The Recession,” www.huffingtonpost.com, updated 05/25/11; The hemline index, money.ca.msn.com; Cari Tuna, “New Ways to Read Economy,” The Wall Street Journal online, April 8, 2010; Jonathan Serrie, “Abandoned boats become Unofficial Economic Indicator,” www.foxnews.com/us/2011/08/08.
Strong opinions and disagreements exist about which policies are best for dealing with problems in the macroeconomy. Various points of view on the proper method for reaching objectives or dealing with problems in the macroeconomy will be covered in the upcoming macroeconomic chapters.
Summary
- Market economies, such as that of the United States, are constantly experiencing expansions and contractions in their levels of real GDP. These recurring upswings and downswings in production are called business cycles. Business cycles affect not only output but also employment and income. Business cycles have four phases: recovery, peak, recession, and trough. The length of time in each phase and its intensity differ from cycle to cycle.
- There are several theories about the causes of economic fluctuations. These different theories are based on differing sets of assumptions and variables.
- Changes in total, or aggregate, spending on new goods and services cause changes in economic activity. An increase in total spending increases output, employment, and income, and the economy grows until it reaches full employment. A decrease in total spending decreases output, employment, and income, and the economy contracts. Total spending is the spending by the household, business, government, and foreign sectors together.
- Household spending on new goods and services, called personal consumption expenditures, is fairly stable as it increases from year to year, and is greater than the combined purchases of businesses, government units, and foreign buyers. Most household spending originates from income earned from producing goods and services. Households can also make purchases from borrowed funds and transfer payments, which are labeled nonincome-determined spending because they do not come from household earned income. These nonincome-determined expenditures are injections into the spending stream. In addition to buying goods and services, households can use income for saving or paying taxes, which are leakages from the spending stream.
- The purchase of new goods such as machinery and equipment by businesses is called investment spending and is a form of nonincome-determined spending. Of the major components of total spending, investment is the least stable and a major source of fluctuations in output, employment, and income. Investment spending is influenced by profit expectations that are affected by the outlook for future economic activity and the interest rate for borrowing funds. Investment spending is an injection into the spending stream: Increases in investment spending stimulate the level of economic activity, and reductions in investment spending lead to reductions in output, employment, and income. Business saving and taxes are leakages from the spending stream.
- Government can influence spending in three areas: the purchase of goods and services, transfer payments, and taxes on households and businesses. Government purchases of goods and services are a form of nonincome-determined spending and are direct injections into the spending stream. Transfer payments provide injections, and taxes are a leakage.
- Expenditures by U.S. buyers on imported goods and services are leakages from the spending stream. Purchases of exported U.S. goods and services by foreign buyers are injections and classified as nonincome-determined expenditures. Net exports is exports minus imports and indicates whether the foreign sector had a net positive or negative impact on total spending. Net exports has tended to be negative over the past few decades.
- Leakages from the spending stream include saving and paying taxes by households and businesses as well as purchases of imports. Injections include household spending from borrowing and transfer payments, business investment spending, government purchases of goods and services, and purchases of exports.
- If all leakages from the spending stream equal all injections, the level of economic activity will continue unchanged. If leakages exceed injections, spending decreases, and the level of economic activity falls. If injections are greater than leakages, the spending stream expands, and the level of economic activity grows.
- An increase or decrease in nonincome-determined household expenditures, investment spending, government purchases, or foreign spending leads to a multiple increase or decrease in the levels of output, employment, and income. The multiplier effect is calculated by dividing the initial change in nonincome-determined spending by the percentage of additional income received by households that is not spent.
- If the economy is operating at or near full employment, increases in spending may lead to demand-pull inflation rather than to increases in output and employment. For this reason, increasing total spending does not always cause the economy to expand.
- Expectations can influence total spending and therefore complicate the job of stabilizing the economy. Because of the effect of expectations on spending, fears can cause self-fulfilling prophecies: The fear of a recession can lead to a recession, and the fear of inflation can lead to inflation.
- The objectives of full production and economic growth, full employment, and stable prices can be accomplished through increasing or decreasing total spending. Fiscal policy influences total spending through changes in government purchases of goods and services, transfers, and taxes. Monetary policy influences spending through changes in the interest rate and money supply, or changes in lending and borrowing.
Key Terms and Concepts
Business cycles
Recovery
Peak
Recession
Trough
Total, or aggregate, spending
Personal consumption expenditures
Income-determined spending
Transfer payments
Nonincome-determined spending
Injections into the spending stream
Financial institutions
Leakages from the spending stream
Investment spending
Retained earnings
Saving–borrowing relationship
Government purchases of goods and services
Exports
Imports
Net exports
Multiplier effect
Expectations
Fiscal policy
Monetary policy
Review Questions
- Identify the four phases of a business cycle and describe the changes in economic activity that occur during each phase.
- What is the basic cause of a recession?
- What is the difference between income-determined spending and nonincome-determined spending? What are the different types of nonincome-determined spending? Why are all nonincome-determined expenditures injections into the spending stream?
- Changes in the level of economic activity are related to changes in the spending of households, businesses, government units, and buyers in the foreign sector.
- How do personal consumption expenditures, investment spending, government purchases of goods and services, and net exports compare in terms of relative size and stability?
- How are personal consumption expenditures affected by taxes, transfer payments, saving, and borrowing?
- How is investment spending affected by changes in the interest rate?
- Why are government expenditures on goods and services a direct injection and government expenditures on transfer payments not a direct injection into the spending stream?
- What effects do transactions in the foreign sector have on domestic levels of output, employment, and income?
- Under what circumstances would an increase in total spending lead primarily to an increase in output, and when would it lead primarily to an increase in prices?
- Identify the various leakages from and injections into the spending stream in a circular flow model of the economy. What is the relationship between leakages and injections when the level of economic activity is expanding, contracting, or remaining unchanged? What role do financial institutions play in the relationship between leakages and injections?
- What is the multiplier effect, and how is it related to nonincome-determined spending and the circular flow of economic activity? What happens to the multiplier effect when the percentage of additional earned income not spent increases? Why does this happen?
- In each of the following cases, calculate the change that occurs in the level of output as a result of the multiplier effect.
- Government purchases of goods and services increase by $600 million, and 20 percent of additional income received is not spent.
- Household spending from borrowing declines by $1 billion, and 30 percent of additional income received is not spent.
- Investment spending increases by $800 million, and 75 percent of additional income received is spent.
- Investment spending increases by $20 billion at the same time that U.S. net exports decrease by $15 billion, and 60 percent of additional income received is spent.
- Household purchases from transfer payments increase by $500 million when the economy is at full employment, and two-thirds of additional income received is spent.
- (Be careful.) Government purchases decrease by $200 million and transfer payments increase by $100 million when people are spending 75 percent of income received.
- Take a large sheet of paper and construct a circular flow model that illustrates all of the leakages and injections in the macroeconomy.
Discussion Questions
- Figure 5.1 shows that since 1985, business cycles in the U.S. economy have had long recovery and relatively short recession phases. Why do you think this has happened? Do you think this pattern is typical of what we can expect from the economy in the future?
- Suppose the economy were in a recession and someone said to you, “If we simply started producing more, the recession and unemployment problems would go away.” How would you evaluate this statement?
- Personal consumption expenditures grow at a relatively constant rate over time, while investment spending fluctuates widely. What reasons might explain why personal consumption expenditures are more stable than investment spending?
- Suppose the economy is in a recession and a member of Congress sponsors a bill to limit imports of vehicles, clothing, and other manufactured goods. The bill, if passed into law, would allegedly ensure that some of the dollars currently leaving the spending stream for imports would instead be spent on domestic products, thereby increasing output, employment, and income, and reversing the recession. Is this bill a realistic solution to reversing the recession? How would you vote for this bill if you were in Congress?
- Expectations play an important role in determining the level of economic activity and how the level of activity will change. What events might cause people to expect a recession? What events might cause people to expect inflation? What could be done to make the economy more predictable and help stabilize expectations?
- Do you think there will be a positive or negative impact on economic activity as the United States pursues more “green” efforts? Consider a move toward more fuel-efficient vehicles and buildings in your answer.
- The multiplier effect is larger or smaller depending on whether households spend more or less of their additional income. What effect might the expectation of a recession have on the multiplier? What effect might the expectation of inflation have on the multiplier?
- Fiscal and monetary policies are designed to influence the level of economic activity through their impacts on total spending. Using the circular flow model, identify the leakages and injections each of these policies affects.
Critical Thinking Case 5 
GETTING SMARTER
Critical Thinking Skills
Identifying valid predictors of future behavior
Determining reliable data to form an opinion
Economic Concepts
Indicators of economic activity
Interpretation of economic data
President Harry S. Truman (1945–1953), frustrated with advisors taking one position on the state of the economy and then backing away to another position, finally reached the point of asking if he could find a one-armed economist who wouldn't say, “… but on the other hand.”
Data are data. It is how they are presented and interpreted that provides differing impressions of the impact of the data in the present and for the future. It is like a half glass of water: one person might see the glass as half full, and another person might see it as half empty.
Take the example of a release of data about U.S. manufacturing for September 2012. The Wall Street Journal online excerpted an article by Josh Mitchell on “U.S. Manufacturing Expanded in September.” Mitchell reported that factory activity expanded and said that “Details in the report were encouraging, with higher readings for new orders and employment. That could point to a rise in hiring and production in coming months.” Included on the site was a video titled “Finally, Some Good News for the Economy.”a
On the same day, with the same data, a headline in The Washington Post read “The manufacturing recovery that wasn't.” Neil Irwin reported that “… the most recent evidence, including survey data released Monday morning, has been a disappointment. The U.S. manufacturing sector isn't collapsing, but it is definitely flatlining.” Further in the article, he asked “Manufacturing recovery? What manufacturing recovery?”b
There are many sources of data about the economy as you have seen in Chapters 4 and 5, from aggregate unemployment to production to price levels to consumer and investment spending to net exports and more. Few people, however, go directly to these data and interpret them themselves as they try to figure out what the future holds. Instead, they go to forecasts about the economy, perhaps plugging “U.S. economic forecast” into a search engine, or going to the business section in a newspaper, or listening to reports on a major television network or on cable, or reading one of the many financial newsletters that investment bankers compile.
And, the half-full or half-empty news could focus on any data that the reporters think are most relevant. They could be applications for unemployment payments, business profitability, the Consumer Confidence Index, actions of the Federal Reserve, changes in inventories, manufacturing numbers, or any other consideration. And, even the unusual indicators of economic activity given in Application 5.4 could be the focus of a news report.
So, what is a good rule when confronting information on the state of the economy? Think about what you are reading and the source of the information. How valid is the information? Is it a “real” predictor? Does the source reporting the information tend to be optimistic or pessimistic?
Think about how much smarter you are after working through Chapters 4 and 5. By now you should be feeling really great about taking a course in economics!
a http://online.wsj.com/article, 10/1/2012.
b http://ww.washingtonpost.com/business/economy, 10/1/2012
Questions
- Why would someone be interested in locating indicators to predict the future behavior of the economy?
- What are some current data that you would consider important in finding valid, reliable indicators of the state of the economy? How could these data help someone predict whether the economy is headed into a recovery or a recession?
- Can you name some sources of economic information that you think have an optimistic outlook? What are some sources that have a pessimistic outlook? Do you think that the political leanings of a news source influence its reports? How?
1 The terms recession and depression do not have the same meaning. A recession is a downswing in economic activity. The Great Depression was a historical event in the 1930s when the United States and other economies experienced sharp reductions in output and increases in unemployment.
2 Economic Report of the President (Washington, DC: U.S. Government Printing Office, 2012), Table B-1; numbers are preliminary.
3 The numbers in Figure 5.5 as well as Figures 5.7, 5.10, and 5.12 are given in real terms. That is, the numbers are adjusted for price increases, or inflation.
4 We are simplifying the saving–borrowing relationship by assuming that 100 percent of borrowed funds are spent. While this may not always be true, it does allow us to understand the impact of this important relationship. To be precise, we would compare saving with spending from borrowing.
5 Economic Report of the President, 2012, Table B-29. Number is preliminary.
6 We are being careful to compare the amount put into the spending stream through government purchases and transfers with the amount taken from the spending stream through taxes. This is because not all transfer payments are used to purchase goods and services, and not all taxes are paid with money that would have been spent. When households receive transfer payments, a portion of what they receive from the government may be saved. When households pay taxes, part of that payment may come from money that would have been used for personal consumption expenditures, and part may come from money that would have been saved. For this reason, assessing the impact of government expenditures and taxes becomes somewhat complex. Let us illustrate with the following example.
Suppose that the government taxes households $100 billion and uses that money to purchase $100 billion of goods and services. Suppose also that $70 billion of that tax is paid with dollars that households would have used for personal consumption expenditures, and $30 billion is paid with dollars they would have saved. Because of this, the tax of $100 billion reduces household spending by only $70 billion. Thus, the net effect of the tax of $100 billion and the expenditure program of $100 billion is to enlarge the spending stream by $30 billion, and the economy grows. In this example, if the government wanted the effect of its spending and taxes to be neutral, it would spend $70 billion and tax $100 billion.
This example could be further complicated by assuming that out of the $100 billion in government expenditures, only $50 billion is spent for the purchase of goods and services and that the other $50 billion goes for transfer payments. The $50 billion spent on goods and services goes directly into the spending stream, but part of the $50 billion in transfers could go into savings. If households saved $15 billion and spent $35 billion, then only $85 billion of the government's total expenditures would go into the spending stream.
7 Economic Report of the President (Washington, DC: U.S. Government Printing Office, 2012), Table B-1. Numbers are preliminary.
8 Be careful when calculating the multiplier effect to always express the percentage of additional income not spent as a decimal. That is, if 20 percent of additional income is not spent, then the multiplier effect is determined by dividing the initial change in nonincome-determined spending by 0.20, not by 20.