
CHAPTER OBJECTIVES
To introduce the three fundamental areas on which macroeconomics focuses: employment, prices, and production.
To introduce unemployment—its causes, consequences, and related data and concepts.
To discuss inflation—its causes, consequences, and measures.
To define full production and economic growth as well as contributing factors and associated costs.
To introduce GDP, the primary measure of production.
To define productivity and discuss changes in U.S. productivity over the years.

This chapter begins the section of the textbook devoted to macroeconomics, which is the study of the economy as a whole, or the “big picture.” Macroeconomics brings us such topics as aggregate (total) employment and production, unemployment, inflation, economic growth, money, and government stabilization policies. (Microeconomics, which focuses on decision making by individual units in the economy, is covered in Part 3 of this textbook.) The study of macroeconomics will help you to understand the roles the household, business, and government sectors play in the economy, and how the sectors relate to each other. We will also learn about problems that arise in the big picture economy and how those problems can be resolved.
Macroeconomics
The study of the operation of the economy as a whole.
Before we begin any analysis, we need to become familiar with some basic terms and concepts involving employment, production, and prices. These three areas are the sources of the major problems of the macroeconomy: unemployment, falling production, and inflation. They are also the basis for the major goals of the macroeconomy: full employment, full production and economic growth, and stable prices. These problems and goals will be explored in this chapter.
In the United States, full employment, full production and economic growth, and stable prices are regarded as important economic goals. As noted in Chapter 2, Congress enacted the Employment Act of 1946 to permit the government to help in creating an economic environment that would lead to the achievement of these goals. This legislation states that:
Employment Act of 1946
Legislation giving the federal government the right and responsibility to provide an environment for the achievement of full employment, full production, and stable prices.
The Congress hereby declares that it is the continuing policy and responsibility of the Federal Government to use all practicable means consistent with its needs and obligations and other essential considerations of national policy … to promote maximum employment, production, and purchasing power. [emphasis added]1
In this act, the government does not ensure that these goals will be achieved. Rather, it commits to providing an environment that will lead to their achievement.
UNEMPLOYMENT AND FULL EMPLOYMENT
One of the primary macroeconomic goals in the United States is employment for all available factors of production, or the minimization of unemployment. Unemployment means that a resource available for production is not being used. While machines, raw materials, warehouses, and trucks can all be unemployed, our primary concern is the unemployment of people who would like to be working but are not. This concern results because the consequences of unemployment among people are obviously more striking.
Unemployment
A resource available for production is not being used.
The most dramatic siege of unemployment the United States has ever witnessed occurred in the Great Depression of the 1930s. From 1932 through 1935, the unemployment rate stayed at 20 percent or more of the civilian labor force, and, in 1933, it reached almost 25 percent.2
Consequences of Unemployment
There is much concern about unemployment, especially among workers, because of several undesirable consequences.
Economic Loss for Society Recall that economics is the study of how people use scarce resources to satisfy unlimited material wants and needs. If more resources are available and put into use, a greater number of wants and needs can be satisfied. If resources are unemployed, some wants and needs that might have been satisfied are not. Thus, unemployment intensifies the scarcity problem.
Each year, the economy produces a certain amount of goods and services. With unemployment, output is less than it could be and substantial amounts of goods and services that could have been produced are lost. For example, in 2010 when the unemployment rate reached over 9.5 percent, the economy produced about $14.5 trillion of goods and services. If many of those unemployed workers had been put to work and the unemployment rate had fallen to 5 percent, a much larger output would have been produced and more wants and needs satisfied.3
Individual Hardships In addition to its effects on society, unemployment causes hardships for people who would like to be working but are not. Unemployment intensifies an individual's struggle with scarcity. When people are out of a job, they are usually forced to alter their spending habits and lifestyles and in some cases make dramatic changes, such as moving into cheaper housing or liquidating assets.
Along with the financial dimension, a person's self-esteem and relationships with others may suffer from unemployment. A number of studies dealing with the psychological and physiological costs of unemployment have shown that the incidence of depression, suicide, mental hospitalization, ulcers, and even the common cold can be affected by being out of work.
In 2010 and 2011, as the economy stalled and decent income earning jobs declined, housing foreclosures rose, food pantries saw some donors become clients while their shelves quickly emptied, children qualifying for free school lunches increased, and applications for jobs soared. Application 4.1, “What's at Stake When a Job Is Lost?,” goes into more detail about the adverse economic and social consequences that can befall the unemployed and those around them.
Types of Unemployment
Before unemployment can be remedied, we need to understand its cause. There is no single cause of unemployment; instead there are three main sources: (1) friction in the labor market, (2) cyclical or periodic changes in the demand for goods and services, and (3) changes in the structure of the economy. These three sources provide a framework for us to define the primary types of unemployment:
- frictional unemployment,
- cyclical unemployment, and
- structural unemployment.4
APPLICATION 4.1
 WHAT'S AT STAKE WHEN A JOB IS LOST?
What causes a person to feel good? According to Sigmund Freud, two main anchors of mental health are love and work. The impact of love on mental health should come as no surprise, but work? People like to complain about work: so-and-so at the office, the meeting that refused to end, the surprise “I need it now” visit from the boss, and other annoyances.
All these complaints notwithstanding, work can have a huge positive impact on a person's sense of well-being. Regrettably, this sometimes becomes apparent only after a job has been lost.
What do people lose when their jobs disappear and the world they've taken for granted is replaced by something much less certain? One important dimension of loss and uncertainty is obviously economic. The loss of a job can dramatically heighten a household's economic insecurity. Now that the job is gone, how much will spending need to be cut? Will we be able to meet our rent or mortgage and auto payments? What's going to happen to our credit card debt? Will we be able to afford our daughter's tuition?
And the economic concerns are not just about right now. The loss of a job can make the future very cloudy. The length of unemployment and its impact on a household's savings and borrowing are unknown, as is the income from a future job.
But the impact of job loss can go far beyond economics. The everyday structure and routine provided by going to work is gone. This, in turn, can disrupt and dramatically change household responsibilities, authority, and schedules. Also gone is the status conferred by employment, and along with it may go a person's sense of self-esteem, confidence, and contribution to the household or community. Finally, it can be hard to maintain friendships if they are with people with whom a person used to work and no longer frequently sees.
What personal and social consequences can come from job loss? Studies indicate that job loss can cause depression, increased anxiety, and a greater risk for suicide, alcohol abuse, traffic accidents, and criminal or violent behavior. Those close to people who have lost their jobs can suffer as well. Spouses of people who have lost their jobs have been shown to have a higher incidence of psychiatric disorders than do spouses of people who are working. Not surprisingly, unemployment has been linked to spouse and child abuse, and it is a contributing factor to separation and divorce.
Based on: Richard H. Price, Daniel S. Friedland, and Amiram D. Vinokur, “Job Loss: Hard Times and Eroded Identity,” in Perspectives on Loss: A Sourcebook, ed. John H. Harvey (Philadelphia: Brunner/Mazel, 1998), pp. 303–310.
Frictional Unemployment Some job seekers have voluntarily quit a job to search for another one. Some may be entering the job market for the first time or after a period of not looking for work. These job seekers will likely experience a short period of unemployment while they collect references, fill out applications, follow up leads, and interview with prospective employers. The inability to make quick and smooth transitions from old employment situations to new jobs comes from “friction” in the labor market. Thus, the frictionally unemployed are job seekers voluntarily out of work for a short period of time while they search for new prospects.
Frictional Unemployment
Occurs when people are voluntarily out of work for a short period of time while searching for a job.
In a large, complex economy like the United States, people are always voluntarily unemployed: We always have some frictional unemployment. These job seekers may have quit a job because they were unhappy with it, want to relocate or change their occupation, or have some other reason. Because frictional unemployment always exists, when we say that the economy is at full employment we do not mean that 100 percent of the labor force is working. Rather, full employment means that everyone in the labor force except the frictionally unemployed is working.
Full Employment
Occurs when only those voluntarily out of work are unemployed, or the unemployment rate includes only frictional unemployment.
Cyclical Unemployment Market economies do not produce goods and services at a constant rate over time. Rather, market economies go through upswings and downswings in production called business cycles. Periodically, the economy falls into a downswing, or recession, during which the demand for goods and services decreases. When this happens, workers producing those goods and services may be involuntarily laid off. This type of unemployment is termed cyclical unemployment because it is the result of a recession, or a downswing in the business cycle.
Cyclical Unemployment
Involuntary unemployment that results from a downswing in a business cycle, or a recession.
Cyclical unemployment is a matter of serious concern because, unlike frictional unemployment, it is involuntary and continues until the economy breaks out of the recession. A downturn could be a matter of a few months and involve a relatively small number of workers, or it could last for several years and extend to millions of households. As we noted earlier, the unemployment rate was at 20 percent or more for several years during the Great Depression. More recently, the unemployment rate rose from 4.6 percent in 2007 to 10 percent in October 2009 due largely to a cyclical downswing in the economy.5
Some industries are more sensitive than others to changes in general economic conditions, and workers in these industries are particularly vulnerable to cyclical unemployment. When a recession is looming, consumers may postpone purchases of durable goods, such as new homes and automobiles, and businesses may postpone, or even cancel, purchases of capital goods, such as heavy machinery and buildings. As sales decline, workers in these industries may be laid off. Auto, heavy manufacturing, and construction workers are among those especially susceptible to cyclical unemployment. Sometimes workers who are young and lack seniority are vulnerable to cyclical unemployment.
Structural Unemployment Like cyclical unemployment, structural unemployment is involuntary. It occurs when a worker loses a job because that job is no longer a part of the structure of the economy. The good or service the worker produced may no longer be demanded or may now be made in a way that eliminates that particular job. Unlike cyclical unemployment, structural unemployment offers no prospect for rehire in the future.
Structural Unemployment
Involuntary unemployment that results when a worker's job is no longer part of the production structure of the economy.
Structural unemployment can come from several factors: technology, changes in the goods and services people demand, reorganization as firms downsize or merge, competition from cheaper foreign goods, and the closure of domestic manufacturing plants as companies move facilities to another country. In today's fast-paced economy, there are many examples of structural unemployment. With up-to-date computers and software, fewer people are needed to perform clerical tasks in offices. Hightech automated equipment is replacing manufacturing workers in industries like automobiles; reorganizations are eliminating administrators and mid-level managers; banking transactions online lessen the need for tellers; and in the arts, studio musicians and graphic artists are being replaced by sophisticated software.
A structurally unemployed person faces the difficulty of finding a new occupation, which could mean that time and money are needed to retrain or family and friends are left behind because relocation is necessary. Structural unemployment imposes a real hardship on older workers who might need costly retraining and face competition with younger workers willing to accept a lower salary.
Continued technological advancements, efforts by firms to operate more efficiently, and foreign competition promise to bring about more structural changes in the U.S. economy and to threaten many types of blue-collar and white-collar jobs. As a result, there is some concern that the middle class is shrinking as semiskilled jobs are eliminated, leaving a workforce of highly paid, highly skilled workers and poorly paid, unskilled workers. Retraining workers and lifelong education are essential to meet changing job requirements in the U.S. economy.
EMPLOYMENT AND UNEMPLOYMENT: MEASURES AND STATISTICS
In this section as well as others in this chapter and the textbook, there are references to important economic performance measures. These are often used by the media, but most certainly by those who try to gauge the current state of the economy or to study it over a longer historical trend.
This text provides the latest available data at the time of its publication and gives you an indication of how those data have changed over time. If you want the current, latest data or if you want to delve deeper into the history of a data set, it is easy to do. The federal government collects this information and makes it available on websites that various bureaus maintain.
- The annual Economic Report of the President, released each February, contains extensive data appendices of a large number of economic indicators. The tables typically contain data over some time span and the format is easy to read. You can access the Economic Report through www.whitehouse.org or the federal digital system at www.fdsys.gov.
- The Bureau of Labor Statistics gathers and publishes employment and overall price level information such as the Consumer Price Index. There is a wealth of national and regional information as well as aggregated and subset numbers. You can access these at www.bls.gov.
- The Bureau of Economic Analysis (BEA) collects and publishes data regarding production, such as the Gross Domestic Product (GDP), and related areas like consumer spending, as well as regional and international product and income data. You can access these at www.bea.gov.
The data tables in this text are sourced so that you can easily find additional current or historical data relevant to that table. See the footnotes in each table for the data source.
Labor Force, Participation Rates, and Unemployment
When we talk about the labor force, the employed, and the unemployed, whom do we include and how do we arrive at the numbers we use?
The labor force is defined as all persons 16 years of age and older who are working or actively seeking work. If a person is capable of working but is not working and not interested in seeking work, then that person is not included in the labor force. It is the activity directed toward employment, not the capability of holding a job, that determines whether a person is or is not in the labor force.
Labor Force
All persons 16 years of age and older who are working or actively seeking work.
Table 4.1 gives some frequently reported statistics on the labor force. The second and third columns of the table give, respectively, the number of people eligible for, and the number actually in, the labor force for selected years.6 It is important to appreciate how many millions of people are in the U.S. labor force: almost 154 million in 2011.
Participation rates for the labor force are given in the fourth column of Table 4.1. The term participation rate refers to the percentage of some group that is in the labor force. The group could be the entire eligible population, women, persons in different age groups, and so on. According to Table 4.1, in 2011, 64.1 percent of those eligible for the labor force were in the labor force. That is, approximately 154 million people out of a population group of approximately 240 million were employed or seeking work.
Participation Rate
The percentage of some specified group that is in the labor force.
TABLE 4.1 The Labor Force, the Participation Rate, and Unemploymenta
Many labor-related statistics are collected in the United States. Some of the most important are the labor force, the participation rate, and the unemployment rate.

TABLE 4.2 Participation Rates: Civilian Labor Force and Subgroups, Selected Years
Participation rates differ among subgroups in the labor force. Changes in participation rates affect the composition of the labor force over time.

Source: Economic Report of the President (Washington, DC: U.S. Government Printing Office, 2012), Table B-39.
The fifth and sixth columns of Table 4.1 give some data on the unemployed. Column five shows the number of unemployed persons in the labor force, and column six gives the unemployment rate, which is the percentage of the labor force that is unemployed and actively seeking work. For example, the unemployment rate of 8.9 percent in 2011 indicates that 13,747,000 persons in a labor force of 153,617,000 were unemployed and actively seeking work.
Unemployment Rate
The percentage of the labor force that is unemployed and actively seeking work.
Along with overall labor force numbers, participation rates and unemployment rates are also calculated for various subgroups. Table 4.2 provides a sample of participation rates for some labor force subgroups for selected years. It shows, for instance, that in 2010, 58.6 percent of all women 16 years of age and older were working or actively seeking work. Participation rates are important because, when examined over time, they show us changes in the composition of the labor force. For example, we can see in Table 4.2 that over the past few decades there has been, in general, an increase in the overall labor force participation rate, with much of this growth due to the increased participation of women. At the same time, the table shows a drop in the participation rate for men. What do you think is causing women to increasingly join—and men to increasingly leave—the labor force? Why do you think the participation rate for teenagers has decreased since 1980? It should also be noted that in 2010 there was a decline in all participation rates due to prolonged unemployment that led to discouraged workers—a concept that will be covered shortly.
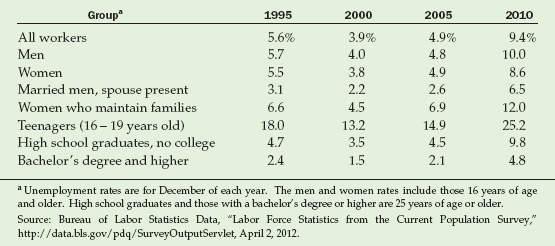
Table 4.3 lists unemployment rates for selected labor market subgroups during several different years. We can make some interesting observations. Notice the disparity in the unemployment rates of the various subgroups for any given year. For example, in 2010 the unemployment rate for married men was 6.5 percent, compared to 25.2 percent for teenagers and 10.0 percent for all men. You might also notice that, over time, some groups tend to have higher unemployment rates, and other groups have lower rates. For example, the data in Table 4.3 show a better employment experience for married men (compared to all workers taken as a group), but not for women who maintain families. Also, people with a bachelor's degree or higher fare better than any other subgroup listed. These statistics raise an important policy question: should government unemployment programs be directed toward the unemployed generally or toward specific groups?
TABLE 4.3 Unemployment Rates: All Workers and Labor Force Subgroups, Selected Years
Over the years, some groups in the labor force, such as teenagers, have faced more severe unemployment problems than other groups.
Calculating Unemployment Statistics
The U.S. Department of Labor, Bureau of Labor Statistics (BLS), calculates unemployment rates and other labor force data on a monthly and annual basis.7 Each month's calculations are published by the BLS, and the overall unemployment rate is given wide coverage by the media. Contrary to what many people think, unemployment statistics are not based on numbers reported to the U.S. government by state employment offices. Rather, they are derived from a survey conducted for the BLS, called the Current Population Survey.
Each month a scientifically developed sample of households from across the United States is surveyed through interviews. On the basis of their responses, persons are classified as employed, unemployed, or not in the labor force.
Many people find the requirements to be classified as employed a surprise. A person is classified as employed if, during the survey week, that person
- did any work—even just 1 hour—as a paid employee, or in his or her own business, profession, or on his or her own farm,
- worked without pay for 15 or more hours in a family-operated business, or
- was temporarily away from a job or business due to illness, weather, vacation, labor-management disputes, or personal reasons.
As a result of the way in which we officially classify the employment status of people, many who are seeking to work more hours or full-time while doing limited work for themselves or others (even just 1 hour of work per week) show up as “employed” in government data.
Interpreting Unemployment Statistics
There are some subtle, but important, details we should keep in mind when evaluating unemployment statistics.
Sometimes people become discouraged workers: They search unsuccessfully for a job for a long time, then lose hope for employment, give up the job search, and drop out of the labor force. Because the unemployment rate measures only those who are unemployed and actively seeking work, discouraged workers are excluded from the statistic: They are not counted as unemployed. By excluding discouraged workers, the unemployment rate understates the true level of unemployment in the economy.
Discouraged Workers
Persons who drop out of the labor force because they have been unsuccessful for a long period of time in finding a job.
The number of discouraged workers changes with economic conditions. It is higher when the economy is in a downswing and work is harder to find than when the economy is close to full employment and work is easier to find. For example, in 2000 when the unemployment rate was 4 percent, the number of discouraged workers was 321,000 and in 2010 when the rate was 9.6 percent, the number of discouraged workers rose to 1,173,000.8
The overall unemployment rate is a national figure and does not tell us the unemployment situation in various parts of the country. With such a diversity of industries in the United States, it is possible that a slowdown in one of them, such as the auto industry or defense-related airplane manufacturing, will have a significant regional impact that is greater than the impact on the country as a whole. Think about the region in which you live. What industries are at the base of its economy? What impact would a slowdown in one of these have on your region?
The overall unemployment rate provides no information about the jobs held by the employed. It does not indicate how many people classified as employed are working part-time but are seeking permanent full-time work. Recall that even one hour of work can label a person as employed. With the increasing costs of health insurance and other benefits, there has been substantial growth in temporary and part-time employment.
The overall unemployment rate does not provide information about those who are underemployed. Underemployment occurs when the full capabilities and skills of a resource are not utilized. Many people with valuable skills and good educations will accept unskilled jobs rather than be unemployed. When times are tough due to a prolonged downturn in the economy, people will often “take what they can get” in order to pay the rent and put food on the table. Sometimes college graduates or those with years of professional employment spend time as food servers because it pays the bills.
Underemployment
A resource is not used to its fullest productive capability.
The Goal of Full Employment
As stated earlier, full employment is a major macroeconomic goal. However, full employment does not mean that 100 percent of the labor force is working. It means that only those who are voluntarily out of work are unemployed.
What is the unemployment rate at which full employment occurs? What percentage of the labor force tends to be voluntarily, or frictionally, unemployed? There are no hard-and-fast answers to these questions.
The rate of unemployment associated with full employment has changed over time. Over the past few decades, we have thought full employment was anywhere between 4 percent and 6 percent. As changes in the structure of the economy have occurred, we have periodically reevaluated the unemployment rate associated with full employment. Changes in the composition of the labor force brought about by the increased participation of women and changes in government unemployment compensation payments have contributed to this reevaluation. But, importantly, finding the unemployment rate associated with full employment has been complicated by the growth in temporary and part-time work where there tends to be more work and where people who accept these types of jobs are counted as employed, even though they want to work full-time.
Conceptually, full employment means that all resources available for production are fully utilized. Thus, the statistic called “full employment” may not perfectly represent the economic concept of full employment.
The ultimate test of where the full employment rate is may be inflationary pressure. As you will soon learn in the next section, a market economy that is operating at full employment, or at capacity, has a tendency to experience inflation.
The Natural Rate of Unemployment Some economists believe that achieving the natural rate of unemployment, a different measure than full employment, should be the goal of the macroeconomy. The natural rate of unemployment includes the frictionally and structurally unemployed, or is the rate at which there is no cyclical unemployment. Because it includes the structurally unemployed, the natural rate is higher than the full employment rate and can be achieved with more unemployed workers. The natural rate of unemployment has become a popular goal with some policymakers because traditional macroeconomic stabilization tools, which will be introduced in the next few chapters, are more suited to dealing with cyclical than with structural unemployment. Also, cyclical unemployment is typically of shorter duration than structural unemployment.
Natural Rate of Unemployment
The unemployment rate that includes the frictionally and structurally unemployed; occurs when cyclical unemployment is eliminated.
INFLATION AND STABLE PRICES
Another major macroeconomic goal in the United States is to maintain stable prices, or to control inflation. Like unemployment, inflation can have serious consequences. Inflation occurs when there is an increase in the general level of prices. It does not mean that prices are high, but rather that they are increasing. For example, assume that over the past two years the price of a certain collection of goods has been stable at $100 in country A and has gone up from $10 to $30 in country B. Country B, not country A, faces a problem with inflation. Inflation refers to price movements, not price levels.
Inflation
An increase in the general level of prices.
Since inflation refers to an increase in the general level of prices, the price of every good and service need not increase. An inflation rate of 7 percent does not mean that all prices are increasing by 7 percent. Rather, it means that, on average, prices are going up by that amount. Also, an increase in the general level of prices is not necessarily a matter of concern. An economy with an inflation rate of 2 or 3 percent a year does not have a problem. But, when prices increase quickly by a large percentage, such as 8 percent to 10 percent or more per year, inflation becomes a serious issue.
How serious can inflation become? Some countries in Europe during the 1920s provide a classic example of hyperinflation, or rapid price increases. In January 1922, 48 German paper marks were worth 1 German gold mark. By July of that year, it took 160 paper marks to buy 1 gold mark, and by November 1923 it took over 1 trillion paper marks to equal 1 gold mark. But perhaps the worst incidence of hyperinflation occurred in Yugoslavia, when prices increased by 5 quadrillion percent (that's 5,000,000,000,000,000 percent) from October 1, 1993, to January 24, 1995.9
Hyperinflation
Extremely rapid increases in the general level of prices.
FIGURE 4.1 The Purchasing Power of Income

A person whose 1990 income provided $35,000 to spend or save after income-based taxes were paid needed to earn $58,381 after taxes in 2010 just to keep up with inflation.
Source: Bureau to Labor Statistics, Consumer Price Index, All Urban Consumers, All items, ftp://ftp.bls.gov/pub/special.requests/cpi/cpiai.txt.
Consequences of Inflation
When an economy experiences inflation, several problems emerge. Inflation can
- intensify scarcity when income does not rise as quickly as prices;
- penalize some groups, such as savers and lenders receiving low interest rates;
- change the value of assets; and
- be politically and socially destabilizing.
Inflation and Income Unemployment intensifies scarcity by reducing or even terminating the incomes of some people. Inflation can also reduce a person's income—not in the same way as unemployment—by reducing the purchasing power of money. With inflation, a given amount of money, or nominal, income—income measured in terms of current dollars—buys fewer goods and services. Expressed differently, inflation causes real income, or income measured in terms of the goods and services that a sum of money income can purchase, to fall. As a result, people's scarcity problems increase when money incomes do not rise as rapidly as prices.
Money (Nominal) Income
Income measured in terms of current dollars.
Real Income
Income measured in terms of the goods and services that can be purchased with a particular amount of money income.
So, how much must money income increase in the face of inflation to sustain the same purchasing power, or real income, from year to year? Figure 4.1 offers an answer. Let's assume that in 1990 a person had $35,000 to spend (or save) after all income-based taxes including Social Security and Medicare were paid. By 1995, that person needed $40,811 after taxes to purchase the same amount, and by 2010, $58,381 was needed after taxes just to keep pace with 1990. Notice in this figure that from 1990 to 2010, an additional $23,381 was needed just to keep up with inflation.
Inflation hits some income groups harder than others. People living on a fixed income, such as a pension, are particularly susceptible to inflation. If the size of a pension check remains unchanged while prices keep rising, the purchasing power of that check keeps shrinking. Over time, with serious bouts of inflation, retired persons dependent on fixed incomes may suffer greatly from a declining standard of living. For example, if Figure 4.1 applied to a person who retired in 1990 and began receiving a fixed $35,000 a year pension that person would have serious problems as inflation rose and there was no adjustment in the pension. Imagine how difficult it would be to maintain a 2010 lifestyle with that frozen 1990 pension.
Contract workers may also be hurt by inflation if their contracted wage increases are less than the inflation rate. For example, the teachers in a school district might sign a contract that provides for an annual wage increase of 4 percent over the next three years, and then encounter inflation rates that range between 6 percent and 9 percent. These teachers will experience a decline in their real standards of living. To avoid this situation, many contracts provide cost-of-living adjustments (COLAs), which are automatic wage or payment increases when prices go up.
Cost-of-Living Adjustment (COLA)
An arrangement whereby an individual's wages automatically increase with inflation.
Inflation and the Interest Rate Lenders, borrowers, and savers refer to the price of money as an interest rate. Interest rates determine how much savers receive for their money, how much borrowers pay for loans, and how much lenders receive for making a loan.
Interest Rate
The price of money; determines the return to savers and lenders of money, and the cost to borrowers.
Those who save can be hurt by inflation if the interest rate they receive is less than the rate of inflation. For example, if you put $10,000 in a three-year certificate of deposit that earns 3 percent interest a year and the inflation rate averages 5 percent a year during this time, at the end of the three years the $10,000 plus interest is worth less in terms of its purchasing power than it was when you put it in the bank. Also, you will have had to pay income tax on the interest earned from the money, further reducing its buying power.
Lenders may also be hurt by inflation if the interest rate they charge is less than the rate of inflation and if the terms of the loans are fixed and cannot be altered to allow interest rate increases. This problem sometimes occurs when a lender makes a long-term loan commitment.10 Experience has taught many lenders to transfer risks to borrowers. Many home mortgages are currently made with variable rates and flexible terms.
On the other hand, borrowers can benefit from low interest rates, especially if inflation occurs. Consider the wave that began about 2002 when large numbers of homeowners sought to refinance their homes at historically low rates. These lower interest rates significantly reduced monthly mortgage payments. When homeowners lock in low mortgage rates or students lock in low rates on student loans, they transfer much of the risk of inflation to the lenders of such loans.
When we evaluate how inflation affects savers and borrowers, we need to consider the real rate of interest. The real rate of interest is the nominal, or stated, interest rate minus the inflation rate. For example, if the nominal interest rate on a certificate of deposit (CD) is 6 percent and the inflation rate is 8 percent, the real rate of interest on the CD is −2 percent: The saver is hurt by inflation. If the inflation rate is 3 percent during the term of a 6 percent CD, the real rate of interest is 3 percent: The saver has gained by saving.
Real Rate of Interest
The nominal, or stated, rate of interest minus the inflation rate; a nominal interest rate adjusted for inflation.
TABLE 4.4 Winners and Losers from Inflation
For some people inflation creates opportunities and for others it creates problems.
| Winners | Losers |
| People with after-tax income rising faster than the rate of inflation | People on fixed incomes or working under contracts with wage increases below the inflation rate |
| Borrowers paying back loans at an interest rate less than the inflation rate | Savers and lenders earning interest rates below the inflation rate |
| Owners of assets that increase in value with inflation | People who want to buy assets that are rapidly increasing in price |
| Politicians gaining support because of their position on inflation | Politicians losing popular support because of their inability to control inflation |
Inflation and Wealth Although people may use the terms income and wealth interchangeably, each has a very different meaning. Income is a flow of earnings from selling factors of production. Wealth measures the value of people's tangible assets, or what they own. Wealth includes stocks, bonds, real estate, cash, diamonds, fine art, and such. Someone could have a large income and little wealth, or great wealth and a small income.
Wealth
A measure of the value of tangible assets; includes such items as real estate and corporate securities.
During inflation, many assets appreciate, or increase in value, as prices rise. Thus, the wealthy become wealthier. Consider real estate. A home valued at $100,000 in 1995 might well be worth $200,000 today largely as a result of inflation.
While inflation often benefits people who have wealth, it penalizes people who are looking to make asset purchases. Again, consider real estate. As prices rapidly increase, people who want to purchase a home—the largest asset purchase for most people—find it more difficult. Young adults who are trying to purchase that first home pay a high penalty for inflation.
Social and Political Consequences of Inflation In addition to its economic consequences, inflation may have social and political implications as well. Inflation-related issues often form planks in election campaigns as candidates trade blame and offer solutions.
If prolonged or severe enough, inflation might lead not only to changes in leadership but also to changes in social and political institutions. The eminent British economist John Maynard Keynes wrote, “There is no subtler, no surer means of overturning the existing basis of society than to debauch the currency.”11 The rise of Adolf Hitler and Nazism can be traced in part to the discontent and social disruption caused by the German hyperinflation of the early 1920s.
Table 4.4 summarizes who gains and who loses from inflation.
Causes of Inflationary Pressure
Since inflation is an upward movement in the general level of prices, and prices result from the interaction of buyers' and sellers' decisions, economists have created a logical way of classifying the causes of inflation. Inflation that originates from pressure on prices from the buyers' side of the market is termed demand-pull inflation. Inflation that originates from pressure on prices from the sellers' side of the market is called cost-push inflation.
Demand-Pull Inflation When buyers' demands to purchase goods and services outstrip sellers' abilities to supply them, prices on available goods and services rise, and demand-pull inflation occurs. When this demand-based spending subsides, so does the pressure on prices.
Demand-Pull Inflation
Pressure on prices from the buyers' side of the market; tends to occur when spending is greater than the productive capability of the economy.
Demand-pull inflation has a tendency to occur when the economy is close to or at full employment. Recall that at full employment the economy is at full capacity. Since it is producing the maximum amount of goods and services possible, production cannot be easily expanded. At the same time, consumer demand for goods and services is high because more people are working and have money to spend. Businesses may now also find it profitable to expand and begin to spend on investments in new buildings and machinery. This spending pressure by households and businesses, coupled with production at or near capacity, sets off demand-pull inflation.
Demand-pull inflation is also related to the amount of money in the economy. The ability of households and businesses to spend depends in part on the amount of money available for spending. If the supply of money in the economy increases at a faster rate than production, upward pressure on prices can result. If the economy is at full employment and more money is put into the hands of businesses and consumers, the result will be inflationary. Thus, too much money in the economy and in the hands of businesses and consumers can contribute to demand-pull inflation.
Cost-Push Inflation When price pressure comes from the sellers' side of the market, cost-push inflation occurs. In this case, increases in sellers' costs are wholly or partially passed on to buyers, who will then face higher prices. Anything that is a cost to a business is a potential source of price increases and, if significant enough, of cost-push inflation. Upward pressure on prices could come from increased costs of labor, raw materials, fuels, machinery, borrowing, and even attempts to increase profit.
Cost-Push Inflation
Pressure on prices from the sellers' side of the market, particularly from increases in costs of production.
Classic examples of cost-push inflation have come from oil price increases. In the 1970s and 1980s, energy prices contributed to serious inflation when a barrel of oil that sold for $3.18 in 1970 jumped to $31.77 in 1981. In 2008, oil-induced inflation again surfaced when the price of a barrel of oil increased from $69.61 in July 2007 to $137.11 in July 2008.12
More likely, cost-push inflation results when costs push up the prices of businesses that play a large role in the economy, such as car manufacturers, or when the costs push up the prices of a significant number of firms. Increases in the costs of energy, for example, have an impact on almost every seller, large or small, in the economy. There are also fears that the increasing costs of health care will contribute to inflation.
APPLICATION 4.2
THE $4 SUMMER OF 2008
It seemed that the United States needed to add a $4 bill to its currency during the summer of 2008. Quite suddenly the price of two staples of ordinary life—gas and milk—hit $4 a gallon. The $4 price of these key necessities wrecked family budgets, summer vacation plans, and trips to visit grandma. For some businesses, from pizza delivery to household moving companies, these price increases caused huge havoc. Even cities suffered as they gassed up their three-mile-per-gallon fire trucks.
We knew an oil-based energy problem was looming. Americans became used to gas-guzzling SUVs and trucks as these vehicles zoomed in popularity. We neglected to fund good public transportation. China and India were growing quickly and putting huge demands on energy sources. There was disruption in oil supplies with the war in Iraq. But, what we didn't anticipate was the suddenness and severity of the rise in oil and gasoline prices.
We also didn't think that another staple of ordinary life—milk—would take such a large price jump. Yet, it was another consequence of the energy crisis. As alternatives to fueling vehicles with gas were pursued, there was a turn toward ethanol. Ethanol is produced primarily from corn, a key ingredient in the diet of farm animals. Farmers who paid $2.04 for a bushel of corn in 2006 were suddenly faced with prices in excess of $5.70 per bushel in June of 2008 as the demand for corn increased.a
There are not many good alternatives to a gallon of gas or a gallon of milk. In the summer of 2008, families were stuck with figuring out how to purchase these necessities and live within their means. But, for many businesses to survive, there was no choice but to raise the price of their products. This included farmers in the dairy business and food suppliers who had to haul goods by truck.
Here is a tale of cost-push inflation. By late summer 2008, the $4 gallon was certainly fueling inflation. CPI data indicated that prices increased over the summer by 7.2 percent and that energy increased by a whopping 32.9 percent.b Inflation—cost-push inflation—reared its ugly head.
a “Monthly Average Corn Farm Price Received in Illinois for the 1960–2008 Calendar Year(s)”, www.farmdoc.uiuc.edu, August 14, 2008.
b Bureau of Labor Statistics, “Economic News Release, Consumer Price Index Summary,” http://www.bls.gov/news.release/cpi.nr0.htm. Figures are percent changes in CPI for all urban consumers (CPI-U) for June, July, and August 2008.
Cost-push and demand-pull inflation can come simultaneously and have a potential to spiral. An increase in overall spending that leads to demand-pull inflation could cause people to negotiate higher wages to compensate for the inflation. Employers who now face increased wage costs may pass them on to buyers through higher prices. It is easy to see the escalating pattern of inflation as rising prices from increased spending can fuel increased wages that can fuel increased prices to cover them. Application 4.2, “The $4 Summer of 2008,” focuses on cost-push inflation. Can you see from this application the potential for a spiraling of prices as people seek higher wages to cope with the inflation?
The Role of Expectations Expectations about inflation can cause inflation to occur. On the demand-pull side, buyers' fears of higher prices in the future may lead them to increase their current spending before the expected higher prices become reality. At full employment, this increased spending puts additional pressure on an economy already operating at productive capacity and results in inflation. On the sellers' side, firms that expect increasing costs might raise prices in anticipation of those higher costs. Thus, a curious situation results in which the expectation of rising prices can trigger inflation.
Measures of Inflation
We measure changes in price levels by using a scale called a price index. Price indexes use percentages and provide an easy method to compare and evaluate price changes. The government maintains three primary price indexes to measure inflation, each focusing on the prices of a collection of goods and services important to a particular segment of the economy. These are
The annual dollar outlays over time for a market basket of goods and services are converted to a percentage scale called a price index. Year 2 is the base year of this index.

- the Consumer Price Index (CPI), which focuses on goods and services typically purchased by households;
- the Producer Price Index (PPI), which focuses on production inputs purchased by businesses; and
- the GDP Price Index, which measures price changes in the economy as a whole.
Before we examine these indexes, we will work through an exercise that will help you understand what a price index is, how it is constructed, and how it is interpreted.
Constructing a Price Index A price index is a measure of price changes using a percentage scale. A price index can be based on the prices of a single item or a selected group of items, called a market basket. For example, several hundred goods and services, such as housing, electricity, and automobiles, are used to calculate the Consumer Price Index. Because a market basket includes a range of goods and services, it is a more comprehensive measure of inflationary pressure than a single item.
Price Index
Measures changes in the price of an item or a group of items using a percentage scale.
Table 4.5 demonstrates how to calculate a simple price index. The column headed Dollar Outlay for Market Basket gives the expenditure required to purchase the same items in years 1 through 6. Notice that this expenditure increases each year: The same goods and services that cost $475 in year 1 cost $600 in year 4.
Actual dollar outlays for the market basket are converted to a percentage scale, the price index, which is shown in the right-hand column of Table 4.5. To create an index, a base year is selected to serve as the year against which all other years' prices are compared. The base year is given the number of 100.0, or 100 percent, in the index. In Table 4.5, year 2 is the base year.
Base Year
The year against which prices in other years are compared in a price index; given the index number 100.0.
The index numbers for the other years represent, in percentages, how many more or fewer dollars than base year dollars are needed to buy the same items. The equation for calculating an index number for a given year is
![]()
TABLE 4.6 Consumer Price Index: All Items and Various Categories for Selected Years (1982–1984 = 100.0)
The Consumer Price Index measures changes in the prices of goods and services that consumers typically purchase. Increases in prices for some components in the index, such as medical care, have been greater than the increase in the overall index.

For example, in year 4, $600 is needed to buy what $500 bought in the base year. Putting these numbers into the equation yields
![]()
The price index number of 120.0 indicates that prices have gone up by 20 percent from year 2 to year 4. Expressed differently, a person must spend an additional $100, or 20 percent more, in year 4 to buy what $500 bought in year 2, the base year.
The same goods and services that cost $500 in year 2 cost $475 in year 1. Using the price index equation, this means that the index number for year 1 is ($475/$500) × 100 = 95.0. Only 95 percent of the dollars used in year 2 were needed in year 1 to buy the same basket of goods. Prices were 5 percent lower in year 1 than in the base year.
Consumer Price Index (CPI)
Measures changes in the prices of goods and services that consumers typically purchase, such as food, shelter, clothing, and medical care.
We read the index numbers for each of the remaining years in the same way as years 1 and 4. The index number of 125.0 for year 5 indicates that prices are 25 percent higher in year 5 than in the base year, and the dollar outlay of $750 in year 6 is 50 percent higher than the outlay required in the base year.
The Consumer Price Index The Consumer Price Index (CPI) measures changes in the prices of goods and services typically bought by consumers. In Table 4.6 we see, for selected years, the overall CPI as well as separate indexes for various categories of goods and services within the CPI, such as rent, medical care, and household energy. In this table, the base year comes from averaging prices over three years: 1982, 1983, and 1984.13
We can make some interesting observations about the CPI from this table. In the All Items column, notice the movement in overall consumer prices over the years. What households could purchase for $100 on average in the base period cost $38.80 in 1970 and $224.90 in 2011. Also observe in Table 4.6 that the prices in some categories of goods and services increased by less or by more than the overall index. In the Apparel category, the index numbers are less than the overall CPI and fell for many years listed. Medical Care, however, is much higher than the overall index and grew much faster. Given the Medical Care numbers, there should be no surprise that health care costs are an ongoing concern and political issue.
Because a price index compares price changes between a given year and a base year, rather than year-to-year, annual percentage changes in prices, or inflation rates, are not obvious. As a result, Table 4.6 may mask serious inflationary problems the United States faced in the 1970s and early 1980s. Figure 4.2 traces the annual percentage change in the CPI from 1970 through 2011.14 This figure illustrates that inflation was particularly serious in 1974 and 1975, and from 1979 through 1981. Beginning in the mid-1980s and continuing into the twenty-first century, inflation has been much less of a problem for households.
Changes in the Consumer Price Index and other indexes are calculated monthly. Because they show monthly changes, the numbers are usually small. These monthly changes must be compounded to arrive at an annual figure for comparison. That is, if a 1.1 percent monthly change in the prices of all items were to persist throughout the year, it would lead to an annual inflation rate of 14.0 percent.
Other Price Indexes As noted earlier, two other indexes, in addition to the CPI, are watched when measuring inflation in the economy: the Producer Price Index and the GDP Price Index.
The Producer Price Index (PPI) measures changes in the prices that businesses pay for materials they consume, such as energy and supplies, and goods and services they buy for further sale. Just as with the Consumer Price Index, the government calculates and announces the Producer Price Index monthly. The PPI has an important connection to the CPI and is watched carefully. Changes in the prices that businesses pay now often contribute to changes in the prices that consumers pay later. As a result, changes in the PPI may lead to future changes in the CPI.
Producer Price Index (PPI)
Measures changes in the prices of goods and services that businesses buy, either for further processing or for sale to a consumer.
FIGURE 4.2 Annual Percentage Changes in the Overall CPI

The United States experienced serious inflation problems in 1974 and 1975, and in the late 1970s and early 1980s.
Source: Economic Report of the President (Washington, DC: U.S. Government Printing Office, 2012), Table B-63.
The GDP Price Index is used to measure price changes for the entire economy and is calculated in a slightly different way from the CPI and PPI. The use of this index is discussed later in this chapter.
GDP Price Index
The price index used when calculating price changes for the entire economy.
Importance of Indexes Academics, businesspeople, and government officials do not study price indexes out of idle curiosity. Rather, they have an important impact on policymakers' decisions and on the operation of the economy. They directly affect wages of workers who receive cost-of-living adjustments based on the CPI. Employers and employees often look to these indexes in determining fair salary increases. Some government programs, such as Social Security, base changes in monthly checks on a variation of one of these indexes. Private business contracts may provide for price adjustments based on the Producer Price Index and, in some instances, other payments such as child support and rent have been tied to one of these indexes.
Deflation and Disinflation
We must note two important terms before leaving the discussion of inflation: deflation and disinflation. Deflation occurs when there is a sustained decrease in the general level of prices. This does not mean that a few items decrease in price or that there is a decrease for a short period of time. In the United States, deflation has not occurred since the 1930s.
Deflation
A sustained decrease in the general level of prices.
Although a sustained decrease in the general level of prices might sound attractive, deflation, like inflation, can create problems for households and businesses. For example, homeowners who want to move could be forced to sell their houses for less than they paid for them, and businesses could suffer losses if their products' prices dropped to a level that did not cover previously incurred production costs. Also, people might be less enthusiastic about deflation when one of the prices that drops is the price they get for their labor.
We refer to a reduction of the inflation rate as disinflation. Disinflation does not mean that prices are falling; rather it refers to a slowing of the inflation rate, or increases in prices. For example, the movement of the CPI in Figure 4.2 from 1990 to 1994 and any other sequence of years when the line is falling illustrates disinflation. When Congress and the Federal Reserve try to slow inflation through their actions, they are pursuing disinflation. Tools available for pursuing disinflation are discussed in Chapters 6 and 8.
Disinflation
A slowing of the inflation rate.
PRODUCTION
Production is the creation of goods and services. Productive activities range from the construction of a piano to the repair of a dented car door. Shipping goods from wholesalers to discount houses constitutes production, as do the grocery store services of renting carpet cleaners and making floral arrangements. Because production is linked to an economy's standard of living and employment, it is important to measure an economy's overall output and its capacity to produce. Any discussion of setting and reaching macro goals and working through macro problems is based on having data about an economy's production.
Production
The creation of goods and services.
Full Production and Economic Growth
An economy achieves the macroeconomic goal of full production when it produces as much as possible with its available resources, or operates at its maximum capacity. Although the problem of scarcity always exists, full production permits an economy to minimize its impact. Production and employment are interrelated: When an economy reaches full employment, it also reaches full production. When resources are unemployed, full productive capacity is not met.
Full Production
Occurs when an economy is producing at its maximum capacity, or when it is experiencing full employment.
In addition to full production, this macroeconomic goal calls for economic growth, which means that the economy's full production–full employment level of output grows over time. In other words, to achieve this goal, the economy must operate at maximum capacity and that capacity must grow over time.
Economic Growth
An increase in an economy's full production output level over time.
The production possibilities curves for capital and consumer goods in Figure 4.3 illustrate the concept of economic growth. This economy would reach full production in the first year by producing at any point, such as A, on the production possibilities curve for year 1. Economic growth occurs when the production possibilities curve shifts to the right, as is done for the second and third years. This economy would achieve the third macroeconomic goal of full production and economic growth if it were to produce at a point such as B along the curve for year 2 and C for year 3.
Although economic growth is generally defined as an increase in full production output over time, we get a better measure of growth by evaluating full production output per capita over time. The growth of real output per capita in the United States from 1980 through 2011 is illustrated in Figure 4.4. (Real output measures output with the effects of inflation removed and is explained in the next few pages.) Although the figure shows actual production rather than full employment production, it indicates that real output per person has grown substantially over the years. In 1980, when the U.S. population was approximately 228 million, the economy produced $25,618 of real output per person. By 2011, when the population was approximately 312 million, real output per person had grown to $42,666. 15
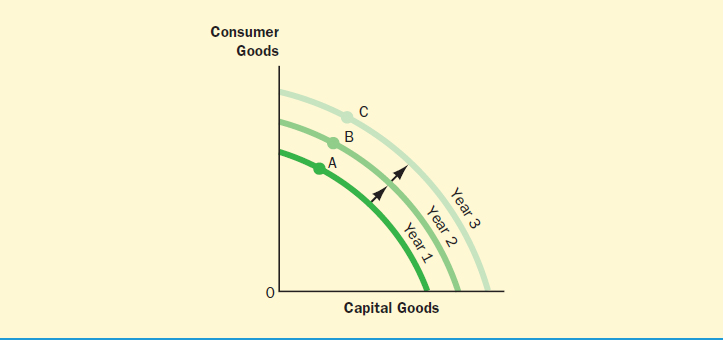
To experience economic growth, an economy's potential output level must increase over time, and it must produce up to that potential.
Achieving Economic Growth Simply, an economy's production levels are based on the number of resources available to it and how those resources are used. Thus, economic growth can occur only if more resources are available or resources are used more efficiently. For example, a labor force can be expanded through immigration; new sources of oil and natural gas can be located through drilling; people can become more entrepreneurial; or increases in capital such as machines and buildings can occur. Government can play an important role in encouraging economic growth through policies that impact the availability and use of resources. Changes in the tax code, interest rates, or immigration policy, for example, can foster a change in resources.
Technological change is probably the most important force leading to economic growth. Technology is the state of knowledge about production and its processes. In today's world, technology is influencing production in a rapid and dramatic way. Information is immediately available and we can communicate quickly. As a result, everything from the production of this textbook to new medical procedures that have come from breakthroughs in biochemistry or biomedical engineering has been touched by technology.
Technology
Increase in knowledge about production and its processes.
FIGURE 4.4 U.S. Economic Growth: Real Output per Capitaa

Real output per person in the United States has grown substantially since 1980.
a Real output is in chained 2005 dollars; 2011 figure is preliminary.
Source: Economic Report of the President (Washington, DC: U.S. Government Printing Office, 2012), Table B-31.
Sometimes we associate technological change with investments in equipment such as computers. However, investments in people through formal education, training, wellness, and other ways, or human capital investments, increase productivity in an important way. When people are better educated and trained, the quality of a workforce is strengthened, individuals are more productive, and the overall level of knowledge in the economy is increased. This knowledge base, in turn, ensures that technological change will continue. An economy of healthy, educated people almost ensures economic growth.
Human Capital Investments
Investments, such as formal education, that increase the productivity of people.
Costs of Economic Growth Not everyone agrees that a high rate of economic growth is a desirable goal. Today, more than ever, people argue that significant future costs are attached to a push for continually increasing production. The growth of the U.S. economy that has brought its annual output to over $15 trillion has resulted in the creation of billions of tons of garbage, including toxic, nonbiodegradable, and nuclear waste. Now and in the years to come, this waste is becoming costly as landfills close, toxic chemicals seep into the soil, and health problems multiply. We are also aware that the rapid economic growth in countries like China has brought severe air pollution and that global warming is another consequence of rapid growth.
Some people argue that it may be better to produce a smaller output, perhaps with no growth, and deal with the waste and other problems that create future costs. Other people oppose high rates of economic growth because of the dissatisfaction that must be generated about people's possessions to encourage them to continually want new and “better” items. In addition, there is also concern about the depletion of resources that are not easily regenerated and will become a problem of the future.
UP FOR DEBATE
 WILL POLICIES TO PROTECT THE ENVIRONMENT SLOW ECONOMIC GROWTH?
We are keenly aware of the impact of our current style of living and production on the world's natural resources: global warming, deterioration in air and water quality, and rapid depletion of the limited supply of oil and other energy sources. There is recognition that policies must be put in place to protect the earth for future generations, and global support for doing so. On the other hand, opposition to these protective policies is coming from those who believe that such policies will slow down the world's economies and cause economic stagnation. Will policies to protect the environment actually slow economic growth?
YES It's obvious that in order to “clean” the environment, production all over the world must be lessened. Just consider the 2008 summer Olympics in Beijing, China, when in order to clear the air for the athletes, China shut down a large number of its production facilities. Closing many of the world's factories and other polluting facilities will send hundreds of thousands of workers into unemployment. Economies will stagnate.
Cleaner air requires that people drive less. This will have a huge impact on individual lifestyles as they find ways to lessen their discretionary driving. People will likely patronize restaurants and entertainment venues less and not drive to shopping malls and stores with as much frequency. This has the potential to cause many small businesses and retail outlets to fail.
There are many other negative economic consequences of environmental regulations. As people are forced to lessen the use of resources, there will be an associated loss of jobs from mail carriers to truck drivers to workers in SUV plants. Government entities that provide police and fire protection and code enforcement may have to lessen their service levels to meet environmental regulations.
NO Policies to protect the environment will encourage economic growth. While there could be some disruption without time to adjust to regulations, a well-planned transition will result in many new types of industries, businesses, and jobs. People are smart and will conquer the challenge of producing and living in a world that protects the environment.
We know the advantages of new technology, accessible information, and better communication. These will move us toward a different kind of production and lifestyle. Take building as an example. Today, many businesses and educational institutions are seeking LEED certificationa of their new construction. This certification promotes efficiencies in the use of resources—from green roofs to solar energy to water runoff. LEED does not bring a decrease in economic growth, rather it is inspiring changes in the way architects and builders do business.
The future is promising for economic growth as life, careers, and production change—not stop. Single-stream recycling, hybrid cars, rainwater reuse, and so much more are already contributing to growth, with so much more to come.
a The LEED (Leadership in Energy and Environmental Design) Green Building Rating System is a certification program with nationally accepted benchmarks for the design, construction, and operation of high-performance green buildings. http://www.usgbc.org.
“Up For Debate: Will Policies to Protect the Environment Slow Economic Growth?” addresses the debate over the relationship between environmental regulatory policies and economic growth.
Measures of Production
The United States, as well as most other countries, calculates on a regular basis how much its economy has produced. Gross domestic product, or GDP, is the dollar figure that measures the value of all the finished goods and services produced in an economy in 1 year. GDP counts only finished goods and services, which are those ready for sale to their final users: Products in a stage of production, or not yet completed, are not included. If we included an item in the process of production, say the flour for pasta, and then included it again when the product was completed, say linguini noodles, production would be overstated.
Gross Domestic Product (GDP)
A dollar figure that measures the value of all finished goods and services produced in an economy in 1 year.
It is also important to understand that GDP measures goods and services produced, not sold. We do not count goods involved in secondhand sales, such as a student's purchase of a 2008 car, because these goods were counted in GDP when they were originally produced. We also do not count purchases of “paper,” such as stocks and bonds, because they do not represent production, but rather a transfer of assets.
GDP figures are usually given in two forms: money GDP and real GDP. Money GDP, sometimes called current GDP or nominal GDP, measures the value of production in terms of prices at the time of production. Money GDP is affected by both changes in production and changes in prices. Real, or constant, GDP is money GDP adjusted to eliminate inflation. It measures actual (real) production and shows how actual production, without price increases, has changed. People who “watch the economy” prefer real GDP rather than money GDP figures for gauging the state of the economy.
Money GDP (Current, or Nominal, GDP)
Measures the value of production in terms of prices at the time of production.
Real GDP (Constant GDP)
Money GDP adjusted to eliminate inflation; measures real production.
Calculating Real GDP Table 4.7 will help you to understand why real GDP is a better measure of production than money GDP. This table presents a hypothetical economy that produces only automobiles. Notice in the column Output of Autos that this economy was stagnant from year 1 to year 2, producing 60 cars in each year, had real growth in year 3 when production increased to 65 cars, and experienced a decline in production during year 4 with a drop to 55 cars. During this period, the economy also experienced inflation: The price of autos increased year after year, as shown in the column Price per Auto.
We calculate money GDP, or the current dollar value of production, by multiplying output times price for each year. In year 1, when the 60 cars produced were $16,000 each, money GDP was $960,000, and in year 2 when the 60 cars produced were $18,000 each, money GDP was $1,080,000. This is given in the fourth column.
Notice that the price increases caused money GDP to climb for each of the 4 years. If we relied solely on the money GDP numbers, we could mistakenly believe that production increased from year to year when it did not. Inflation has distorted these production data.
If we want to assess real levels of production, we need to calculate real GDP. To do so, we need a measure of the price changes over the years. In Table 4.7, the prices of the autos over the 4 years are translated to a price index, given in the Auto Price Index column, using year 1 as the base year. This price index provides the mechanism for converting money GDP to real GDP.
TABLE 4.7 Determining Money GDP and Real GDP
Money GDP can give a misleading impression of the output of an economy when the level of prices is changing over time.

TABLE 4.8 Money GDP, Real GDP, and the GDP Price Index, Selected Years
Real GDP is a much more accurate measure of the economy's performance over time than is money GDP.

Source: Economic Report of the President (Washington, DC: U.S. Government Printing Office, 2012), Tables B-1, B-2, B-3.
The equation for determining real GDP is
![]()
The real GDP, for example, for year 2 in Table 4.7 is calculated by dividing the money GDP of $1,080,000 by the index number of 112.5, and multiplying that answer by 100.
It is important to notice in Table 4.7 that real GDP did not change from year 1 to year 2, and that it increased in year 3 and decreased in year 4. Real GDP, not money GDP, reflects the actual annual output for this economy.
Assessing U.S. Production In Table 4.8 we find money GDP and real GDP for the U.S. economy in selected years. Notice the sheer magnitude of the numbers: Money GDP was over $15 trillion in 2011, putting the average daily output of the U.S. economy over $41 billion.
Table 4.8 includes the GDP price index for the entire economy, which was mentioned earlier in this chapter. The government calculates this index as a measure of overall inflation and uses it to convert money GDP to real GDP. Just as we did in the auto example, we find real GDP for a given year by dividing that year's money GDP by that year's GDP price index number, and then multiplying by 100.16
In the base year of the price index, money GDP equals real GDP since the price index value is 100.0. In 2005, the base year in Table 4.8, money GDP and real GDP are equal at $12.62 trillion. In years when a dollar buys more than in the base year, the GDP price index number is less than 100.0, and real GDP is greater than money GDP. Observe that in 1995 the real GDP of $9.09 trillion is greater than the money GDP of $7.41 trillion. In years when a dollar buys less than in the base year, the GDP price index number is greater than 100.0, and real GDP is less than money GDP. In 2009, real GDP is less than money GDP.
In Table 4.8, we find the reason for using real GDP rather than money GDP to evaluate the economy. Look at the GDP data for 2007 through 2010. During that time money GDP constantly grew except for 2009. The real GDP figures, however, show the extended slowdown in the economy that occurred over these years. It was not until 2011 that GDP grew again to its pre-slowdown years. Money GDP can give a false impression of the economy and mislead people who are unaware of how price changes, or inflation, can distort output measures.
The government calculates and publicly announces GDP figures on both a quarterly and an annual basis. Quarterly figures are used to gauge the health of the economy and are usually reported by the media. Concern is generated when little or no growth occurs in GDP from quarter to quarter.
Test Your Understanding, “Calculating Price Indexes and GDP,” provides an opportunity to practice calculating and evaluating price indexes and GDP figures.
Does GDP Tell the Whole Story?
Although we rely on GDP data to evaluate production levels in the U.S. economy, we need to realize that those data do not give us a complete picture of production. GDP figures actually understate our output levels because many goods and services that are produced are never included in the calculation. In other words, the U.S. economy is more productive than is reported. Activities that are not included are
- nonmarket productive activities,
- unreported work, and
- swapped services.
Some goods and services are not included in GDP because they are not bought and sold in a market. Many people maintain their own cars, paint their own homes, cook meals, volunteer in hospitals and camps, or spend hours a day “working” without being paid. These activities result in the actual production of goods and services and improve the economy's well-being but are not included in GDP because no pay is involved. If someone were paid to do this work, the dollar value of the output would be included in the accounts. For example, if you teach yourself to use Excel, it is not included in GDP, but if you pay for a course and an instructor teaches you Excel, the value of this service is included in GDP.
TEST YOUR UNDERSTANDING
 CALCULATING PRICE INDEXES AND GDP
The following problems provide an opportunity to calculate price indexes, money GDP, and real GDP.
- Calculate two price indexes for the market basket in the following table. Use year 2 as the base year for the index in column 3, and year 4 as the base year for the index in column 4.

- Assume that a hypothetical economy produces only motor scooters, as given in the following table.

Determine this economy's money GDP, GDP Price Index, and real GDP assuming that year 1 is the base year. Record these in the appropriate columns of the following table.

- Below are money GDP and GDP Price Index numbers over several years for a hypothetical economy. Calculate real GDP for each of the years given in the table below and record your answers in the appropriate column. Answer the questions following this table.

- On the basis of real GDP, how has this economy performed from year to year?
- Generally, for the entire period, how does the picture of the economy's performance using real GDP compare with the picture using money GDP?
Answers can be found at the back of the book.
When people work for cash and do not report this income to the federal government, the work is not included in GDP. Young people often cut grass or sit with children, accept their wages in cash, and either do not fill out a Form 1040 or do not report it on the form. Sometimes, major work is not reported, such as full-time housecleaning, tip income, or moonlighting by plumbers or electricians. On occasion, people will swap services: A dentist maintains the teeth of a lawyer in return for legal advice. Also, people who are engaged in illegal activities likely don't report that income, causing illegal production not to be included in GDP.
APPLICATION 4.3
A TALE OF TWO FAMILIES
Here is the tale of two productive families. While each family has the same goal of providing a healthy and happy home life for its children and is successful at that goal, each family's contribution to the U.S. economy, or to the GDP, is starkly different.
Joe and Lydia
Joe and Lydia and their three children are part of a small like-minded, rural community. They live simply in a three-bedroom house heated by a wood-burning stove and depend on a well for their water needs. Joe and Lydia raise much of the food the family consumes; their garden and orchard are abundant with fruits, berries, and vegetables and Lydia cans and bakes. The goats provide milk for drinking as well as cheese making. Between feeding the animals and creating compost, they produce very little trash.
All of their clothing is sewn by Lydia, who visits some second-hand shops for items with good fabric that can be refashioned. Sometimes she trades her pies and donuts for fabric that someone in the community has purchased. Lydia wants her children to be well-educated, and they visit the local lending library frequently.
Joe is an excellent carpenter. When work is available, he will join a building crew (sometimes for no pay if it is a community need) or other carpenters that make tables and chairs for custom orders. Since Joe has an old, unreliable pickup truck which he repairs himself, sometimes he hires a driver who will take him and the family to a city farmers market where they sell some of their bountiful produce and birdhouses that he and the children make.
Even though this family lives well and works hard to produce the goods and services that they need, trade, and sell, they contribute little to the GDP calculations. They spend little on food and clothing, utilities, and transportation. Their sales at the farmers market, wages earned as a carpenter, payments to a driver, and small purchases are about all that they contribute to the official calculation of GDP.
Angie and Rob
Angie and Rob and their three children live in a threebedroom house in a suburb of a big city. Like all suburban residents, they depend on the local water, gas, electric, sewer, and trash companies for their everyday utilities.
Angie and Rob shop at the local grocery chain for the family's food and the family sometimes enjoys a meal at a restaurant or grabs something at a fast-food establishment. Angie likes to cook and bake and depends on the good-quality flour, vanilla beans, and natural cocoa that she can buy in a local specialty shop. Sometimes Angie visits the local farmers market where she buys fresh berries, vegetables, and cheese.
Rob is an accountant and works as a loan officer for a bank. Sometimes during tax season he will work weekend hours on his own by doing taxes for a few paying clients. Angie teaches math to junior high students.
Angie and Rob own an old sedan and bought a new SUV this year. Their kids are active in a few local sports leagues and spend time in the community's ice arena. Angie likes to ensure that she has at least a few clothing pieces that are in fashion and there are plenty of new books in the house.
This family lives well and contributes much to the GDP calculations. Angie and Rob have jobs that produce services that are added to the country's GDP, and they spend money on things that add to the officially calculated production levels of the economy: utilities, food, clothes, a new car, and more.
We use the term underground economy to refer to productive activities that are not reported for tax purposes and are, therefore, not included in GDP. While economists care that these goods and services are not included in GDP, most of the concern about the underground economy centers on the lost tax revenue and the social harm resulting from some of these activities.
Underground Economy
Productive activities that are not reported for tax purposes and are not included in GDP.
We must also note that GDP fails to measure the impact of production and consumption on the environment. It also does not account for future costs that may be incurred from current production. And sometimes GDP is not a sure indicator of the quality of people's lives. Application 4.3, “A Tale of Two Families,” shows that we can be led astray by relying solely on high GDP figures as a testament to a good life.
Productivity
In addition to measuring real GDP, we also periodically evaluate the productivity of our resources. The amount of goods and services that an economy produces is influenced by the way in which its resources are used. Efficient labor usage, technology in production processes, and updated equipment contribute to productivity.
The concept of assessing the amount of output produced by an economy's resources is called productivity. Basically, productivity measures output per worker. This measure takes labor plus other factors of production into consideration. Productivity does not measure how hard a person works, but rather the output that results when labor is combined with other inputs. For example, the product per hour of someone who is building a wall for a landscape contractor depends not just on the person but also on the equipment that is used. The number of hybrids that roll off an assembly line at an auto plant each day depends on workers, machinery, management style, energy, and other resources. Productivity increases when the equipment used on the job is technologically advanced and efficient.
Productivity
Concept of assessing the amount of output produced by an economy's resources; often measured specifically by output per worker.
Not surprisingly, productivity in the U.S. economy has increased dramatically over the past few decades. Increased productivity provides benefits for the economy because fundamentally it lessens the scarcity problem when resources are used more efficiently. In short, we get more goods and services from available resources. More immediate to the goals of macroeconomic policy, improved productivity can ease inflationary pressure by allowing firms to meet rising costs through increased output rather than through higher prices. Increased productivity can change employment opportunities: It may stimulate new, higher-skilled jobs, but it may also result in some structural unemployment.
A POSSIBLE POLICY PROBLEM
The federal government is officially committed to help create an environment conducive to reaching full employment, full production, and price stability. While each of these goals is desirable, it may be difficult to simultaneously reach them all.
We know that when the U.S. economy reaches full production and full employment, pressures from increased spending power on the buyers' side of the market can combine with the inability of the economy to expand its output to cause demand-pull inflation. We also know that removing the upward pressure on prices by curbing buyers' demands could lead to unemployment and less than full production.
This dilemma sometimes faces policymakers and may force them to choose to seek full employment and full production accompanied by inflation, or stable prices accompanied by unemployment and less than full production. In the next few chapters, you will learn about policies that can change economic conditions and who is responsible for pursing these policies. You will learn about Congress and fiscal policy, and the Federal Reserve and monetary policy. While there are disputes about what goals to seek, how to reach them, and who benefits, we are fortunate to have some options available.
Summary
- The three fundamental goals of the U.S. economy are full employment, stable prices, and full production and economic growth. The three fundamental problems are unemployment, inflation, and falling production. To help create an environment in which these goals can be reached, Congress enacted the Employment Act of 1946.
- Unemployment intensifies the scarcity problem for society and creates personal hardships for individuals who are out of work. Unemployment can be frictional, cyclical, or structural. Frictional unemployment is voluntary, short term, and primarily due to the time required to locate work. Cyclical unemployment is involuntary and caused by downswings in the general level of economic activity. Structural unemployment is involuntary and occurs when a particular job is no longer in demand in the economy.
- The labor force includes all persons 16 years of age and older who are employed or actively seeking work. A participation rate measures the percentage of a group that is in the labor force. The overall unemployment rate is the percentage of the labor force that is unemployed and actively seeking work. Unemployment rates and participation rates can be calculated for subgroups within the labor force and differ from group to group.
- The government calculates unemployment rates from a monthly sample survey. People who work even 1 hour per week while looking for full-time employment are considered to be employed. When people quit looking for work because they have been unsuccessful in their search, they become discouraged workers. Discouraged workers and part-time workers seeking fulltime work may cause the unemployment rate to understate the extent to which labor resources are underutilized.
- Full employment occurs when everyone in the labor force except the frictionally unemployed is working. The unemployment rate associated with full employment is not universally agreed upon and has changed over time. The natural rate of unemployment is the rate that includes the frictionally and structurally unemployed.
- Inflation refers to an increase in the general level of prices. It reduces the purchasing power of money, hurts some groups in society more than others, and may lead to social and political instability.
- When inflation is caused by upward pressure on prices from the buyers' side of the market, it is termed demand-pull inflation. When it comes from the sellers' side of the market, it is termed cost-push inflation. Expectations of future economic conditions can influence demand-pull and cost-push inflation.
- Three widely used indicators of inflation are the Consumer Price Index, Producer Price Index, and GDP Price Index. Price indexes express the prices for a collection of goods and services in different years as a percentage of the prices for those same goods and services in a base year. A price index number of 120.0 means that prices in a certain year are 20 percent higher than prices for the same items in the base year.
- Deflation occurs when there is a sustained decrease in the general level of prices. Disinflation occurs when there is a slowing of the inflation rate.
- An economy's levels of production and employment are related. Full production is reached when an economy operates at maximum capacity, or at full employment. Economic growth is an increase in the full employment level of output over time and is represented by a shift of the production possibilities curve to the right. Economic growth is based on the number and use of resources available to an economy. Technological change and human capital investments are important in achieving growth.
- Gross domestic product (GDP) is a dollar figure that measures the value of all finished goods and services produced in an economy in 1 year. Money GDP is the value of output in prices at the time production occurs and is affected by changes in both output and price levels. Real GDP is money GDP adjusted to eliminate inflation, and it changes only as the level of output changes. Real GDP is a better measure of production than money GDP. GDP understates actual output because some production is never included in the calculation.
- It is important to measure the productivity of an economy's resources. Productivity is measured by output per worker, which combines the results of production from labor and other inputs.
- It may not be possible to reach full employment, full production, and price stability at the same time. As the economy approaches full employment, increased spending causes demand-pull inflationary pressure. The reduction of spending to dampen demand-pull inflationary pressure can cause employment and production to fall.
Key Terms and Concepts
Macroeconomics
Employment Act of 1946
Unemployment
Frictional unemployment
Full employment
Cyclical unemployment
Structural unemployment
Labor force
Participation rate
Unemployment rate
Discouraged workers
Underemployment
Natural rate of unemployment
Inflation
Hyperinflation
Money (nominal) income
Real income
Cost-of-living adjustment (COLA)
Interest rate
Real rate of interest
Wealth
Demand-pull inflation
Cost-push inflation
Price index
Base year
Consumer Price Index (CPI)
Producer Price Index (PPI)
GDP Price Index
Deflation
Disinflation
Production
Full production
Technology
Human capital investments
Gross domestic product (GDP)
Money (current, or nominal) GDP
Real (constant) GDP
Underground economy
Productivity
Review Questions
- Define the three major goals and the three major problems of the macroeconomy. What is the significance of the Employment Act of 1946 with regard to these goals and problems?
- Identify which of the following individuals would be classified as unemployed and, if they are, the type of unemployment that each is experiencing.
- A student who decides at mid-semester to devote the rest of the term to studying and quits her part-time job
- A graphic artist who is out of work because a computer now does her job
- A waiter who quits his job and is applying for the same type of work in a restaurant where the working conditions are better
- The son of a local farmer who works 20-hour weeks without pay on the farm while waiting for a job at a nearby factory
- A travel agent who is laid off because the economy is in a slump and vacation travel is at a minimum
- A plumber who works five hours per week for his church (on a paid basis) until he can get a full-time job
- Define labor force, unemployment rate, participation rate, full employment, and the natural rate of unemployment. Explain what each measure tells us about the economy.
- What is the difference between demand-pull inflation and cost-push inflation? Must the economy experience only one type of inflation at a time, or can these types occur simultaneously? How might inflation tend to spiral?
- Calculate price index numbers for the following table assuming that year 3 is the base year, and put your results in the last column.
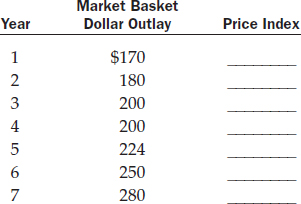
- What is the difference between deflation and disinflation? Although the United States has not experienced deflation since the 1930s, what problems could result if deflation occurred over the next 5 years?
- In each of the following examples, identify whether the person or institution will be penalized by inflation and, if so, why.
- Mosie borrows $5,000 for her college expenses at an interest rate of 4 percent to be paid off over 5 years, during which time the inflation rate averages 6 percent.
- Oscar invests $3,000 in securities that pay 5.3 percent annually for 10 years, and the inflation rate during that time averages 6.4 percent.
- The Lilyton National Bank commits to $10 million in 15-year mortgages at an average mortgage rate of 4.5 percent. The inflation rate averages 6 percent over this 15-year period.
- Barney bought a house in 2001 for $100,000 that he is now selling for $200,000. During this time the inflation rate has averaged 3 percent.
- How is economic growth illustrated using a production possibilities curve, and what are the primary factors responsible for economic growth?
- Complete the following table for a hypothetical economy assuming that year 1 is the base year for the price index. How does the completed table illustrate that real GDP is a better measure of the performance of an economy over time than is money GDP?
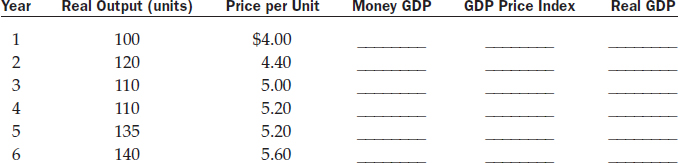
Discussion Questions
- Suppose that you are a candidate for the U.S. Congress. National Public Radio, which attracts an educated and sophisticated audience, interviews you about the economy. How will you answer each of the following questions?
- Since it is fairly apparent that the economy cannot sustain full employment and stable prices at the same time, which of these two goals would you choose?
- Do you favor using the full employment rate of unemployment or the natural rate of unemployment as a macro goal?
- How would you reduce cyclical and structural unemployment? How far would you be willing to intervene in the operations of businesses to control unemployment?
- Can you identify someone you know who is working part-time but would like to be working full-time, or is working in a job that is not fully using the person's skills? In your opinion, is listing this person as employed a serious flaw in the way unemployment statistics are gathered and reported? What changes, if any, would you make in the way we calculate unemployment?
- Each of the following allows you to integrate this chapter into your everyday life. Choose one from this list to complete.
- Interview someone who has been out of work for over a month. Is this person classified as unemployed, and, if so, what type of unemployment is this person experiencing? What are the costs of unemployment to this person?
- How has inflation affected the tuition you pay at the college or university you are currently attending? What was the tuition in 2000, 2005, 2010, and the current year? How have changes in your school's tuition compared to changes in the overall Consumer Price Index?
- Compile a list of all the goods and services that you have produced in the last month that would not be counted as part of GDP. Why would they not be counted? Can you estimate the value of this production?
- What are some economic, social, and political reasons that make economic growth important to a nation? How could a population increase contribute to economic growth, and how could it hinder growth?
- An argument can be made that the aggressive pursuit of economic growth may impose costs on people today and in future generations. Is growth important enough that these costs should be ignored, or should they be balanced against the gains from economic growth when making decisions about the path the economy should follow in the future?
- In recent years, the annual rate of growth in productivity in the United States has increased. What do you think is most responsible for this increase?
- Create three separate lists showing the groups that you think are hurt most by unemployment, inflation, and declining production.
- As the Up for Debate on page 126 indicates, many people oppose regulations that address environmental concerns because they believe that they harm businesses and the economy. Others join this position because they think that studies showing deteriorating air and water quality are fabricated or that there is too much government intervention. On the other hand, there is evidence that new business opportunities and products, such as the growth in wind farm and solar energies, are emerging and new careers will result. Where do you fall in this discussion?
Critical Thinking Case 4 
STATISTICS AND DECISION MAKING
Understanding the statistical concepts of population and sampling
Determining whether data support a generalization
Evaluating the reliability of a statistic used to make a judgment
Economic Concepts
Relationship between statistical measures and economic decision making
Factors underlying the calculation of the unemployment rate
“The average age of smokers has fallen by 3 percent.” “Prices are expected to increase by 9.9 percent this year.” “The unemployment rate has dropped to 5.8 percent.” “Corporate profits rose by 8 percent.”a We are constantly bombarded with statistics about economic and noneconomic phenomena. Statistics are often used because they add precision to statements that might otherwise be vague and authority to the positions people take. People like to hear and use statistics.
Statistics often provide the incentive for making a decision. For example, many people have chosen to quit smoking because of statistics on the health and longevity of smokers and nonsmokers. And the prediction of a high unemployment rate—say, 10 percent—could induce some households to save more, cause some businesses to spend less on investments, and lead to the enactment of certain government stabilization policies.
Too often, though, numbers are accepted without question. We do not stop to consider where a statistic comes from, how it is calculated, or how accurately it represents the statement it supports. Consider an announcement that the unemployment rate in a large metropolitan area has increased from 5.4 percent to 6.2 percent in the last 3 months. Does this statistic accurately reflect this area's unemployment? What data were collected, how were they collected, and how were they analyzed in order to arrive at this statistic?
The concepts of population and sampling are important in understanding what lies behind a statistic. Population identifies the group from which the statistic is drawn. On learning the unemployment rate for this particular metropolitan area, many questions about the population that statistic represents could be asked. For example, does it have the same characteristics as the population used to determine the national unemployment rate? Does it include the city and all its suburbs, or does it extend to adjacent rural counties?
The sample for the statistic is the group selected from the population for actual measurement. Both the size of the sample and the method of selecting the sample are important because a statistic based on a poorly drawn sample could misrepresent the larger population. If your college makes the statement that graduates earn on average $70,000 the first year after receiving their degrees, you might be curious about how many graduates were sampled and how they were selected. This statistic could be based on a response to a questionnaire by only five graduates, all of whom are proud of their high salaries and who worked for several years before graduating.
Unfortunately, we usually do not have ready access to information on the population and sample from which a statistic is drawn. However, a simple awareness of these concepts reminds us that a statistic is only as good as its population and sample, and that decisions based on faulty statistics can lead to poor results.
a The numbers are hypothetical.
- The population and sample for deriving the overall unemployment rate in the United States are given in this chapter. What are the population and sample for this statistic?
- If you could change the current procedures for calculating some key economic statistics, how would you redefine the term unemployed and who would you include in the population and sample for measuring the unemployment rate? What would you include when determining the Consumer Price Index?
- In the next few days, locate the population and sample for three publicly issued statistics. These could be on the sports page in your local paper, in a news report on a website, or in this textbook.
- Assume it was reported today that “the interest rate on car loans is expected to jump by 5 percentage points in the next year.” What types of economic decisions might be made as a result of this statement? What serious consequences could occur if this statistic were inaccurate?
1United States Statutes at Large, 1946, vol. 60, part 1, Public Laws and Reorganization Plans (Washington, DC: U.S. Government Printing Office, 1947), p. 23.
2U.S. Bureau of the Census, Historical Statistics of the United States, Colonial Times to 1957 (Washington, DC: U.S. Government Printing Office, 1960), Series D 46–47, p. 73.
3 See Tables 4.1 and 4.8 for data sources.
4A fourth type of unemployment, called seasonal unemployment, is not discussed here. The seasonally unemployed are those who lose their jobs at the same time each year because of weather changes or tradition. Farmworkers unemployed in the winter when land is out of production and teachers unemployed in the summer because of traditional school-year schedules are examples of the seasonally unemployed. Because it occurs predictably each year and can be planned for well in advance, seasonal unemployment need not be a problem.
5Economic Report of the President (Washington, DC: U.S. Government Printing Office, 2012), Table B-35.
6 All figures in this table are for the noninstitutional civilian population, which is all people 16 years of age and older who are living in the United States and are not confined to penal, mental, senior-nursing, or other institutions, and are not on active duty with the armed forces.
7 For additional information see Bureau of Labor Statistics,” How the Government Measures Unemployment,” http://www.gls.gov/cps/cps_htgm.htm.
8 Data from “Labor Force Statistics from the Current Population Survey,” http://data.bls.gov/pdq/SurveyOutputServlet.
9 Shephard B. Clough, Thomas Moodie, and Carol Moodie, eds., Economic History of Europe: Twentieth Century (New York: Harper & Row, 1968), pp. 111, 124; Thayer Watkins, “The Worst Episode of Hyperinflation in History: Yugoslavia 1993–94,” http://www.rogershermansociety.org/yugoslavia.
10A fixed rate means that the interest rate does not change during the loan repayment period. A long-term loan means that the borrower has a considerable period of time for repayment, perhaps as much as 30 years.
11 John Maynard Keynes, The Economic Consequences of the Peace (New York: Harcourt, Brace and Howe, 1920), p. 236.
12 U.S. Bureau of the Census, Statistical Abstract of the United States: 1990, 110th ed. (Washington, DC: U.S. Government Printing Office, 1990), p. 692; “All Countries Spot Price FOB Weighted by Estimated Export Volume (Dollars per Barrel),” http://tonto.eia.doe.gov, August 15, 2008.
13 These numbers are not shown in Table 4.6. This average is calculated by adding the numbers for the three years together, dividing by 3, and then using the average of the three years for the base dollar outlay. This further means that the index numbers for these three years average 100.0. In the 2012 Economic Report of the President, the source of Table 4.6, the index numbers are 96.5 for 1982, 99.6 for 1983, and 103.9 for 1984. Adding these three numbers together and then dividing by 3 gives us 100.0.
14 To determine an annual percentage change in prices between two consecutive years, 1 and 2, in a price index, use the following equation:
![]()
For example, using the numbers in the All Items column in Table 4.6, the price change from 2003 (year 1) to 2004 (year 2) would be:
![]()
15 Economic Report of the President (Washington, DC: U.S. Government Printing Office, 2012), Table B-31.
16 If you try to check your understanding of the conversion of money GDP to real GDP by applying the conversion formula to the numbers in Table 4.8, some of your real GDP figures may be slightly different than those given there—partly because the numbers in the table have been rounded, and partly because of some properties of the index.