
CHAPTER OBJECTIVES
To identify the major expenditures and revenues of federal, state, and local governments.
To distinguish among progressive, proportional, and regressive taxes, and discuss recent tax issues and reforms.
To introduce fiscal policy, explain its mechanics, and differentiate between discretionary and automatic fiscal policy.
To define a surplus, balanced, and deficit budget, and identify the economic impact of each.
To explain the relationship between the federal budget and fiscal policy.
To define the national debt, explain its financing, size, and burden on taxpayers, and introduce crowding out.

Let's begin this chapter with a quick civics lesson. As the world becomes more global and we are far more influenced by the activities of other nations and cultures, differences in the types of governments under which people live become more relevant. Global concerns have also fostered an increased awareness of, and interest in, the democratic form in the United States. Here people elect other people to represent them and make decisions on their behalf; decisions are not made by dictators, military or religious leaders, or kings.
The philosophy underlying a representative form of government has fostered multiple political subdivisions in the United States: Authority and functions are dispersed through many government units. There is a federal jurisdiction along with state and local jurisdictions. As a result, we elect and give decision-making authority to a president, congresspersons, a state governor and state legislators, and local mayors, council members, county and township representatives, school board members, and others. Try to fill in Table 6.1 by identifying the elected officials who represent you.
While governments wrestle with everything from national security at airports to summer recreational camps for kids, our focus is on the role of the government sector in the macroeconomy. We know from Chapter 5 that total spending influences the direction of the economy and that government impacts this spending through its purchases of goods and services, transfer payments, and the taxes it collects. This is a sizable role: The sheer magnitude of expenditures and taxes makes government extremely important in the functioning of the economy.
Not surprisingly, the largest single purchaser of goods and services in the United States is the federal government. A decision made at the federal level to initiate or cancel an interstate highway project or defense system, or to increase or decrease taxes, can have a far-reaching impact on the economy. Similar, but smaller, effects are felt when state and local governments change their tax and expenditure patterns. Enacting a local sales tax to fund park trails, building a new high school gym, and buying a few street sweepers have an impact on the economy.
TABLE 6.1 Government Representatives
Use the following table to identify the persons who represent you.
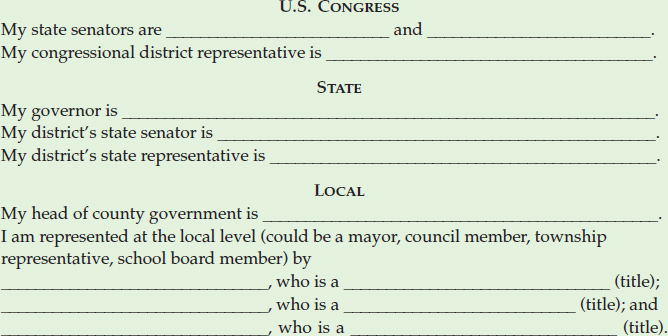
TABLE 6.2 Total, Federal, and State and Local Government Expenditures, and Total Government Expenditures as a Percentage of GDP, Selected Years 1985–2010 (Billions of Dollars)
Over the years, government expenditures have increased in absolute terms and remained relatively stable as a percentage of GDP.

Source: Economic Report of the President (Washington, DC: U. S. Government Printing Office, 2012), Tables B-1, B-83, B-84, B-85.
Since government spending and taxing can affect the economy's levels of output, employment, income, and, sometimes, prices, government can modify the direction of the economy through its impact on total, or aggregate, spending. An important outcome for you from working through the material in this chapter is the foundation that you will gain for critically evaluating government tax and spending policies. These policies constantly receive widespread attention because we are always debating some related issue: the size of the national debt, appropriate government programs, tax cuts, the Social Security system, school funding, and many others. Government taxing and spending issues always play an important role in political campaigns. After learning the material in this chapter, you should be better able to tell whether the 30-second campaign sound bite of a candidate is accurate or even realistic.
GOVERNMENT EXPENDITURES AND REVENUES
Government Expenditures
In 2010, all government units together spent over $5 trillion for a huge variety of purposes ranging from military aircraft to the construction of sewage plants to police salaries. Table 6.2 lists the total expenditures of all government units combined as well as the federal government and state and local governments for selected years from 1985 through 2010. In addition to the magnitude of government expenditures, notice that federal expenditures exceed state and local spending by a wide margin.
People frequently express concern over increases in government spending and the size of the government sector. Is this concern justified? One way to evaluate the size of government is to measure total government expenditures as a percentage of GDP. This is done in the last column of Table 6.2. A scan down this column shows that, over the years, government spending as a percentage of GDP has been relatively stable.
TABLE 6.3 Federal Government Expenditure Categories, Selected Years 1985–2010
The composition of federal spending has changed over the years. Transfer payments constitute the largest expenditure category, and interest payments have fluctuated.

Source: Economic Report of the President (Washington, DC: U.S. Government Printing Office, 2012), Table B-84.
Categories of Government Expenditures We can classify government expenditures into several categories. Some spending is for government purchases of goods and services, such as the services of people who work for government in many jobs from military careers to public pool lifeguards, and goods ranging from bridges to paper clips. Many government purchases are for public goods, which are those provided for everyone and which exclude no one from their use. Lighthouses, public parks, and flood control dams are all examples of public goods. When government provides a good or service that could also be offered in a private market, such as education or an ambulance haul, it provides a quasi-public good. The provision of public and quasi-public goods is an important function of government.
Government Purchases of Goods and Services
Government spending on new goods and services.
Public Good
A good (or service) provided for all of society; no one is excluded from use of a public good.
Quasi-Public Good
A government-provided good that could also be offered in a private market.
Another category of government spending is transfer payments, which are payments from the government for which nothing is required in return. That is, people who receive monthly Social Security payments, veterans' benefits, unemployment compensation, or public assistance receive transfer payments, unlike people who receive wages for working as government employees.
Transfer Payments
Money from the government for which no direct work is required in return.
Interest paid on borrowed funds is another government expenditure category. Since government units sometimes finance some of their spending through borrowed funds, the interest on that money is an expense that the government unit must pay.1 Finally, the federal government may also provide financial assistance to state and local governments and others for hospitals, additional police, road reconstruction, and such.
Table 6.3 shows how the federal government has allocated money among the various expenditure categories just identified. Notice that the largest federal category is for transfer payments—and that it has been growing. The transfer category of spending presents a number of challenges for assessing how federal money is spent and for any recommendations to reduce federal expenditures. It is popular today to advocate for less government spending which on the surface appears simple, yet the growing percentages associated with transfer payments leads us to a rather complex issue. What transfer income do we cut? As you will read later in this chapter, Social Security is a large part of the equation. It is a separate trust fund yet payments made from this fund are calculated into the overall budget. In addition, during a recession certain transfer payments automatically increase to fill in spending gaps. By the end of this chapter you will be smart about these issues.
State and local governments allocate their spending in a very different way. In recent years, a large majority of state and local spending has gone toward the purchase of goods and services. This is due to the different functions performed by state and local governments. Here is where education is funded as well as police and fire, local streets, many parks, and other services. As a result, it is the salaries of teachers, emergency medical personnel, court employees, and others that are paid by local and state governments.
The spending information in Figure 6.1 provides a different way to look at spending by the federal and state and local governments by giving the function or purpose for using the funds. This figure helps us to understand the type of spending and programs that are in the jurisdiction of these government units. Notice that the federal government's major spending is for defense, veterans, Social Security, and Medicare and that education ranks first among state and local government spending purposes.
Government Revenues
In 2011, governments received over $4.1 trillion in revenue. Every man, woman, and child in the United States contributed, on average, $13,480 to all government units.2 Most of the revenue that governments receive comes from taxes, and we pay many different kinds: federal and state income taxes; local earnings taxes; sales tax; property tax on a residence; personal property tax; capital gains tax; inheritance and gift taxes; utility tax; gasoline, liquor, and cigarette taxes; tariffs on imports; corporate income tax; various business taxes; and others.
Governments also receive revenue from sources other than taxes. For example, the federal government's Social Security program is a social insurance program. Although payment is required from participating individuals, the payment is considered to be a contribution to a retirement and welfare fund rather than a tax. In addition, many local governments count on fees for revenue: building permits, rentals for the local ice rink, and fines for speeding, to name a few.
Social Insurance Program
Contributions from an individual's wages are made to a fund from which that individual may draw when eligible for benefits.
Revenue Sources Table 6.4 gives the major sources of federal government revenue. The largest source of funds, and a fairly stable source, is the individual income tax; other taxes, such as the corporate income tax and excise taxes, typically provide less than 20 percent of federal revenue. The second largest source of revenue, at about one-third, is social insurance, primarily contributions to Social Security. The federal government's reliance on household income as a source of revenue, through the individual income tax and contributions to social insurance, helps to stir agitation about the tax burden imposed on individuals.
State and local government revenues come from a wider variety of sources than do federal revenues: Taxes, primarily property, sales, and individual income taxes, account for about 50 percent of the total. Nontax sources include license fees, tuition from public colleges and universities, some recreation and other fees, and interest, as well as funds—typically grants—received from the federal government.
A wide disparity exists in the types of taxes and tax rates (percentages) imposed by different state and local government units. For example, it was recently estimated that a family in Philadelphia, Pennsylvania, earning $50,000 per year pays 13.7 percent of their income to state and local taxes, whereas a family in Jacksonville, Florida, earning $50,000 pays 4.9 percent. In Indianapolis, Indiana, the effective tax on residential property is $2.75 per $100, and in Honolulu, Hawaii, it is $0.34 per $100.3 Some states have had unusual revenue sources: for example, a tax on income earned by “persons expounding religious doctrines” in Hawaii, a tax on raw fish in Alaska, and a fee for each parachute jump in New Hampshire.
FIGURE 6.1 Federal and State and Local Government Expenditures, by Function

TABLE 6.4 Sources of Federal Government Revenue, Selected Years 1985–2011a
Individual income taxes and social insurance payments are the primary sources of revenue for the federal government.
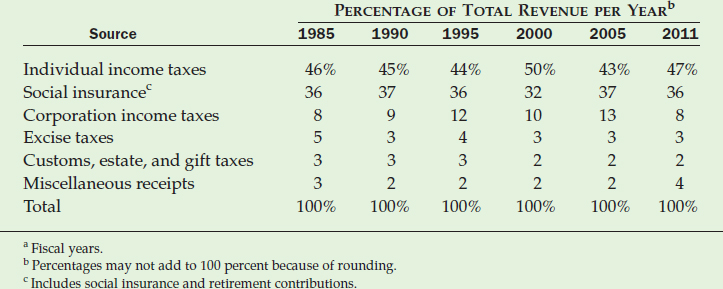
Sources: 1985 from Statistical Abstract of the United States: 1990, p. 310; 1990 from Statistical Abstract of the United States: 1996, p. 331; 1995 from Economic Report of the President, 2001, p. 370; 2000 from Economic Report of the President, 2002, p. 416; 2005 from Economic Report of the President, 2006, p. 378; 2011 from Economic Report of the President, 2012, Table B-81.
Progressive, Proportional, and Regressive Taxes
There are always issues around the payment of taxes. Even though voters may elect to raise a tax, few people welcome an additional tax burden. The burden of paying a tax is not the same for all individuals. The proportion of one's income that goes to a tax differs with each specific tax and with the level of income. To help us understand how a tax impacts income, we classify taxes as progressive, proportional, or regressive.
With a progressive tax there is a direct relationship between the percentage of income taxed and the size of the income: The percentage of income taxed increases as income increases and decreases as income decreases. The federal personal income tax is progressive. For 2011, taxpayers had six income steps. For a single taxpayer, there was a 10 percent rate on income up to $8,500 with progressing rates and steps: 15 percent for $8,500 to $34,500; 25 percent for income between $34,500 and $83,600; 28 percent for $83,600 to $174,400; 33 percent for $174,500 to $379,150; and 35 percent on income over $379,150.4 Some states also have income taxes with progressive rates.
Progressive Tax
A tax reflecting a direct relationship between the percentage of income taxed and the size of the income.
With a proportional tax, or flat tax, the percentage of income taxed is the same for any income, large or small. A city wage tax of, say, 1 percent means that an individual earning $10,000 per year would pay 1 percent, or $100, to the city and an individual earning $100,000 would also pay 1 percent, or $1,000. In each case, the same percentage of income is taken as tax. Proposals to change the federal income tax from a progressive to a flat tax often surface in political campaigns. Up for Debate, “Should the Federal Income Tax Be Changed to a Flat Tax?,” raises some interesting points for both sides of this issue. Which position do you favor, and why?
Proportional Tax (Flat Tax)
A tax equal to the same percentage of income regardless of the size of the income.
UP FOR DEBATE
 SHOULD THE FEDERAL INCOME TAX BE CHANGED TO A FLAT TAX?
Issue There have been several proposals to change the U.S. federal personal income tax from its current progressive structure to a flat tax, where everyone pays a tax equal to the same percentage of income regardless of the size of the income. Should we adopt a flat tax?
Yes The current federal income tax system should be abandoned in favor of a flat tax because the current system is complicated and not as progressive as it might appear. This system has hundreds of tax forms and schedules, and it is estimated that nearly 5 billion person-hours are required to “do taxes.” With these complications, people make mistakes or may not find the tax protection to which they are entitled. With a flat tax, a one-page form may be all that is needed.
Although in principle the current tax system is progressive, it is a system riddled with shelters and exemptions that favor special groups. Once people take advantage of various tax-reducing opportunities, such as home mortgage, business expense, and retirement account reductions, some of the progressiveness of the system may be reduced. In the end, some higher-income earners may not pay much more than lower-income earners. Also, the federal income tax is only progressive up to a point. While a larger percentage of income will be taxed for a person earning $500,000 than for a person earning $50,000, a person earning $5 million or even $50 million will pay no higher a percentage than the person earning $500,000. Where has the progressiveness gone?
No The current progressive tax structure should be maintained because of the uncertainty about who actually benefits from a flat tax and the possibility that a greater tax burden will be placed on people with lower incomes. While a flat tax system would be easier to understand and administer, the equalized tax rate could result in lower taxes for those with higher incomes and higher taxes for those with lower incomes. The real issue is whether a flat tax treats everyone the same or whether it puts a greater tax burden on those least able to pay the tax.
In other words, at the heart of the issue is the burden that will be placed on low income earners. If everyone is taxed at a flat rate of, say 25 percent, this means that someone making the minimum wage of $7.25 per hour would need to contribute $1.81 of that wage to federal income taxes. Subtract FICA and any state taxes or local earnings taxes and that person takes home very little income. There would not be much incentive to work for this type of wage; businesses would need to pay much higher wages to attract needed labor, perhaps forcing some small businesses to close. A high flat tax might also provide the incentive to find ways to work for unreported cash.
Think about this. A 25 percent flat rate tax on someone earning $200,000 a year leaves $150,000 for other taxes, spending, and saving. A 25 percent flat tax on someone earning $20,000 a year leaves $15,000 for those alternatives. A high flat tax would intensify the struggle that low income earners already face.
With a regressive tax, the percentage of income taxed varies inversely with the size of the income: The percentage increases as income decreases and decreases as income increases. In other words, a regressive tax hits those with low incomes the hardest. Sales taxes are considered to be regressive, particularly the sales tax on food. On the surface, sales taxes may not appear to be regressive because they are a specified percentage of a product's price or the amount sold. But remember, it is the relationship between the tax paid and income, not between the tax paid and the purchase, that makes a tax regressive. For example, with a sales tax of 6 percent on food, an annual grocery bill of $8,000 means that a tax of $480 must be paid. For a family earning $24,000 a year, that $480 tax amounts to 2 percent of their income. For a family earning $80,000 a year, it amounts to just 0.6 percent of their income. The person with a low income likely thinks about the $6 that must be paid with every $100 grocery order and what must be given up to pay it.
Regressive Tax
A tax reflecting an inverse relationship between the percentage of income taxed and the size of the income.
APPLICATION 6.1
 A CHRONOLOGY OF FEDERAL INCOME TAX POLICIES
- 1909 A federal corporate income tax of 1 percent with a $5,000 exemption is adopted.
- 1913 A federal individual income tax is enacted; applies mainly to a small number of high incomes—the lowest bracket is 1 percent on taxable income up to $20,000; taxes are paid in quarterly installments in the year following the receipt of the income.
- World War I Era The corporate income tax rate is raised to a high of 12 percent in 1918; the individual rate is raised to 6 percent on taxable income up to $4,000; and the top bracket rate is raised to 77 percent on taxable income over $1 million.
- The 1930s The corporate tax rate changes several times, ranging between 7 and 27 percent; no significant individual rate changes for most average-size incomes.
- World War II The need to raise revenue for the war effort causes significant increases in tax rates and a lowering of brackets and exemptions. Corporate rates reach as high as 25 percent on the first $25,000 of profit, 53 percent on the second $25,000, and 40 percent on profit over $50,000. Individual income tax rates reach as high as 23 percent on taxable income up to $2,000 and 94 percent on taxable income over $200,000.
- 1943 The tax payment system is changed so that individual income taxes are paid when income is earned, rather than in quarterly installments in the following year.
- 1952 The tax on corporate profit over $25,000 is raised to 52 percent and remains at approximately that level until 1974; however, other changes, such as rules for determining depreciation, occur over this same time period.
- 1964 The first significant cut in individual income taxes since the 1940s occurs; rates are cut on lower income brackets and the highest rate is dropped to 77 percent.
- 1968 A 10 percent additional charge is applied to all individual and corporate income taxes to help reduce inflationary pressure caused by spending on the Vietnam War effort.
- 1982 As a result of legislation in 1981, individual income tax rates are significantly lowered; the highest rate drops to 50 percent.
- 1987 Corporate tax rates, which have continuously declined during the 1980s, are lowered to 15 percent for the first $50,000 of profit and 34 percent on profit over $335,000.
- 1988 A new tax law takes effect that lowers the highest marginal rate on individual income to 33 percent.
- 1990–2011 The highest marginal tax rate fluctuates between 31 and 39.6 percent.
Tax Reform and Issues
Our elected government representatives frequently find themselves in a tug-of-war. On one side are those constituents who want more from government—a better equiped military, prescription drug coverage, more police patrols, local leaf pickup—and on the other side are those who want a reduction in taxes. As a consequence, changes in tax policies and structures, or tax reform, is the subject of much discussion and action at all levels of government. Sometimes tax reform reflects a need for more revenues to meet increased needs like school buildings for increasing numbers of school-age children or to purchase more fire equipment as new homes and apartments are built. But sometimes tax reform is rooted in politics. For example, candidates running for public office often make taxes a campaign issue as they attempt to win voters.
Tax Reform
Changes in tax policies and structures.
Value judgments and political considerations enter into all discussions of tax reform. If a state, for example, needs more funding for its highways, should it tax everyone equally, should a progressive tax that places a greater burden on people earning higher incomes be imposed, or should the tax be levied on those who directly benefit from using the highways?
Changes in the federal income tax provide good examples of how value judgments and political considerations lead to tax reform. Application 6.1, “A Chronology of Federal Income Tax Policies,” highlights some major changes in federal corporate and individual income tax rules that have occurred since the beginning of the twentieth century. What values or political considerations might explain some of the changes recorded in this application? How does armed military conflict tend to affect the structure of taxes?
Tax reform was particularly vigorous in the 1980s. In 1981, the concept of indexing, or adjusting, the federal personal income tax brackets to inflation was introduced. Tax bracket indexation helps offset “bracket creep,” which occurs when taxpayers are pushed into higher tax brackets as their money, or nominal, incomes increase to keep pace with inflation. Another significant overhaul of the federal income tax system occurred with the Tax Reform Act of 1986. This brought major changes in the way an individual's federal personal income tax is calculated, including a reduction in the number of tax brackets and rate levels in those brackets. Prior to this act, there were 15 brackets and a maximum tax rate of 50 percent. Today, with amendments to this act, we have six brackets with a maximum rate of 35 percent.
Tax Bracket Indexation
A policy of adjusting income tax brackets to account for inflation.
Tax Reform Act of 1986
Major legislation that changed federal income tax exemptions, deductions, brackets, and rates.
Tax Base An important decision for those imposing a tax is the tax base, or the particular thing on which the tax will be levied. For example, the tax base for an income tax is income, for a sales tax it is the price of the item sold, and for a property tax it is the value of the property. Often the choice of a tax base is determined by legislation, and some government units are limited in the selections they may make. The other important decision concerns the tax rate, or the amount that is levied on the base.
Tax Base
The particular thing on which a tax is levied.
Tax Rate
The amount that is levied on the base.
Many local and state governments are facing a declining or changing tax base. As large cities in the United States experience declines in population and the departure of businesses to other locations, local officials become concerned about an eroding ability to raise adequate revenues. In many large cities, taxes are being paid by fewer businesses, and the populations that remain tend to be poorer. On the other hand, many suburban communities have benefited from both property and sales taxes because of this migration. The growth in huge suburban malls and big-box stores, and the relocation of corporate headquarters have had positive tax consequences for the tax districts in which they are located.
Sometimes state and local governments try to lure large companies, retailers, and manufacturing facilities into their areas by providing substantial financial incentives, including tax abatement. For example, in September 2008, the Kokomo, Indiana, Council approved a 10-year, $160 million tax abatement for Delphi Electronics to continue hybrid technology work at a plant that provides about 3,000 jobs, and in August 2008, the Michigan Economic Growth Authority announced that more than $650 million in economic development projects in the state were approved, with many anchored by tax credits including abatement.5 And at many local levels, tax relief is sought to establish larger retailers and office buildings. Although the intent of these incentives is to create jobs and stimulate the economy in a region, many question whether state and local governments can recoup what they have been giving up.
Tax Abatement
A policy of reducing or eliminating a tax that would normally be charged.
FISCAL POLICY
We know that the amount of money that government spends and taxes affects the economy's levels of output, employment, and income. And, a change in either spending or taxes can cause the economy to move into an expansion, or recovery, or move into a contraction, or recession. When the federal government changes its spending and/or taxing to control unemployment or demand-pull inflation, it is putting fiscal policy into play.
Fiscal Policy
Influencing the levels of aggregate output and employment or prices through changes in federal government purchases, transfer payments, and/or taxes.
Fiscal policy has evolved largely from the theories of John Maynard Keynes, who focused on the relationship between aggregate spending and the level of economic activity, and suggested that the government could fill in a spending gap created by a lack of private spending. The theories of John Maynard Keynes and other economists are discussed in greater detail in Chapter 9.
The Mechanics of Fiscal Policy
If you remember the material in Chapter 5 (the role of spending, the circular flow, the relationship between leakages and injections), the mechanics of fiscal policy should be easy. Remember the basic principle of that chapter: Increases in spending cause the economy to expand and decreases in spending cause it to contract.
When the economy experiences unemployment because of a decline in spending, Congress could help to reverse that unemployment through fiscal policy actions that increase the level of aggregate spending and, consequently, the level of economic activity. Increased spending could come from
- increased government purchases of goods and services, and/or
- increased transfer payments, and/or
- decreased taxes.
These three actions could be taken separately or in combination.
Although each of these actions can cause economic activity to grow, the expansionary impact of increasing government purchases by a particular amount is greater than the expansionary impact of increasing transfers or decreasing taxes by the same amount. All of the dollars spent on government purchases are injected directly into the spending stream, whereas increased transfers and decreased taxes provide additional income, part of which will be spent but part of which will be saved. In other words, there would be a stronger economic impact from spending $10 million to improve trails in national parks than from giving taxpayers a $10 million tax break.
If the economy is experiencing demand-pull inflation from too much spending, the appropriate fiscal policy action for lowering the inflation rate is to decrease aggregate spending. Excess spending could be removed from the economy by
- decreasing government purchases of goods and services, and/or
- decreasing transfer payments, and/or
- increasing taxes.
Again, a more pronounced decrease in spending results from a decrease in government purchases because some of the reduced transfers and increased taxes would affect saving rather than spending.
Government expenditures and taxes affect nonincome-determined spending, and, as a result, they are subject to a multiplier effect. (Again, review this material in Chapter 5 if you have forgotten it.) This means, for example, if the government injected $50 billion into the spending stream through increased purchases or transfers, or through decreased taxes, the level of economic activity would increase by more than $50 billion. Alternatively, if the government withdrew $50 billion from the spending stream, output, income, and employment would decrease by more than $50 billion.
Discretionary and Automatic Fiscal Policy
Fiscal policy can be either discretionary or automatic.
Discretionary Fiscal Policy The members of Congress, sometimes with the leadership of the president, exercise discretionary fiscal policy when they deliberately adjust government spending or taxing in response to a problem with unemployment or demand-pull inflation. Congress has significant fiscal powers: It can cut or raise taxes, change tax exemptions or deductions, grant tax rebates or credits, initiate or postpone transfer programs, and initiate or eliminate direct spending projects.
Discretionary Fiscal Policy
Deliberate changes in government expenditures and/or taxes to control unemployment or demand-pull inflation.
Congress has used discretionary fiscal policy several times in recent decades. In 1968, a 10 percent surcharge was levied on income taxes to reduce inflation caused by Vietnam War spending. In 1975, a tax cut was passed to counteract a recession. In 2001, an effort was made for a tax cut to offset a threatening recession. To strengthen the economy in 2008, the U.S. Treasury sent payments of up to $600 per person to more than 130 million people in households that filed a 2007 federal tax return. And, significant amounts of discretionary spending, including a stimulus program, and tax cutting occurred in early 2009.
Automatic Fiscal Policy At the federal level, we have built-in automatic changes in government spending and taxing that help us to challenge a recession or demand-pull inflation. Without any deliberate action by Congress, automatic fiscal policy, or automatic stabilization, increases aggregate spending in a recession and dampens aggregate spending when the economy expands. Two automatic fiscal policy stabilizers are important: transfer payments, especially unemployment compensation, and the personal income tax.
Automatic Fiscal Policy (Automatic Stabilization)
Changes in government expenditures and/or taxes that occur automatically as the level of economic activity changes; helps to control unemployment or demand-pull inflation.
Let's consider a recession to understand how automatic stabilization works. During an economic downturn, when people lose their jobs and earned incomes fall, some important changes in government expenditures and taxes occur automatically. Some of the unemployed become eligible for transfer payments, particularly unemployment compensation. In addition, some unemployed people may realize lower tax payments, or even a tax refund. Because the federal personal income tax is structured as a progressive tax with several rate steps, unemployment and the resulting decline in income could drop a person into a lower tax bracket.6 Both the increased transfer payments and lower tax rates are automatic and provide additional spending dollars. Without these built-in stabilizers, or automatic responses, household spending would drop more dramatically and the economy would likely slide into a deeper recession.
When the economy expands, unemployment falls, and incomes rise, the built-in stabilizers automatically remove spending from the economy to dampen demand-pull inflationary tendencies. As more people are employed, the government provides less in transfer payments, and higher incomes push some individuals into higher tax brackets. Without this automatic removal of spending power as the economy heats up, particularly toward full employment, inflation could be worse.
Automatic stabilizers soften the impact of cyclical expansions and contractions. Without the help of any deliberate legislative action, they pump spending into the economy during a downswing and decrease aggregate spending during an upswing. However, in the face of a severe recession or inflation, automatic stabilizers alone would not be sufficient to correct the problem. The role of fiscal policy in economic stabilization is summarized in Table 6.5.
Economic Stimulus: 2008 and 2009
As noted earlier, Congress passed a bill in February 2008 that provided rebate payments of up to $600 for some individuals who filed a 2007 tax return. This was the first deliberate fiscal policy action to support the economy as it began to slide in 2008 and the first expansionary fiscal action branded as an economic stimulus program.
Economic Stimulus
A term used for fiscal policy actions to counteract a recession by stimulating spending through government purchases of goods and services, increased transfer payments, and/or decreased taxes.
TABLE 6.5 Fiscal Policy Summary
Discretionary fiscal policy and automatic stabilization can be used to control unemployment or demand-pull inflation by changing the size of the spending stream.

By the fall of 2008, there was sufficient economic evidence to warn of a serious downturn in the economy as unemployment rose and real GDP fell. The situation was complicated by the failure of some huge financial institutions, such as Lehman Brothers. By the presidential election in November 2008, interest turned from the war in Iraq as the major issue between the candidates to the state of the economy.
When Barack Obama was elected president, he began to advocate for a substantial economic stimulus package, one that he and his supporters believed was necessary to pull the economy out of a deepening recession. In February 2009, the American Recovery and Reinvestment Act (ARRA) was signed into law. This act provided for about $800 billion in government spending and tax cuts through a variety of programs. This economic stimulus included weekly payroll tax credits, as well as spending for health care, public infrastructure, schools, energy, and other areas. Because part of the intention of this spending was to put people to work immediately, applications for some of the infrastructure funding had a prerequisite that the project be “shovel ready,” that is, the project was ready to go and did not need time for right-of-way acquisition, design, or engineering.
American Recovery and Reinvestment Act (ARRA)
Passed in February 2009 to provide about $800 billion for stimulating the economy through government spending and tax cuts.
There has been debate over the impact of the stimulus spending that began in 2009. Even though the unemployment rate continued to be over 9 percent until the end of 2011, in the opinion of some economists the stimulus spending kept the economy from becoming much worse with a much higher unemployment rate. Critics of the stimulus spending have pointed to the budget deficits and debt that resulted from this spending as a negative outcome. An important question in this equation, however, is the impact of the automatic stabilizers. How would the decrease in tax revenues and the increase in transfers from more serious unemployment have affected the budget?
GOVERNMENT BUDGETS
Every year, elected officials who are responsible for determining how a political unit's money is spent—from a trustee of a small village in Illinois to a state legislator in California to your own congressperson—forecast their government's revenues and expenses and lay out a plan for the year ahead. Typically, there is a formal passage of this plan, or budget. Unfortunately, unpredictable events occur that can alter that budget. These range from economic slowdowns that lessen tax collections to disasters of extreme magnitude. Even the $4 per gallon gas in 2008 that wrecked family budgets hurt governments that had to fuel police cars, street sweepers, and trucks.
It is the resulting actual, not planned, year-end budget that is important for assessing how a government unit has influenced economic activity over the year. Here is where actual leakages from and injections into the spending stream are tallied. This figure indicates whether the government spent an amount equal to, less than, or greater than its revenues, or, putting it more technically, whether the government ran a balanced budget, a surplus budget, or a deficit budget.
Types of Budgets
When a government's total expenditures equal its total revenues, it has run a balanced budget. A surplus budget occurs when a government does not spend all of its revenues, or when total expenditures subtracted from total revenues yields a positive dollar amount. A government with a surplus budget can pay off past loans or save the surplus and earn interest on the funds. A deficit budget occurs when a government's total expenditures are greater than total revenues, or when total expenditures subtracted from total revenues yields a negative dollar amount. When a government operates with a deficit budget, it must either borrow and go into debt or use its reserve fund (savings) if one exists.
Balanced Budget
A government's total expenditures equal its total revenues.
Surplus Budget
A government's revenues are greater than its expenditures.
Deficit Budget
A government's expenditures are greater than its revenues.
It is the federal government budget that is of most interest when considering macroeconomic activity because of its size and its relationship to fiscal policy. Table 6.6 lists federal government receipts, outlays, and resulting surpluses or deficits for the years 1960 through 2011.
The Surplus or Deficit column of Table 6.6 indicates that the federal government typically operates with a deficit budget. While there were four consecutive years of budget surpluses from 1998 through 2001, those surpluses were preceded by 28 consecutive years of deficits.
There is substantial growth in the size of the budget deficits that began in the 1980s and carried through the 1990s. But, it is the budget deficits that began in 2004 that are most stunning, with significant numbers in 2009 and beyond. What accounted for these exceptional amounts?
It is important to understand that wartime is particularly hard on the federal budget. Table 6.6 shows that financing the Vietnam War brought a sudden high deficit in 1968. But financing the long multiyear conflicts in Iraq and Afghanistan from 2001 to 2012 are partially responsible for the enormous deficits in those years. Spending escalated for the armed forces: troops, equipment, transportation, medical care for returning veterans, and more. It was estimated that by the beginning of 2012 over $1.3 trillion was spent on these two conflicts.7
The state of the economy also played an important role in the high deficits of recent years. The slowdown in economic activity that began in 2008 was long and serious and kicked in automatic stabilizers that brought less in tax revenues and more in transfer payments. Notice, for example, the substantial decline in federal receipts from 2008 to 2009 and the additional weak receipt years of 2010 and 2011. Add to the deficit the economic stimulus spending as well as the tax cuts led by President George W. Bush that gave high income earners a reduction in the amount of taxes paid. In short, we usually cannot pinpoint one factor responsible for high budget deficits: many factors tend to contribute.
TABLE 6.6 Federal Budget Receipts, Outlays, and Surpluses or Deficits for Fiscal Years 1960–2011 (Billions of Dollars)

Source: Economic Report of the President (Washington, DC: U.S. Government Printing Office, 2012), Table B-80.
Beyond the Budget Figures The “watchdogs” of the federal government budget are keenly aware of issues that are masked by using the basic reported surplus and deficit numbers to evaluate the federal budget, as we have just done. Since 1969 the federal government has used a unified budget to report its surplus and deficit figures. That is, all federal government transactions for the year are reported in one lump sum. The unified budget figures, those used in Table 6.6, give no details about trust fund balances, the sizes of payments through entitlement programs, and government operations such as the U.S. Postal Service.
Unified Budget
A budget that assembles all federal government receipts and outlays, and the resulting overall deficit or surplus, in one report.
TABLE 6.7 Federal Government Unified, On-Budget, and Off-Budget Balances, 1995–2011 (Billions of Dollars)
In recent years, off-budget surpluses have reduced the size of the unified budget deficit.

Source: Economic Report of the President (Washington, DC: U.S. Government Printing Office, 2012), Table B-78. Figures are for fiscal years.
The federal government has created several trust funds to administer some of its programs. A trust fund is an account earmarked for a specific purpose or program: Contributions to the fund and distributions from it are used solely for the program. Social Security and Medicare are the best-known trust funds. With Social Security, for example, contributions from employers and employees go directly to the fund, and all payments to beneficiaries are made from the fund.
Trust Fund
A restricted fund; payments from this fund are specified as to recipients and/or uses.
The term entitlements refers to programs set up by the government to pay benefits to people who meet the eligibility requirements for the programs. Spending for entitlement programs tends to be less controllable than other types, such as funding for airport runways or national parks. Social Security and Medicare are examples of entitlement programs, as are veterans' benefits and the federal government employees' retirement program.
Entitlements
Programs set up by the government to pay benefits to people who meet the eligibility requirements of the programs.
To identify the effects of some of these government programs on the overall budget, the unified budget figures have been broken into two categories: on-budget and off-budget. Although Congress has not been consistent about identifying the types of programs in each category, the general guideline is that on-budget figures are for programs, such as interstate highway construction, that are more controllable and can be better used for fiscal policy actions. Off-budget figures are for programs, such as Social Security, that are less controllable. Table 6.7 provides the unified, on-budget, and off-budget surplus and deficit figures for 1995 through 2011.
On-Budget/Off-Budget
Categories of the unified budget established by Congress; generally refers to programs that have immediately controllable and noncontrollable receipts and expenses, respectively.
APPLICATION 6.2
HOW MUCH DO WE LOVE GRANNY?
Granny loves her grandkids; the grandkids love their grandparents. So, is there any concern about these familial relationships? Why do some people see the possibility of real tension and resentment in the years ahead?
It's the Social Security system. This system is on its way to paying out way more than it takes in and creating a huge financial burden on the younger generation—today's grandkids. Some estimate that the program will start losing money in 2018, and if it continues like it is today, it will lose over $760 billion a year by 2030.
Workers pay into the system when they work and get money from it when they retire. It's a big fund. People do not have individually managed accounts in their names. Instead, what people pay into the fund is used to help support people receiving payments. So the system needs workers to keep paying into the fund in order to make payments to recipients from the fund. The fund does have a reserve. It is just not enough.
The problem is a demographic one caused largely by the composition of the U.S. population. The number of people approaching retirement age is growing at a faster rate than the number of working people who will be making Social Security contributions. And the fund's reserve is not large enough to compensate.
The number of Americans 65 and older is expected to grow by over 70 percent from 2010 through 2030, while the number of workers 20 through 64 paying into Social Security is expected to grow by less than 5 percent. In 1935, when the Social Security Act was passed, there were 25 workers to support each retiree. Today there are only three, and by 2020 the number is expected to fall to two workers per retiree.
Here is the possible tension. Any suggestion to simply cut Social Security benefits could have dire consequences for all of those grandparents. For about two-thirds of its recipients, Social Security accounts for half of their income. For about 15 percent of the recipients, it is their only source of income. On the other side of the issue, any suggestion to raise the amount withheld from workers' paychecks for Social Security contributions could have a negative impact on many grandkids' incomes, particularly those who live on wages barely above the minimum wage level. In so many cases it is an individual situation: Some older workers live better than their grandkids; some do not.
Almost all of us live in a household where someone is paying into or receiving money from Social Security. Because of this, the coming Social Security crisis will likely affect most of us. What can we expect? You can be sure that we will have a difficult and controversial debate.
Sources: John Kiernan, “Commentary: Social Security in Need of Reform,” Long Island Business News, February 25, 2005, p. 1; Arthur Postal, “House Panel Divided on Social Security,” National Underwriter: Life & Health, March 14, 2005, p. 10; Elaine Thompson, “Group Wants Change in Social Security//Panelists Agree Crisis Must Be Averted,” Telegram & Gazette (Worcester, MA), July 22, 1998, p. B1.
Notice that the off-budget figures have been positive. This has occurred because of annual surpluses in the Social Security trust fund. That is, more Social Security contributions have been taken in each year than have been paid out. Building up the fund has been deliberate, since fewer working adults will support retirees in the years ahead. However, these substantial annual surpluses can lead to a misrepresentation about federal government deficits and surpluses. Without the Social Security surpluses, unified budget deficits would have been much larger and surpluses smaller each year. In 2011, for example, without the off-budget figures the deficit would have been $1,367 billion rather than $1,300 billion as reported in the unified budget.
Even with the substantial surplus in the Social Security trust fund, there is concern that the coming retirement of huge numbers of people in the baby-boom generation will cause an economic crisis. Current entitlement programs—especially Social Security and Medicare—as they now exist, even with a surplus, will not be able to support this large population. Application 6.2, “How Much Do We Love Granny?” offers some background about this predicament. Over the next few years, we can expect proposals for dealing with this impending demographic problem. What would you suggest as a change in public policy to deal with retirement entitlements? The Critical Thinking Case at the end of this chapter, “NIMBY (Not in My Backyard),” presents some interesting thoughts about how well we can face up to this issue as a nation.
The Budget and Fiscal Policy: Tying Them Together
All of our discussions concerning government spending and taxing, budgets, and fiscal policy can be tied together.
A surplus budget occurs when government revenues exceed government expenditures. Generally, a surplus budget will slow the economy as the amount removed from the spending stream is greater than the amount returned.8 In other words, a surplus budget dampens aggregate spending.
Discretionary fiscal policy suggests that the corrective action for managing demand-pull inflation is a reduction in government spending on its purchases and transfer payments and/or an increase in taxes. Each of these measures leans toward a surplus budget. And, in terms of automatic stabilization, in good times when spending is up, automatically tax collections increase and transfer payments fall. These, again, favor a surplus budget.
With a deficit budget, government expenditures exceed revenues, or more is pumped into the spending stream than is taken out. Unless the economy is at full employment and incapable of expanding, a deficit budget will increase economic activity. In other words, a deficit budget will increase aggregate spending as well as output, employment, and income.
If the economy is in a recession, fiscal policy measures that increase expenditures and/or reduce taxes can be used to aid in reversing the recession. These tools will push the budget toward a deficit position whether they are used deliberately or whether automatic stabilization, which causes tax collections to fall and transfer payments to increase in bad times, kicks in.
A balanced budget, contrary to common belief, does not have a neutral impact on economic activity. In determining the effect of a balanced budget, we must recall that dollars from income that has been taxed would otherwise have been used partly for spending and partly for saving. Thus, when the government spends those tax dollars on goods and services, it is taking some money that would have been saved and is spending it. As a result, a balanced budget has a slightly expansionary impact on the economy.
In summary,
- a surplus budget dampens aggregate spending and can aid in managing demand-pull inflation,
- a deficit budget increases aggregate spending and can help to reverse a recession, and
- a balanced budget can slightly expand the economy.
Test Your Understanding, “Government's Impact on the Macroeconomy,” gives you an opportunity to assess how various actions by the federal government influence the economy's output, employment, and price levels.
The Realities of Fiscal Policy and the Federal Budget
Let's lay aside the smooth, simple mechanics of fiscal policy and go to the real world where the federal budget doesn't always perform according to the ideal strategy for keeping the economy on track. There are several points to consider in assessing how well the economic concepts that we have just learned are translated into economic policy.
TEST YOUR UNDERSTANDING
 GOVERNMENT'S IMPACT ON THE MACROECONOMY
Indicate the effect of each of the following actions—taken alone—on the macroeconomy. That is, in each case determine the changes that would result in aggregate output, employment, or prices. Unless otherwise specified, in each case the economy is not operating at full employment.
- The amount that households can deduct from their incomes when calculating their federal personal income tax increases.
- Payments to Social Security recipients are increased, but there is an equal decrease in government purchases of military vehicles.
- The federal government balances its budget when the economy is at full employment.
- Congresspersons vote themselves a 20 percent pay increase.
- A budget surplus occurs as the economy falls into a recession.
- Taxes on cigarettes and alcohol are raised by 50 percent.
- The federal government increases taxes with the intention of paying off its accumulated debt within 10 years.
- Across-the-board increases are made in defense, highway, and education spending.
- The economy is at full employment, and the Social Security surplus is so large that social insurance taxes are lowered.
- The federal government runs a deficit budget while the economy is experiencing demand-pull inflation.
- The number of people eligible for payments under an entitlement program decreases.
- Government shuts down for a week because agreement cannot be reached on a new budget and funding authorization has expired under the old budget.
- The United States enters a military conflict without any tax increase to pay for it.
- The federal government decides to get out of the business of making loans and grants to college students.
Answers can be found at the back of the book.
While economists like to think that full employment and stable prices are the primary goal of congressional tax and spending plans, in reality congresspersons may have other goals in mind. For example, even though economic conditions might call for a reduction in spending, concerns about homeland security and global warming could result in additional federal expenditures to address those needs. In addition, spending and taxing priorities are usually in the messages of candidates running for political office. Often these messages are designed to appeal to voters and not to offer proposals that benefit the macroeconomy.
Fiscal policy and the federal budget are major components of the work of elected public officials. When a change in spending or taxing is proposed, these officials must consider their constituents and how the change will impact the group that the elected official represents. As a consequence, the broad view of “what is best” for the economy may take a congressional backseat to “what is best” for an electorate. It could be extremely difficult for a congressional representative to vote against expenditures that might provide jobs or other benefits for that person's district in the name of helping the larger economy fight an inflation problem. For example, congressional delegates in Missouri and Illinois would likely support funding for a bridge over the Mississippi River regardless of larger macro problems.
Fiscal policy takes time to enact: The statistical information that identifies the extent of an unemployment or inflation problem takes time to gather, and the political debate and discussion over policy tools and between Congress and the executive branch are again time consuming. Sometimes the problem can self-correct while Congress debates the issue.
There is one additional dimension: Since the government can easily borrow to cover budget deficits, from time to time we have seen examples of wasteful and extravagant expenditures. This has led to growing interest among economists in public choice, which is the study of the economic motives and attitudes of voters and public officials, and how those motives and attitudes affect government decision making. Public choice is discussed more fully in Chapter 11.
Public Choice
The study of the economic motives and attitudes of voters and public officials, and how those motives and attitudes affect government decision making.
THE NATIONAL DEBT
In the past few decades, the federal government has had a habit of running deficit budgets: Table 6.6 shows persistent annual deficits from 1970 through 1997 and substantial deficits since 2003. Just like people and businesses that must borrow because they have no savings and are spending more than they earn, the federal government must borrow funds to finance its deficits. And, as more is borrowed each year, the federal government goes deeper and deeper in debt. A surplus budget, which allows some of this debt to be repaid, occurs infrequently. The accumulated total debt of the federal government is called the national debt.
National Debt
The accumulated total debt of the federal government due to deficit spending.
APPLICATION 6.3
U.S. TREASURY SECURITIES
The following are some commonly asked questions, and their answers, about buying and holding U.S. Treasury securities as savings.a
Q: How much money do I need to purchase U.S. Treasury bills, notes, bonds, or TIPS?
A: Treasury bills, notes, bonds, and TIPS are issued in denominations of $100.
Q: How does a TIPS work?
A: The value of TIPS securities increases with inflation. For example, suppose in 2012 you bought a $1,000 TIPS paying 4 percent and maturing in 2017. If the economy went through a period of inflation between 2012 and 2017, the 4 percent interest you earn would be based on an amount larger than $1,000, as the face value of your certificate increases with inflation.
Q: Where can I obtain a U.S. Treasury security?
A: A security can be purchased directly from the government only when the government publicly announces its intention to borrow. A lender submits a bid stating the amount the lender will provide directly to the U.S. Treasury, a Federal Reserve bank or branch (see Chapter 7), a financial institution, or a government securities dealer or broker. Once a security has been issued, it can be bought and sold on a secondary market, which is a market for “used” securities. Treasury securities are regularly traded through brokers and some banks, and a fee is charged for this service.
Q: How much interest do I get, when do I receive that interest, and how do I receive it?
A: When a security is issued by the government, it carries both a maturity date and a stated annual rate of interest. Treasury bills are sold for less than their face value. At maturity you get the full amount. Interest is paid on Treasury notes, bonds, and TIPS every six months based on the stated rate. For example, if you have a $1,000 Treasury note with a stated interest rate of 8 percent, then you will receive a check, or direct deposit every six months for $40 until the maturity date, when you will receive the last interest payment and can claim the principal.
Q: Tell me more about the secondary market.
A: Previously issued Treasury securities can be bought or sold at any time on the secondary market. For example, if you have a $1,000 Treasury note carrying an 8 percent interest rate and maturing in 2020, and need your money tomorrow, you can go to a broker who will sell this security to someone else.
When you sell your security, you may get more or less than its face value. That is, you could get more or less than $1,000 for your note. How much more or less depends on the current interest rate that can be obtained on comparable securities. If the current rate is less than 8 percent, you could get more than $1,000, and if the rate is more than 8 percent, you could get less than $1,000. The selling price is generally found by dividing the annual dollar interest earned on a security by the current interest rate. For example, if the current interest rate is 10 percent, your $1,000 bond, which is earning $80 (or 8 percent) per year, will be worth about $800 ($80/0.10) on the secondary market. If the current interest rate is 6 percent, your $1,000 bond will be worth about $1,333 ($80/0.06).
Q: How safe are Treasury securities?
A: Because U.S. Treasury securities are backed by the U.S. government, most people consider them to be very safe.
a A good source, used here, of further information about Treasury securities can be found at www.treasurydirect.gov.
Financing the National Debt
When the federal government needs to raise money to finance its spending, it borrows at the lowest interest rate it can negotiate from anyone who is willing to lend it money. In return for funds, the lender receives a U.S. Treasury security: a formal IOU stating the federal government's promise to make specified interest payments and to repay the loaned funds on a particular date. The time span from issuance to the maturity, or repayment, date determines whether the security is a U.S. Treasury bill (often called a “T-bill”), which matures in one year or less; a U.S. Treasury note, which matures in less than 10 years; or a U.S. Treasury bond, which matures in more than 10 years. TIPS, or Treasury inflation-protected securities, adjust principal with inflation to protect investors.
U.S. Treasury Security
Issued by the federal government in return for funds lent to it.
U.S. Treasury Bill, Note, and Bond
U.S. Treasury securities that mature, respectively, in 1 year or less; 1 to 10 years; and 10 years or more.
Treasury Inflation-Protected Securities (TIPS)
U.S. Treasury securities with face values that rise when the economy experiences inflation.
The process for federal government borrowing is very open and public, and investors from the average family to highly sophisticated institutional fund managers participate in this process. When it wants to borrow funds, the government publicly announces the total amount it intends to borrow and the repayment date. A kind of auction occurs and the government borrows from those who offer funds at the lowest interest rates.
Who loans the federal government money or owns Treasury securities? The largest portion of the debt is currently held by the Federal Reserve and U.S. intragovernmental holdings. But individual investors, pension funds, mutual funds, insurance companies, and state and local governments hold substantial amounts of Treasury securities. China, Japan, and the United Kingdom held about 17 percent of the debt in early 2012.9 Perhaps the U.S. Treasury is in debt to you or your family. If you own a U.S. Treasury security, you have provided the federal government with borrowed funds. Many people are curious about the process of saving money through Treasury securities. Application 6.3, “U.S. Treasury Securities,” answers some frequently asked questions about this process.
Size of the National Debt
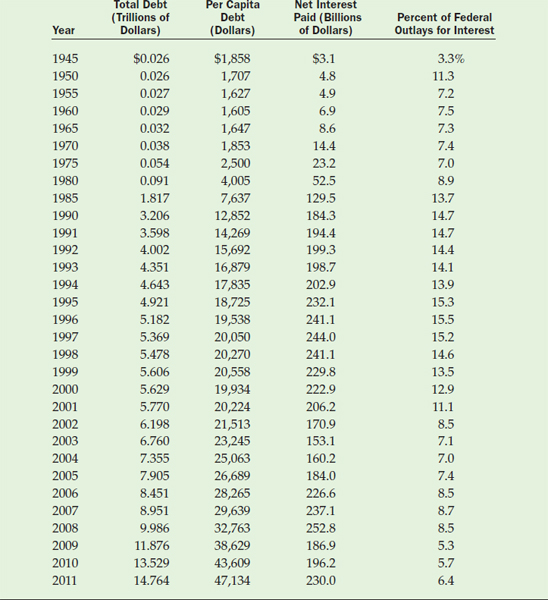
The size of the national debt is incomprehensible to most people: By the end of the 2011 fiscal year, it had grown to about $15 trillion. Table 6.8 gives the total national debt and the per capita debt for selected years beginning with 1945. Because the debt is linked to the federal budget, years in which deficit spending occurred were also years of an increase in the national debt. Notice the rapid and substantial increases in the debt since 1990, when the debt reached over $3 trillion, increased to over $6 trillion by 2002, and over $14.7 trillion by 2011.
The share of the national debt for every man, woman, and child in the United States is shown in the Per Capita Debt column of Table 6.8. These figures illustrate startling increases in recent years. To have fully paid off the debt in 2011, a family of four would have needed to contribute over $188,500 as its share.10
Assessing the Debt
How does the national debt affect the average person today? What does it mean for future generations? Has the debt become too large? Have the substantial increases in the debt in the past ten years been worth it? Should the debt be paid off as soon as possible? The national debt is frequently a topic of conversations—academic, political, and those around the kitchen table—and questions like these are typically discussed. Let us focus on a few critical issues.
TABLE 6.8 The National Debt, Selected Years 1945-2011a
Over the years, the national debt, the burden of the debt per person, and the interest the government pays to finance the debt have all grown.
Sources: Economic Report of the President (Washington, DC: U.S. Government Printing Office, 2012), Tables B-78, B-80; 1945 to 1999 population data from www.census.gov; 2000 to 2011 population data from Statistical Abstract of the United States: 2012, pp. 8, 9.
The interest that must be paid to borrow and maintain a debt of the magnitude we have created is a significant burden. The amount of interest paid annually to sustain the national debt is given in Table 6.8 in the column Net Interest Paid. In 2008, for example, $252.8 billion in interest—almost $5 billion per week—was paid to the holders of federal debt. These dollars are a significant percentage of the federal government's annual budget, as indicated in the last column of Table 6.8. There is an opportunity cost of paying this interest. Consider the many alternative uses for these dollars: education, the environment, the rebuilding of aging bridges and highways, and relief for areas hit by destructive weather to name a few.
The interest burden of the national debt cumulates as additional debt is incurred each year. Because the debt is not being retired, interest must be paid year after year. The burden of the debt service, or the interest cost of maintaining the debt, will be passed on to future generations who will have to pay the interest on the current debt. However, while the interest that must be paid is a burden to current and future taxpayers, we need to realize that many U.S. citizens own government securities and count on the interest payments for income. Treasury securities provide a relatively easy and popular way to save money.
Debt Service
The cost of maintaining a debt; generally measured in interest costs.
The issue of whether the national debt has become too large is a value judgment. At what point, even in the case of our own finances, do credit obligations become too high? One way to evaluate the size of the national debt is to examine it as a percentage of GDP, as is done in Figure 6.2. Notice that the debt as a percentage of GDP generally rose from the 1980s through the mid-1990s, declined, and then rose again with a very large rise in recent years. This way of evaluating the size of the debt is analogous to comparing an individual's debt and income. Obviously a person can sustain more dollars of debt at an annual income of $60,000 than at an annual income of $20,000. The problem is whether or not someone can sustain a debt that takes a rising percentage of income.
Should we, or could we, pay off the debt? It would be a huge, probably impossible, burden, even over several years, to raise through taxes and other revenues the amount needed to pay off the debt. (Recall that every person would need to contribute about $47,000.) With repayment of the debt, a significant income redistribution would occur as the average taxpayer had less income due to the increased tax burden and the holders of government securities had more income from their newly redeemed funds.
Also, some portion of the debt is external, or foreign-owned. While normally this is not a serious concern, in a period of accelerated repayment it would mean a sizable flow of dollars out of the United States. Finally, in order to pay off the public debt, a series of surplus budgets would be needed. Recall from earlier in the chapter that a surplus budget has a contractionary impact on the economy: While the debt was being paid off, economic activity would decline. In short, the opportunity cost of paying off the national debt would be a substantial slowdown in the economy.
Crowding Out
One other consideration involving deficit spending and the national debt is the strain that government borrowing puts on funds available for loans. The federal government competes with households and businesses to borrow whatever funds are available for loan making. If government borrowing is sizable, two important effects result in the market for loans. First, because the borrowing and lending of money takes place in markets where the forces of supply and demand determine interest rates (the price of money), increases in government borrowing increase the demand for loans and cause interest rates to rise. When the federal government borrows substantial amounts, the impact on interest rates can be significant.
Crowding Out
Occurs when borrowing by the federal government reduces borrowing by households and businesses.
A second effect of sizable government borrowing is the crowding out of private borrowing. Because households and businesses are sensitive to the interest rate, increases in the interest rate cause them to borrow less. The result is that available funds are soaked up by the federal government, which is not sensitive to the interest rate in its borrowing. Businesses and households borrow less for capital improvements, plant expansion, homes, automobiles, and such. With crowding out, economic growth may be slowed as businesses postpone borrowing to buy the machinery and equipment necessary for growth.
FIGURE 6.2 National Debt as a Percentage of GDP, 1980–2011a

One way to evaluate the size of the national debt is to compare it to GDP. The ratio of debt to GDP has generally been rising.
a Figures are for fiscal years.
Source: Economic Report of the President (Washington, DC: U.S. Government Printing Office, 2012), Table B-79.
Summary
- The two main categories of government expenditures are purchases of goods and services and transfer payments. Some government purchases are for public goods, which are provided for all of society and from which no one can be excluded.
- Governments receive revenues from taxes and other sources, such as contributions for social insurance. The primary source of federal government revenue is the individual income tax. Taxes may be classified according to the relationship between the percentage of income taxed and the size of the income: A progressive tax has a direct relationship, a regressive tax has an inverse relationship, and the percentage stays the same for a proportional tax.
- Tax reform sometimes occurs because of a need for additional government funding or for political reasons. A tax base is the thing on which a tax is levied, and the tax rate is the amount that is levied on the base.
- Fiscal policy refers to changes in government expenditures and/or taxes for the purpose of influencing the levels of output, employment, or prices in the economy. Fiscal policy can be used to reduce unemployment by injecting more spending into the economy through increased government purchases, increased transfer payments, and/or decreased taxes. Demand-pull inflation is reduced through decreased government purchases, decreased transfer payments, and/or increased taxes.
- Fiscal policy is either discretionary or automatic. Discretionary fiscal policy is the deliberate adjustment of government purchases, transfers, and/or taxes by Congress to control unemployment or inflation. Automatic stabilization is the automatic change in some government expenditures, like transfer payments, and some taxes, such as the federal personal income tax, that stimulates or dampens aggregate spending as the level of economic activity changes. These changes in spending and taxes automatically help soften the impact of unemployment or inflation.
- When a government's outlays are less than its revenues, it is operating with a surplus budget; when its outlays exceed revenues, it is operating with a deficit budget; and when its outlays and revenues are equal, it is operating with a balanced budget. Surplus budgets generally cause economic activity to contract, since the government is withdrawing more from the spending stream than it is returning. Deficit and balanced budgets are expansionary because the government is injecting more into the spending stream than is being taken out as taxes. A surplus budget would be proper policy for fighting demand-pull inflation, while a deficit budget would be appropriate for fighting unemployment.
- There has been a tendency to run annual federal budget deficits. These deficits are generally reported in a unified budget format rather than differentiating between on-budget and off-budget balances. The Social Security trust fund has been operating with annual surpluses that have reduced the size of the unified budget deficit.
- Fiscal policy considerations compete with other economic and noneconomic objectives in establishing the federal budget. The effectiveness of fiscal policy may be reduced by the time lag from the onset and discovery of a problem to the implementation of a remedy.
- The national debt is the debt owed by the federal government from the financing of its deficit budgets. In raising funds, the government borrows at the lowest interest rates offered from anyone willing to lend funds and gives U.S. Treasury securities in return. The size of the national debt has grown substantially over the years, as has the debt as a percentage of GDP. In addition, as the federal government borrows more, it can crowd out private borrowing.
Key Terms and Concepts
Government purchases of goods and services
Public good
Quasi-public good
Transfer payments
Social insurance program
Progressive tax
Proportional tax (flat tax)
Regressive tax
Tax reform
Tax bracket indexation
Tax Reform Act of 1986
Tax base
Tax rate
Tax abatement
Fiscal policy
Discretionary fiscal policy
Automatic fiscal policy (automatic stabilization)
Economic Stimulus
American Recovery and Reinvestment Act (ARRA)
Balanced budget
Surplus budget
Deficit budget
Unified budget
Trust fund
Entitlements
On-budget
Off-budget
Public choice
National debt
U.S. Treasury security
U.S. Treasury bill, note, bond
Treasury inflation-protected securities (TIPS)
Debt service
Crowding out
Review Questions
- Identify the major spending categories and the major revenue sources of the federal government.
- Determine whether each of the following taxes is progressive, proportional, or regressive.
- A sales tax of 7 percent on medicine
- A state income tax with three brackets: 3 percent for income under $20,000, 8 percent for income between $20,000 and $100,000, and 15 percent for income over $100,000
- A property tax of $2.85 per $100 of assessed property value
- A tax of $8 on room occupancy in all hotels in a county
- A tax of 3 percent on all wages earned in a city
- A sales tax of 5 percent on utilities
- A federal tax of $2 per pack of cigarettes
- Identify the tax base in each of the examples in Question 2.
- Explain how automatic stabilization stimulates spending in a recession and dampens spending during periods of demand-pull inflation. How does automatic stabilization affect the federal budget?
- Explain whether the economy will expand, contract, stay the same, or inflate with each of the following fiscal actions taken alone. Assume the economy is not at full employment unless stated otherwise.
- Congress votes and sends a $600 tax credit to each taxpayer.
- Households are taxed an extra 15 percent, and the government spends the entire amount on purchases of goods and services.
- Congress allows many new income tax deductions when the economy is at full employment.
- Although Congress intends to balance the budget, a deficit occurs.
- At the end of a war, defense expenditures drop dramatically but are replaced by domestic spending programs for health and education.
- Congress decides to decrease defense expenditures with no increase in other spending programs.
- Congress increases expenditures for transfer payments at the same time it reduces spending on highways and bridges by the same amount.
- Congress works to run a surplus budget and debt reduction during a serious recession.
- If the U.S. economy fell into a serious recession, what could Congress do to counteract that recession? Specifically, how could it use each of its fiscal policy tools?
- What effect would each of the following, taken alone, have on a federal budget that is currently balanced? How would the budgetary changes, where they occur, affect the national debt?
- An increase in the percentage of income taxed in each of the federal personal income tax brackets
- An increase in government expenditures for research on global warming
- An equal increase in government expenditures and income tax revenues
- An increase in defense expenditures and a decrease in corporate income tax revenues
- An increase in Social Security payments by the government matched by a decrease in a subsidy to a particular group in the economy, such as farmers
- An exemption from federal income tax for interest earned on small savings accounts in banks
- Could the national debt be eliminated over the next 10 years? How? What are the opportunity costs of paying off the debt and not paying it off?
- How does crowding out affect businesses?
Discussion Questions
- Suppose that the legislators in a particular state are choosing among three strategies to raise revenue: (1) imposing a progressive income tax; (2) imposing a sales tax on food; and (3) imposing a 1 percent tax on all earnings within the state. How do you think residents of the state in the upper, middle, and lower income groups would react to each of these proposals? Which of the three strategies do you favor? Which of the three has the greatest likelihood of being passed?
- Give some arguments for and against a federal personal income tax that would be proportional rather than progressive. Who stands to win and who stands to lose from a flat tax?
- Suppose that government policymakers are concerned about a forecasted recession. As a consequence they want to increase spending in the economy by $10 billion and can follow any one of three policies: (1) a $10 billion increase in government purchases of goods and services; (2) a transfer payment increase that would provide funds for households to spend $10 billion; or (3) a reduction in taxes by an amount that would put $10 billion into spending. Does it make any difference which of the three policies is chosen? How would each affect the federal budget? Why might policymakers choose one policy over another?
- Do you favor legislation requiring the federal government to balance its budget? Why? What are the economic implications of your position?
- Off-budget entitlement programs such as Medicare have grown in recent years. Could Congress reasonably limit spending for Medicare given the demographics of the country?
- You are invited to participate in a commission that is exploring the future of the Social Security system. What recommendations might you make?
- Locate the most recent figures for the national debt. Has it increased or decreased in recent years? What type of effect will this debt have on future generations?
- Assume that you are a congressperson whose district may be awarded a multimillion-dollar rapid transit project. The economy, however, is in the throes of one of the more severe inflationary periods of the decade. How would you vote on the passage of funds for the project? What would you tell your colleagues? Your constituents?
- Crowding out, where businesses and households are forced out of the market for borrowed funds by federal government borrowing, occurs because businesses and households are sensitive to interest rate changes while the federal government is not. Why is federal borrowing not sensitive to the interest rate? What would be the effect on federal programs if it were sensitive to the interest rate?
Critical Thinking Case 6 
NIMBY (NOT IN MY BACKYARD)
Critical Thinking Skills
Ranking alternatives
Evaluating effects of decisions
Recognizing conflicting objectives
Economic Concepts
Balanced budget
Government expenditures and revenues
Budget determination process
Balancing the federal budget has been one of the most talked about economic agenda items for years. Democratic and Republican lawmakers alike have been on record backing a balanced budget, and, in principle, there is much support for the proposal among U.S. citizens.
The problem is that a balanced budget, given the usual deficit position of the federal government, requires an increase in taxes and/or a decrease in spending. So, once the discussion of creating a balanced budget moves from generalities to specific needed changes in taxes and/or spending, the supportive position for a balanced budget frequently turns to one of opposition. There is a saying that may be appropriate here: “not in my backyard,” or NIMBY.
NIMBY often results when people support an idea in general—like a reduction in some government programs or the construction of a big box store in their community—until they see negative consequences for themselves. Once there is a real or perceived negative individual impact from a government decision, support for that action evaporates.
This puts U.S. Congresspersons in a tough situation as they try to find acceptable actions to balance the budget. The following is a list of possible proposals that would raise revenue or cut costs in an effort to find a balance. Review this list as if you were in Congress and had to vote on these various proposals. Then answer the questions below.
Proposals to Balance the Budget
- Increase all individual income taxes by 10 percent.
- Increase the corporate income tax by 20 percent.
- Cancel the income tax deductions for home mortgage interest payments.
- End all agricultural subsidies.
- Reduce defense/military expenditures for troops and equipment.
- Cut government spending on Medicare by 25 percent.
- End scholarships, low-interest loans, and other financial support to college students.
- Reduce expenditures on conservation and the environment.
Questions
- What groups would be most affected by each of these proposals?
- Rank the proposals according to the likelihood that each would be approved by Congress. Rank the most likely to be approved first and the least likely last. Why did you rank these proposals in this way?
- Based on these proposals, what conflicts, if any, are there between the goal of a balanced budget and other goals that you as a congressperson might seek?
- It has been said that it is easier to promise that the budget will be balanced than it is to balance the budget. Based on your experience with these proposals, what do you think is the likelihood that the budget will be balanced?
1 Borrowing at the federal level is done through various securities issued by the U.S. Treasury and at the state and local levels with municipal bonds or other instruments.
2 Economic Report of the President (Washington, DC: U.S. Government Printing Office, 2012), Table B-82. Based on preliminary total government revenue figure for third quarter of 2011. Resident population for 2010 was used to calculate per capita numbers. U.S. Census Bureau, Statistical Abstract of the United States: 2012, Table 1.
3 Statistical Abstract of the United States: 2012, p. 284. Taxes were estimated for 2009.
4 “Individual Federal Income Tax Rates by Tax Year,” www.efile.com/tax-rate/federal-income-tax-rates/.
5 Ken de la Bastide, “Council approves Delphi abatement,” Kokomo Tribune.com, http://www.kokomotribune.com; “Granholm announces $658 million in investments,” Crain's Detroit Business, http://www.crainsdetroit.com, December 8, 2008.
6 The following example helps to clarify this point. Assume that a person was earning a taxable income of $60,000 in 2011, and that an amount sufficient to pay a total federal income tax of $11,131 for the year was withheld every month from his pay. If this person lost his job and his 2011 taxable income was reduced by one-half to $30,000, his tax bill would have been only $4,079, or less than 37 percent of the tax on $60,000. From Department of the Treasury, Internal Revenue Service, 2011 1040 Instructions, pp. 77, 81.
7 National Priorities Project, costofwar.com, February 4, 2012.
8 The expression generally is used because the ultimate impact of the budget depends on the types of taxes collected, the percentage of those taxes that would have been saved, the percentage of expenditures that goes directly into purchases of goods and services, the percentage of transfers that is saved, and so forth.
9 Paul Toscano, “Biggest Holders of US Government Debt,” finance.yahoo.com/news, February 2, 2012.
10 A word of caution is in order regarding comparisons of the burden of the debt from year to year. The figures in Table 6.8 are in current, not real, dollars, so inflation has not been factored into these numbers.