CHAPTER OBJECTIVES
To define a market and explain how its boundaries are determined.
To explain how a firm's pricing and profit behavior are related to the amount of competition it faces in its market.
To give the basic characteristics of the four market structures: pure competition, monopolistic competition, oligopoly, and monopoly.
To describe an individual firm's demand curve, pricing behavior, and nonprice competitive behavior in each of the four market structures.
To explain how a firm's long-run pricing and profit behavior and the degree of efficiency it achieves are affected by the amount of competition it faces in its market.
To evaluate how consumers fare and how efficiency is achieved by firms in each of the four market structures.
To explain (in an appendix) how a firm determines its profit-maximizing price and output level.

We interface with many businesses, ranging from the local sandwich shop to big box stores to huge insurance companies. Each of these businesses, like the other 31-plus million businesses in the United States, behaves differently. Some businesses have great control over the prices they charge for their products, while others have little or no control. Some spend millions of dollars on social media, advertising, and public relations, while others spend nothing. And the bottom line for some firms yields continuous economic profit, while other firms, no matter how well they are managed, have no such prospect.1 Think about the different pricing, advertising, and profit behaviors of a farmer, your bank, a sports franchise, a favorite restaurant, a major oil company, and the owner of the concessions at a stadium.
The greatest influence over the price and nonprice decisions of a firm and its ability to earn economic profit over the long run is the competition it faces in its market. All other things being equal, the greater the competition in a market, the less control a business in that market has over the price it charges, and the less likely the firm is to earn economic profit on an ongoing basis. The less the competition in a market, the greater the control a business has over the price it charges, and the more likely the firm is to earn economic profit over the long run. Think again about a business that has the sole rights to concessions at a stadium. With no competition, that business has strong control over the pricing of whatever it sells. People will likely pay more for a drink and burger at a stadium than at one of several local pubs.
The amount of competition and the form it takes differ from market to market. We know, however, that patterns can be identified that allow us to group sellers into different classes of markets called market structures. To put order into the study of the effects of competition on business decision making and behavior, economists have adopted four market structures to represent different competitive situations: pure competition, monopolistic competition, oligopoly, and monopoly. These four structures encompass a spectrum of competitive conditions. At one end of the spectrum is pure competition, where the competitive pressure is the strongest, and at the other end is monopoly, where there is no direct competition. In between are monopolistic competition, which is closer to pure competition, and oligopoly, which is closer to monopoly.
Market Structures
A system for grouping and analyzing markets according to the degree and type of competition among sellers.
In this chapter, we will analyze each of the four market structures. Particular attention will be paid to the main characteristics that distinguish each type of market and to how those characteristics affect a firm's behavior and profit expectations.
DEFINING A MARKET
We know from Chapter 12 that an industry is a group of firms that produce similar products or use similar processes. How does this differ from a market where firms sell similar products? Are firms in the same industry necessarily in the same market?
Industry
A group of firms producing similar products or using similar processes.
Businesses are in the same market when they sell similar products and compete with each other for the same buyers. For example, a movie theater in Chicago and one in Manhattan are in the same industry because they sell similar products, but because they do not compete with each other for the same buyers, they are not in the same market. The movie theater in Chicago and the one in Manhattan are in different markets with different competitors and different customers. In simple terms, a market defines a firm's competitive environment.
Market
Includes firms that sell similar products and compete for the same buyers.
The boundaries of a market are determined along two lines: geography and product substitutability. The geographic boundary of a market depends on the size of the area in which sellers compete for buyers. Markets may be local, regional, national, or international. A bagel shop that competes for customers from a particular neighborhood or town is in a local market, whereas a top-notch university graduate program in business is in an international market because it competes for buyers all over the world. Increasingly, U.S. firms are competing in international markets.
Geographic Boundary of a Market
Defined by the geographic area in which sellers compete for buyers.
The product boundary of a market is defined by product substitutability. Sellers are in the same market when buyers view their products as substitutes. If movies are seen as substitutable for live theater, then they compete in the same market. If buyers think that movie rentals, band concerts, opera theater, and ballet are substitutes for movies, then all of these are in the same market.
Product Boundary of a Market
Defined by product substitutability among buyers.
Trying to identify the boundaries of a market and determine which products and geographic areas are included is important because the size of a market significantly affects the degree of competition that a firm faces: The larger the market, the greater the number of sellers and the greater the competition. However, the definition of a market can be debated because its boundaries are uncertain, and different perspectives yield different opinions as to what constitutes the geographic and product dimensions of a market. For example, if you ask several friends to define the market that your local movie theater is in, you may get several different responses. One person might define the market in a very narrow sense and include only local movie theaters. Another person might regard the relevant market as entertainment and include all theatrical, sporting, musical, and other such events within 50 miles.
One place where the controversy about the boundaries of a market becomes important is in courts of law hearing cases on alleged violations of the antitrust laws. The antitrust laws are designed to protect competition in markets and will be more fully discussed in Chapter 14. One type of antitrust case heard by the courts involves a firm or other organization accused of taking over, or monopolizing, a market. In these cases, the definition of the boundaries of the market is critical because how broadly or narrowly the market is defined impacts the court's decision.
In an antitrust case, the accused will likely present one definition of its market's boundaries, and the accuser another. The court must then determine which definition is correct and, partly on that basis, decide on the guilt or innocence of the accused. An example of this type of market definition problem is given in Application 13.1, “Defining the Boundaries of a Market: The NCAA Case.” This excerpt from the court record of that well-known antitrust case shows some of the considerations important to the court in determining which definition of the relevant market to accept when deciding on the legality of the National Collegiate Athletic Association's control over televised college football games. The NCAA defined the market as all broadcast programming, and the universities that brought this suit defined the market as live televised college football. How does product substitutability figure into the court's decision?
APPLICATION 13.1
 DEFINING THE BOUNDARIES OF A MARKET: THE NCAA CASE
A suit by the Board of Regents of the University of Oklahoma and the University of Georgia Athletic Association against the National Collegiate Athletic Association went to trial in 1982. The suit was over the NCAA's control of the televising of college football games. In this trial were two definitions of the relevant market: the universities' definition that the market is “televised live college football,” and the NCAA's definition that the market is “all broadcast programming.” The court's conclusion and some of its reasoning are given below.
The Court concludes that the relevant market for testing whether the NCAA exercises monopoly power is live college football television. This conclusion is based on the following facts….
… The vast majority, some 75 percent, of intercollegiate football games are played on Saturday afternoon. On Saturdays, college football television is free of competition from the programming which logically is the most substitutable; professional football…. The games to be broadcast are quite clearly a perishable item. Once the game is over and the score of the game is made known to college football fans, viewers are not nearly so likely to watch the game on a delayed telecast basis…. To suggest that college football competes with the complete spectrum of broadcast programming is to ignore the clear fact that Saturday afternoon is the only time at which this perishable product is uniformly available to the broadcaster.
Another factor supporting this conclusion … is that on Saturday afternoons the type of programming against which the NCAA football telecasts compete is qualitatively different from that available at other times of the week…. It is generally agreed that the quality of Saturday afternoon television, excepting the sports programming, is lower than that offered during other times of the week….
There are also unique characteristics of the product itself…. NCAA football is a unique product because of its history and tradition, the color and pageantry of the event, and the interest of college alumni in the football success of their alma mater….
The defendant's theory that the relevant market is all broadcast programming is untenable. College football simply does not compete with shows such as … “Saturday Night Live.”… To accept the defendant's theory of relevant market is to say that every type of programming seen on network television competes with every other type of programming. This is simply not so. Programming patterns vary not only by day of the week, but by the time of day. The audiences for different types of programming have extremely diverse demographic characteristics. The types of advertisers who buy commercial time vary greatly depending on the type of programming….
Source: Board of Regents of the University of Oklahoma v. National Collegiate Athletic Association, 546 F. Supp. 1276 (1982), pp. 1297, 1299.
THE MARKET STRUCTURES
We know that the degree of competition that a business faces in a market influences its behavior with regard to the prices it charges, the profit it makes, and the nonprice competition it uses. Economists have created four models of market situations, called market structures, to represent degrees of competition and study their effects: pure competition, monopolistic competition, oligopoly, and monopoly.
Each of these market models has a set of characteristics that differentiates it from the other market models, and is important for determining the type and amount of competition a firm faces. For example, certain features are associated with a monopoly structure and others with oligopoly. The distinguishing characteristics of each of the market models center around three areas.
- Number of sellers. The number of sellers in the market is important to the amount of competition. A market may have one seller, thousands of sellers, or some number in between.
- Product type. The product sold in the market can be identical from seller to seller or be differentiated. If a firm can distinguish its product from those of its competitors through size, color, or any other attribute, then nonprice competition can arise.
- Entry and exit. The ease or difficulty with which firms can enter or leave the market affects competition. It may be extremely easy for new firms to begin selling in the market, or it may be virtually impossible.
The remainder of this chapter describes the four market structures and analyzes the behavior of firms in each structure. For each structure we will evaluate the control that a business has over the price it charges, the influence and effect of nonprice competition, and whether firms tend to make an economic profit and operate efficiently in the long run.
PURE COMPETITION
Characteristics of Pure Competition
The following characteristics define a purely competitive market.
Purely Competitive Market
A market with a large number of independent firms selling identical products, and with easy entry into and exit from the market.
- There is a very large number of sellers acting independently of each other.
- The products offered for sale are identical: Buyers cannot distinguish the product of one seller from that of another.
- Entry by business firms into a purely competitive market is easy, as is exit from the market. There are no legal restrictions, fees, impossibly high capital requirements, patents, or other barriers to entry.
Barriers to Entry
Factors that keep firms from entering a market; can be financial, legal, technical, or other barriers.
The markets for crops such as corn, oats, and wheat provide classic examples of pure competition. In each of these markets there are thousands of independent sellers, and the output of any one seller is indistinguishable from the output of any other. Entry into these markets is easy because not much is required to grow these crops.
The market in which a corporation's common stock is traded may also provide an example of pure competition. With companies such as Microsoft, Pepsico, and Starbucks, millions of shares of stock are held by thousands of owners. Each share of a company's stock is identical to each other share, and it is easy to enter and exit the market to buy and sell.
Behavior of a Firm in Pure Competition
Pure competition is the market structure to which other markets are compared. As will be shown, it is the ideal from the buyer's point of view because of the prices, costs, profit levels, and efficiency gains that result from the competition.
Control over Price One of the most important aspects of the behavior of purely competitive sellers is that the firms are price takers: No individual firm has any control over the price it receives for its product. Price is determined solely through the market's competitive forces; that is, price is determined by the interaction of market supply and market demand. The price that a firm charges is a result of the decisions of all buyers and all sellers in the market.
Price Taker
A seller with no control over the price of its product; takes the market price.
Figure 13.1 illustrates the market for a grain crop (such as wheat) and allows us to review the market price-setting process covered in Chapter 3. D is the market demand curve showing the different amounts of grain that all buyers together plan to purchase at different prices. As expected, the curve is downward sloping, indicating that the lower the price, the greater the quantity demanded in the market. S is the upward-sloping market supply curve, showing that all sellers (grain farmers) together offer more of the product for sale at a higher price. The actual price that emerges in this market is $3 per bushel. This is the equilibrium price that equates market demand and supply.
FIGURE 13.1 Market Demand and Supply for a Grain Crop

In a purely competitive market, market demand and supply determine the equilibrium price and quantity of a product.
In this example, an individual purely competitive firm can sell as much or as little as it wants at the price of $3 per bushel. It cannot charge more than $3 and will not charge less than $3. Why is this so?
Due to the large number of independently acting sellers in the market, the entire output of any one seller represents a “drop in the bucket” compared to the total available output. A seller that would charge a price higher than the market price would sell nothing because buyers can choose from thousands of alternative sellers. Because one seller's product is identical to that of all other sellers, it makes no difference with whom a buyer deals.
It would also be pointless for a single seller to offer output at less than the market price. A grain farmer would not sell grain at $2, $2.50, or even $2.99 per bushel, knowing that the entire crop can be sold at the market price of $3 per bushel. The same pricing behavior exists with regard to common stock. If you own a particular stock and the market price per share is $19.50, you cannot sell your shares for more than $19.50 and have no reason to sell them for less.
Because of large numbers of independent sellers supplying identical products, purely competitive firms have neither the willingness nor the ability to deviate from the price set in the market.
Demand for an Individual Firm's Product For any product sold, regardless of the market structure, there is a downward-sloping market demand curve such as that shown in Figure 13.1. In addition to the market demand curve, each individual seller also has a demand curve for its own product. This represents the amounts of the seller's product that buyers are willing to purchase at certain prices. Thus, an individual firm's demand curve dictates the price a firm will receive when it chooses an output to sell.
Market Demand Curve
The demand curve for all buyers in the market together.
Individual Firm's Demand Curve
Shows the amounts of an individual firm's product that buyers are willing to purchase at particular prices.
FIGURE 13.2 Demand Curve for the Output of a Purely Competitive Seller

A firm in a purely competitive market can sell as much or as little as it wants at the market price.
Remember that in pure competition the price an individual firm receives for its product is set by the forces of supply and demand in the market, and each firm supplies a minute fraction of the market. Since the firm's output is negligible when compared to the total, it can offer as much or as little as it chooses at the market price. Thus, the demand curve for any single purely competitive seller's product is graphed as a straight, horizontal line at the equilibrium market price.
The grain example in Figure 13.1 can be used to illustrate this concept. At an equilibrium price of $3 in the market, the demand curve for a single seller's grain output would be like that shown in Figure 13.2. At $3 per bushel, buyers are willing to purchase 1,000 bushels, 5,000 bushels, or whatever output the seller wants to offer. If the seller were to charge more, say even $3.01, sales would drop to zero. There would also be no incentive to sell for less than $3 per bushel, since that is the price buyers will pay.
The graphs enable us to better see the relationship between the equilibrium market price and the individual firm's demand curve as well as how changes in the market affect the individual seller. If the equilibrium price in the market increases or decreases, the individual firm's demand curve will also increase (shift upward) or decrease (shift downward). If a large number of new buyers enters the market for the grain in our example, the market demand curve will shift to the right. As a consequence, the equilibrium price in the market rises, and the individual firm's demand curve shifts upward. This is shown in Figure 13.3, where the price increases from $3 to $4 after market demand increases from D1 to D2. What would be the effect on an individual firm's demand curve from an increase in market supply?2
FIGURE 13.3 Effect on the Individual Firm of an Increase in Market Demand
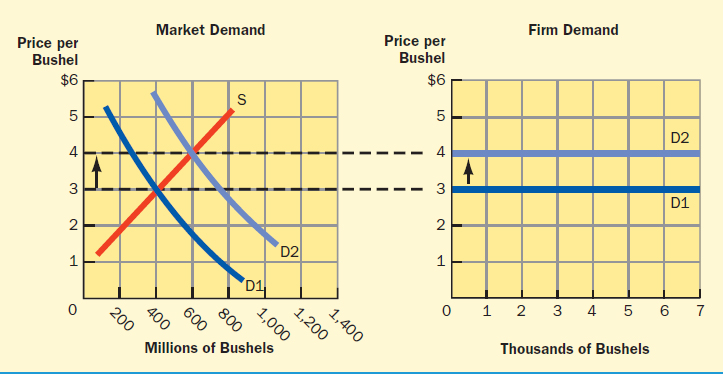
An increase in the market demand for a product will increase its equilibrium price and cause the individual firm's demand curve to shift upward.
Application 13.2, “The Farmers' Almanac: It's a Necessity,” takes a closer look at what it is like to be a seller in a purely competitive market. After reading the application, do you think that simply having to accept the price set in the market clears away a large amount of the uncertainty, risk, and complexity that we think accompanies the management of a business?
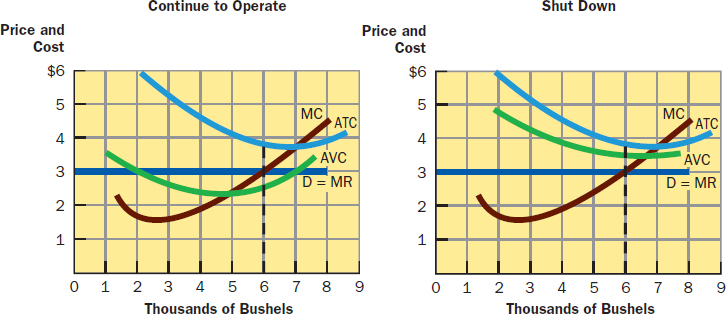
Pricing, Profit, and Loss Given that the purely competitive firm has no control over price, can it make a profit? It is possible in the short run that a business could make an economic profit, operate at a loss, or break even with a normal profit. (Remember that normal profit is the profit necessary to stay in business and is included in the economic cost of production. Economic profit is that profit earned beyond normal profit.) To determine its profit or loss position, a firm will compare the price it receives for a product and the cost of producing it.
It is easy to see the profit or loss position of a firm by graphically comparing the firm's demand curve and its average total cost curve. The firm's demand curve gives the price it will receive for each unit of output sold, and the average total cost (ATC) curve gives the cost for producing each unit of output.
Figure 13.4a shows a firm in pure competition that is operating with an economic profit. Economic profit results because the firm's demand curve is above the average total cost curve, or price is higher than average total cost. Figure 13.4b illustrates a firm in pure competition operating with a loss. This loss occurs because the demand curve is below the average total cost curve, or price is lower than average total cost, regardless of the level of output produced. In Figure 13.4c a firm is just breaking even (earning a normal profit) if it produces and sells Qx units of output because price is equal to average total cost at that level of output.
Economic Profit, Loss, or Breaking Even
Occurs when price is greater than, less than, or equal to average total cost, respectively.
FIGURE 13.4 A Purely Competitive Seller Operating with an Economic Profit, a Loss, or Breaking Even
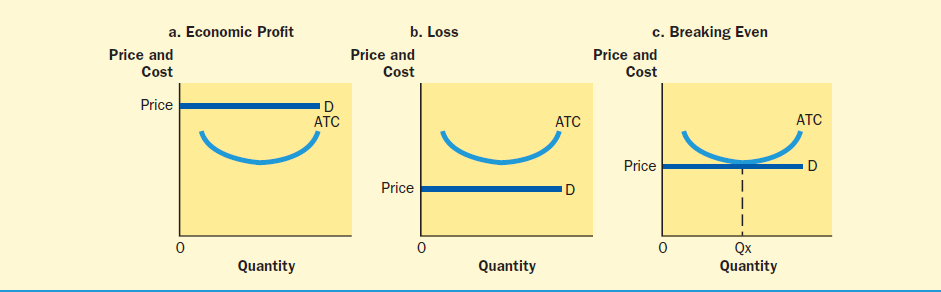
A seller will operate with an economic profit, a loss, or break even, depending on whether price is greater than, less than, or equal to average total cost, respectively.
The appendix at the end of this chapter explains in greater detail how a firm in pure competition determines its profit-maximizing or loss-minimizing level of output.
Nonprice Competition Firms in pure competition have no need to engage in nonprice competition. A purely competitive seller makes no expenditures on advertising, public relations, or other efforts to bring its product to a buyer's attention. The reason for this is obvious: With so many firms selling identical products, efforts at creating buyer awareness of a particular firm's product would be a waste of time and money.3
Nonprice Competition
Firms focus on a feature other than price to attract buyers to their products.
The benefit to consumers from this lack of nonprice competition is that, with no promotional expenditures, firms' costs are lower than they would otherwise be. This in turn means that over the long run, buyers pay less for products.
Long-Run Costs, Profit, and Efficiency As we examine and evaluate the four market models, one of the most important aspects of our study is the long-run behavior of firms in pure competition. In the long run, purely competitive firms operate at the lowest possible cost, charge the lowest price that they can without going out of business, and earn no economic profit. All of these conditions are ideal for the consumer and result from competition among sellers.
The long-run position of a purely competitive seller is illustrated in Figure 13.5. This figure shows a simple long-run average total cost (LRATC) curve exhibiting economies and diseconomies of scale as well as the firm's demand curve. In the long run, an individual purely competitive seller's position is such that its demand curve just brushes the bottom of its long-run average total cost curve. A firm operating under the conditions given in Figure 13.5 would sell 4,000 units of output at $3 per unit, or would operate at point A. Any other output level would result in a loss because the long-run average total cost curve would be above the demand curve.
APPLICATION 13.2
THE FARMERS' ALMANAC: IT'S A NECESSITY
What's it like to be a farmer selling corn in a purely competitive market? Take the case of Doug, a farmer in central Illinois. His harvest is in, and he has a few hundred acres of his corn crop stored in the local grain elevator—a place that holds grain until its owners are ready to sell.
Today Doug called the grain elevator to get a quote on the price per bushel for corn. He might be quoted $3, $5, or something else. Whatever it is, the price is completely beyond his control to change and is not a matter for argument. With the quote, Doug is left with a take-it-or-leave-it decision: sell all or some of the corn crop, or not sell anything and continue to pay the storage fee.
Doug's take-it-or-leave-it decision rests largely on two factors: how badly he needs the money, and where he thinks corn prices are heading. Most importantly, there are bills to be paid that can limit Doug's ability to hold out for higher prices. Planting and growing corn requires substantial outlays for seed, chemicals, production equipment, and perhaps an irrigation system. Then there are family expenditures: college tuition, home heating, a mortgage, groceries, and everything else. When bills need to be paid, crops might need to be sold.
The question of where corn prices are headed is not easy to assess. While corn and other grain prices change frequently over the course of a single day, Doug is likely evaluating where they will be in a week, a month, or more. How much higher or lower will they go? Doug can check out some data about corn on the Chicago Board of Trade—the grain markets' equivalent of the New York Stock Exchange—but this will not lead him to clear and precise answers about direction.
For one thing, weather is unpredictable. Good weather can lead to high yields on crops, which will increase supply and drive corn prices down. Bad weather such as heavy rains and flooding can reduce supply and drive corn prices up. This is further complicated by the time of the year in which Doug is trying to make a decision. Is it immediately after harvest, when many farmers need to sell crops for the money? Is it February in the year following the harvest, when a new crop is about to be planted? The weather complications make us understand why the Old Farmers' Almanac, with its weather predictions, has been a necessity in a farm family's home.
There are other price-influencing factors beyond Doug's control. The market for grains is clearly international, causing the price to be influenced by what is produced elsewhere in the world. A bumper crop in Brazil can have a huge impact on farmers in central Illinois.
And then there is the whole debate surrounding ethanol. Certainly the prospect of converting corn into fuel has helped to increase prices. But with questions raised about the amount of water required to make ethanol and other issues, what will happen in the market for corn and its price in the future?
Here is the simple fact. While a farmer has no control over the prices for a crop, there are still many price-related decisions to be made. And there just might be more concern over prices in a purely competitive market than in other markets, where businesses can better influence the prices they get.
Notice that point A is the lowest point on the firm's long-run average total cost curve. This means that the firm is producing at the lowest possible cost per unit of output in the long run, or is operating at the most efficient level of output. Efficient production is an important goal for an economy because of the basic problem of scarcity.
Efficient Production
A good or service is produced at the lowest cost possible.
Notice also that at point A price equals average total cost, causing the seller to earn only normal and no excess profit. Also, the $3 price is the lowest price at which the firm can sell and still remain in business. Any price less than $3 would be less than the firm's long-run average total cost, causing it to go out of business.
So, in the long run in pure competition
- the cost of production is as low as it can possibly be so firms are operating efficiently;
- the price of the product is as low as it can possibly be; and
- the consumer pays no economic profit.
FIGURE 13.5 Long-Run Position of a Purely Competitive Seller
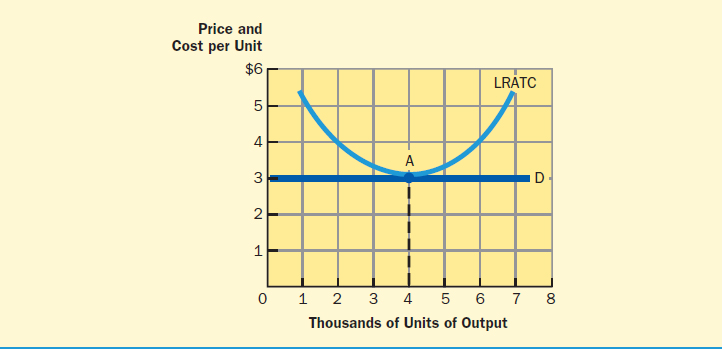
In the long run, a purely competitive seller operates where price equals minimum average total cost, which allows just a normal profit.
Why does this long-run condition occur in pure competition? Easy entry into and exit from the market are the basis for the position of the purely competitive firm in the long run. When firms in a purely competitive market earn excess profits, potential sellers recognize the opportunity to also earn such profits and, because of easy entry, come into the market. As additional sellers enter the market, the market supply increases, causing the equilibrium market price to fall. As the equilibrium price falls, each individual seller's excess profit begins to disappear. This process of entry and reduction in both the market price and excess profit continues until sellers operate where price equals minimum long-run average total cost, or with just a normal profit.
The mechanics of this process are illustrated in Figure 13.6. With market price P1 and the individual firm's demand curve D1 (right-hand graph), the firm is making an economic profit because its long-run average total cost curve lies below D1. As other firms attracted by this economic profit enter the market, the market supply curve (left-hand graph) increases from S1 to S2, market price falls to P2, and the individual seller's demand curve falls to D2, which allows no economic profit.
If firms are losing money and experiencing less than normal profits, some sellers will close their operations and leave the market. As sellers leave, the market supply decreases, causing the equilibrium price to increase. As the price increases, the losses to remaining sellers get smaller and smaller. This process continues until, again, price equals minimum long-run average total cost.
Figure 13.7 illustrates the effect on an individual firm of an exodus of other firms from the market. At market price P1, the individual firm is operating at a loss because the cost of producing each unit is greater than the price. As firms leave the market, the market supply curve shifts to the left, from S1 to S2, causing market price and the individual firm's demand curve to rise. When the price rises to P2, the firm is just breaking even and earning a normal profit.
The description of precise movements toward the long run in pure competition should be tempered to reflect reality. These graphs and the explanation of how entry and exit affect the long run give us a way to think about where purely competitive markets move with time. To assume that all firms in a purely competitive market are exactly alike, have the same cost curves, and march together in lock step doesn't paint a picture of reality. In short, this model, like others, gives us a framework within which to think about patterns of behavior, given some basic assumptions.
FIGURE 13.6 Effect of Entry of Sellers into a Purely Competitive Market
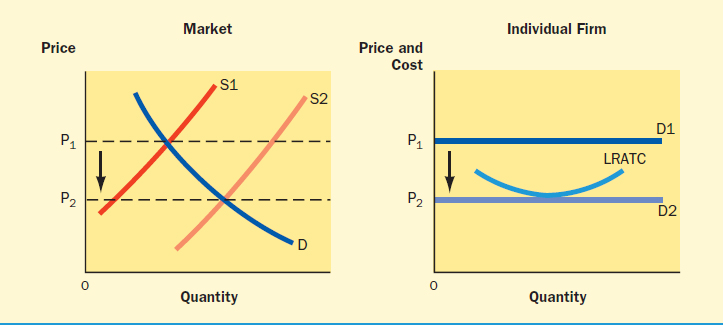
When individual firms in pure competition make an economic profit, new firms are attracted to the market in the long run, causing market supply to increase and equilibrium price to fall. Eventually, the price that each firm receives is equal to the firm's minimum long-run average total cost.
FIGURE 13.7 Effect of Exit of Sellers from a Purely Competitive Market
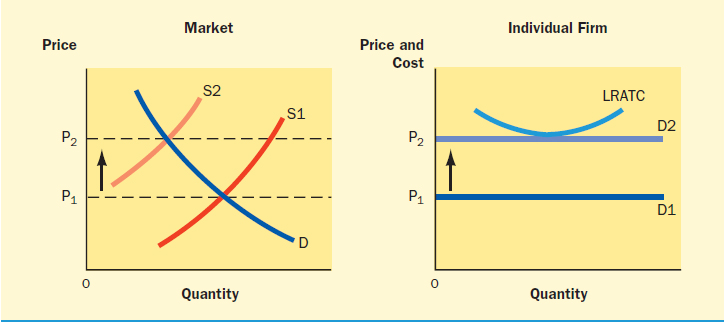
When individual firms in pure competition operate with a loss, some drop out of the market in the long run, causing market supply to decrease and equilibrium price to rise. Price will increase until it equals the minimum long-run average total cost of the remaining firms.
Is There Pure Competition?
The extent to which pure competition is found in the real world is open for discussion. The markets for grain and other agricultural products are generally regarded to be close examples of pure competition because these markets have large numbers of independent sellers supplying identical products. However, several factors need to be considered in labeling them as purely competitive. For one, various loan, income support, and other assistance programs have been created and are administered by the U.S. Department of Agriculture. These programs influence prices and output decisions, and alter the free operation of supply and demand.
There is also the question of entry into and exit from agricultural markets. Substantial outlays for land, equipment, seed, fertilizer, and other factors may be barriers to entry to anything other than small-scale farming. In some instances, large-scale, efficient operation requires expensive capital for harvesting grain or caring for livestock. (Recall Application 12.3, which dealt with precision agriculture.) Exit from farming can also be difficult; the land or its location may not be well suited for an alternative use, and tax laws may make it difficult to sell a farm or pass it on to other family members. However, once in farming, there may be an opportunity to switch crops. When corn prices constantly rise, a farmer might plant more corn and fewer other crops such as soybeans.
With considerations such as these, of what value is the study of pure competition? Despite these issues, the purely competitive model does help us better understand the behavior of firms in certain markets. It also provides an ideal against which all real-world markets can be judged. In this regard, pure competition is like human health. There may be no perfectly healthy person, just as there may be no purely competitive market. But we cannot understand the extent of illness or good health without having the ideal of perfect health for comparison. And we cannot understand the extent to which markets are working well or poorly without the ideal of pure competition for comparison.
MONOPOLISTIC COMPETITION
Characteristics of Monopolistic Competition
The market structure closest to pure competition, and where we can find many real-world examples, is monopolistic competition. A monopolistically competitive market has
Monopolistic Competition
Market structure characterized by a large number of sellers with differentiated outputs and fairly easy entry and exit.
- a large number of sellers—not as many as in pure competition, but a large number nonetheless;
- differentiated products—buyers can distinguish among the products of different sellers; and
Differentiated Products
Products of competing firms are different and recognized as such by buyers. - fairly easy entry into and exit from the market.
We frequently find ourselves as buyers in monopolistically competitive markets: coffee shops, restaurants, mall clothing stores, and other retailers where a large number of small shops compete with one another. In these markets each seller's product is somewhat different: It might be location, parking, service, image, or a variety of other things. Think about your local coffee shops, where the quality of the coffee used to make a latte, or even the crowd that frequents the shop, differentiates one place from another. It is relatively easy to open a small store or shop. A place can be leased; no highly trained workers are needed; and there are minimal capital equipment requirements. The small cupcake shops that are springing up all over the country exemplify these characteristics.
Another slightly different example of a monopolistically competitive market is the labor market for college graduates in a particular major, such as communications. Each year a large number of communications majors graduates from colleges and universities. Each of these graduates is unique in terms of grades, background, experience, courses completed, college attended, and initiative. Entry into this market is relatively easy: The major expenditure is the cost of a college degree.
Behavior of a Firm in Monopolistic Competition
Because of differences in the characteristics of monopolistically competitive and purely competitive markets, there are differences in the behavior of firms in these structures. Notably, unlike pure competitors, monopolistic competitors have some control over the prices they receive for their products, and they engage in nonprice competition.
Control over Price With a large number of firms selling identical products, the individual purely competitive firm has no control over the price it can get for its product. In monopolistic competition there is also a large number of sellers, but because the sellers' products are differentiated, buyers do not view the product of one seller as a perfect substitute for the product of another. For this reason, when a monopolistically competitive firm raises its price, it will lose some, but not all, of its buyers. Some buyers will continue to purchase the product from the firm at a higher price because they see the firm's product as different from and preferable to those of its competitors. Thus, product differentiation allows a firm to carve out a little niche of its own within the larger market.
However, even with product differentiation there is a limit to the amount of control a monopolistically competitive seller has over price. Since many other firms produce similar products, a firm that raises its price too much risks losing many of its buyers. Some buyers may be willing to pay a little extra for better service or a distinctive style, but if they have to pay a lot more, the alternatives become more attractive. For example, you and your friends may continue to eat lunch at a favorite restaurant even if it raises its prices somewhat. However, if the prices are raised too high, you may go somewhere else.
In short, a business selling in a monopolistically competitive market is in an interesting position: It has some control over price because of its ability to differentiate its product, but that control is limited by the presence of many other firms selling similar products.
Demand for an Individual Firm's Product Because of product differentiation, the demand curve faced by an individual monopolistic competitor is downward sloping, like that in Figure 13.8.4 This demand curve shows that if the firm raises its price, it will lose some, but not all, of its buyers. For example, in Figure 13.8, when the seller raises the price from $2.50 to $3.00, the quantity demanded falls from 500 to 200 units, not from 500 units to zero as would happen if the seller were a pure competitor.5
Pricing, Profit, and Loss Just like other firms, the profit or loss position of a seller in a monopolistically competitive market can be determined by comparing the demand curve and average total cost curve for its product. If the average total cost curve lies below the demand curve, or the cost per unit of output is less than the price, an economic profit is earned. This is shown in Figure 13.9a. If the average total cost curve is above the demand curve, or the cost per unit of output is greater than the price, a loss occurs. This is shown in Figure 13.9b.
FIGURE 13.8 Demand Curve for the Output of a Monopolistically Competitive Seller

Because of product differentiation, a seller in monopolistic competition will lose some, but not all, of its buyers if it raises its price.
Nonprice Competition Obviously, sellers in monopolistically competitive markets can compete with one another for buyers by lowering prices. But because their products are differentiated, rivalry through nonprice competition is also an option.
Nonprice competition takes all kinds of forms: packaging, parking, facility ambiance, service, location, quality, selection, and guarantees to name a few. A cafe, for example, can attract customers because of its reputation for outstanding soups and sandwiches, hours open, access to parking, or consistent quality service. Think about the places you frequent for coffee, lunch, or to get together with friends. What are the nonprice reasons for supporting these places?
We can gauge the importance of nonprice competition by simply noticing how much advertising is based on nonprice factors. Notice how infrequently advertisements in magazines, on television, or on the Internet stress price as the selling feature.
Business firms are attracted to nonprice competition for two reasons. First, it provides a way for a firm to increase the demand for its product. By increasing buyer interest through service, packaging, and other features, a firm can shift the demand curve for its product to the right—thereby selling more at each price. Second, by highlighting differences and playing down similarities, nonprice competition helps an individual firm make its product appear unique. As this occurs, the seller becomes less sensitive to the presence of rivals. Uniqueness allows a seller to raise prices without losing as many buyers as would otherwise be the case.
FIGURE 13.9 A Monopolistically Competitive Seller Operating with an Economic Profit or a Loss

Economic profit is earned when the price of a product is greater than its average total cost, or the demand curve is above the average total cost curve. A loss occurs when price is less than average total cost, or the demand curve is below the average total cost curve.
Controversy exists over how much nonprice competition is appropriate. Some people argue that nonprice competition raises the cost of doing business and, therefore, brings higher prices for consumers. Others think that nonprice competition benefits consumers with variety and better quality. Up for Debate, “Does Nonprice Competition Waste Resources?,” adds an additional twist to this controversy by looking at its potential impact on sustainability of the world's resources.
Long-Run Costs, Profit, and Efficiency Over the long run, sellers in monopolistically competitive markets earn only normal profits, just like firms in purely competitive markets. This occurs because, like purely competitive markets, monopolistically competitive markets are easy to enter and exit. Easy entry and exit causes the long-run position of a monopolistically competitive seller to look like that in Figure 13.10. The seller in Figure 13.10 can earn a normal profit by selling 500 units of output at $2.50 each. At any smaller or larger output, the long-run average total cost curve is above the demand curve, causing the firm to operate at a loss.
If sellers are earning economic, or excess, profit (like the firm shown in Figure 13.9a), new sellers enter the market and take some demand away from the existing sellers. This causes the demand curves of the existing sellers to shift to the left until they reach a position like that shown in Figure 13.10, where economic profit is competed away and only normal profit remains. If sellers are sustaining losses (like the firm shown in Figure 13.9b), sellers leave the market, causing the demand curves of the remaining sellers to shift to the right until they reach a position like that shown in Figure 13.10, and the remaining firms operate at a normal profit.
While purely competitive and monopolistically competitive sellers both earn only a normal profit over the long run, the two types of sellers differ in an important way. A firm in a purely competitive market operates at minimum average total cost in the long run and is, therefore, efficient, whereas a firm in a monopolistically competitive market does not operate at minimum average total cost and is, therefore, not as efficient. For the firm in Figure 13.10, the long-run price and per unit cost are $2.50. If the firm were a pure competitor, its price and per unit cost would be about $2.35—the minimum point on the long-run average total cost curve.
UP FOR DEBATE
 DOES NONPRICE COMPETITION WASTE RESOURCES?
Today there is great concern for the sustainability of our world in a time of diminishing nonrenewable resources as well as the inability to keep renewable resources growing at a pace that matches their use. With this concern comes an important question: Does nonprice competition have an impact on sustainability by wasting resources?
Yes There is just one answer to this question, and it is a loud and clear yes. There are several features that come with nonprice competition that certainly foster a waste of our resources.
Consider packaging. One of the popular ways in which producers distinguish their products is through packaging. Think about all of the cardboard boxes, many larger than they need to be, with their ads and colors that induce us to buy so many things housed in them—from toothpaste to cake mix to shoes. Not to mention the cardboard in which they are shipped. Then there are individually wrapped items: For example, today there are ever-increasing numbers of snack foods packaged separately in 100-calorie snack bags. And, there are water bottles and large, hard plastic shells with tiny items inside and detergent bottles, to name just a few. Can't we package in a way that requires fewer resources?
Another nonprice competitive feature is parking. Businesses like to have parking close by for their patrons, which can result in more paved surfaces. Increased impervious surfaces affect water runoff and the return of this important resource to the ground.
Finally, there is the expenditure of money for developing marketing strategies that focus on nonprice competition to increase sales. Wouldn't we be better off putting these funds into expenditures that focus on sustainability practices?
No Nonprice competition leads to better products and increases the standard of living for consumers. It better satisfies buyers through closer attention to their wants and needs. Just because resources are diverted to buyer satisfaction is no reason to believe that they are “wasted.”
One just needs to think about the areas in which nonprice competition has resulted in better products. Consider food. Today there is a greater abundance of choices, new and different products, and better quality. For example, a cup of good coffee, not just thick-brewed percolator java, is now an essential in many daily lives. Individual foil-wrapped tea bags, small bite-sized candy, and individual pouches of cat and dog food make life better. Even the 100-calorie snack bags have helped countless people keep their weight under control and fight an obesity problem. Plus, so many of these boxes, bottles, and bags can be recycled.
Nonprice competition has made many products more convenient and safer. With durable, small packages and bottled water and soft drinks, life is much easier for the average person to negotiate. And, safety has been increased. The hard shell that encases many products, including medications, ensures a tamper-proof product. Finally, wouldn't it be a really dull world without nonprice competition and the features it brings?
It is impossible for a monopolistic competitor to operate in the long run with price equal to minimum long-run average total cost because of product differentiation, which results in a downward-sloping demand curve. This difference gives rise to a criticism of monopolistic competition: Even though price equals long-run average total cost and the firm is earning only a normal profit, the cost and price are higher than they would be in pure competition, and some efficiency is sacrificed.
OLIGOPOLY
Oligopoly is further removed from pure competition than is monopolistic competition. In fact, it is so far removed that it makes more sense to discuss how oligopoly and pure competition differ than to discuss what they have in common. While pure competition may be the ideal market structure, oligopoly is the dominant market structure in the U.S. economy. More business is transacted in oligopolistic markets than in any of the three other market structures.
FIGURE 13.10 Long-Run Position of a Monopolistically Competitive Seller

A monopolistically competitive seller earns no excess profit over the long run and operates at a long-run average total cost that is greater than the minimum.
Characteristics of Oligopoly
In an oligopoly,
Oligopoly
A market dominated by a few large sellers; products are differentiated or identical; entry into the market is difficult.
- the market is dominated by a few large sellers, but there may also be small fringe sellers in the market;
- the products of the sellers may be differentiated or identical; and
- entry of firms into the market is quite difficult because of barriers to entry such as the financing needed to enter the market or the large size needed to compete.
The cell phone service market is a good example of an oligopoly with differentiated products. At the time of this writing, there were several large providers—Verizon, Sprint, and AT&T—with a variety of smaller providers such as Boost and Cricket. The services of these companies are differentiated by plans that range from measured minutes to unlimited voice and text, the availability of free phones, and even weekend and night start times. In the markets for some basic metals like aluminum, there are a few large firms that dominate the market. These products, like aluminum ingot, tend to be undifferentiated and the product of one seller is like another. In the cases of cell phone providers and basic metals, new entrants to the market would require substantial money to rival the big firms.6
Examples of oligopoly are everywhere. Notice how few firms are in the market when you shop for a car, or a computer, or even breakfast cereal. You can find oligopolies in the markets for light bulbs, gasoline, credit cards, commercial television broadcasting, and even soap and toothpaste.
Behavior of a Firm in an Oligopolistic Market
Control over Price With few sellers in an oligopoly, each of the dominant firms has a large share of the market. A large market share allows the firm some control over its price—more so than a monopolistic competitor who also has some control because of a differentiated product but faces a large number of rivals.
Having just a few competing sellers introduces an interesting twist to oligopoly that has an important effect on a firm's behavior. With so few rivals, the price, output, advertising, and other policies of one firm can have a significant impact on the other firms in the market, causing, in turn, those other firms to react. For example, if one automobile company offers zero or low interest rates for financing its cars, it may affect the sales of the other automobile companies in the market. These firms may in turn be “forced” to offer their own financing deals or follow other policies that will be detrimental to the sales of the company that initially offered the cheap financing. If a credit card company offers reward points for merchandise or air travel, this may reduce the use of competing credit cards, causing those companies to respond with programs of their own.
In the oligopolistic market structure, sellers are constantly watching and weighing the actions and reactions of their competitors. This phenomenon is called mutual interdependence. Because of mutual interdependence, sellers must consider not only the effects of their pricing and other policies on buyers, but the effects on their rivals and their rivals' reactions as well. Mutual interdependence is unique to oligopoly.
Mutual Interdependence
So few sellers exist in the market that each seller weighs the actions and reactions of rivals in its decision making.
Price of an Individual Firm's Product Because mutual interdependence is manifested in so many different ways, there is no single explanation for oligopoly pricing. Rather, several theories have been developed to accommodate different types of interdependence. Two of the best-known theories are leadership pricing and the kinked demand curve model.
Leadership pricing occurs when one firm in a market sets a price that is then adopted by other sellers. The firm that sets the price is called the price leader, and the firms that respond are the followers. Leadership pricing is not uncommon: Often firms in markets such as commercial airlines and banking follow suit when a price change is announced by one of their competitors. The price changes by the followers often come within a few hours or days after the leader's announcement.
Leadership Pricing
One firm in a market sets a price that the other firms in the market then adopt.
A seller may emerge as price leader for several reasons. It could be the largest firm in its market, causing rivals to choose to adopt its price rather than attack it head on and face a possible price war. A price leader might also be the firm that is more sensitive than its rivals to changing market conditions: When the other firms see the leader change its price, they can expect that changing conditions will soon force them to change their prices as well. Banks, for example, experience the same changes in money market conditions, causing a price leadership pattern to emerge with regard to interest rates. Sometimes price leadership is the result of tradition and expectations. Firms respond to a particular seller's price changes because over the years this has become the traditional pattern in the market and firms expect that pattern to continue.
The second theory, the kinked demand curve model, is based on the assumption that rivals do not follow a seller's price increases but do follow its price decreases. The theory gets its name from the unusual shape of the individual oligopolist's demand curve under this assumption. A kinked demand curve is illustrated in Figure 13.11.
Kinked Demand Curve
Assumes that rivals will not follow price increases but will follow price decreases; illustrates that as a seller's price rises, the amount of its product demanded decreases substantially, but as its price falls, the amount demanded increases only slightly.
FIGURE 13.11 Kinked Demand Curve for the Output of an Oligopolist

The kinked demand curve of an oligopolist is based on the assumption that the firm's rivals will follow a price decrease but not a price increase.
The price currently charged and the corresponding output sold by the firm are shown at the kink, or bend, in the demand curve. For the firm in Figure 13.11, the current price is $3 and sales are 400,000 units. If the firm raises its price above $3, and its rivals do not follow, it stands to lose a large number of buyers to those other sellers. For example, when it increases its price from $3 to $4, its sales fall by 200,000 units, from 400,000 to 200,000. But, when the firm lowers its price from $3 to $2, its sales increase by only 50,000 units, to 450,000. This is because, when a seller's price is lowered, the seller's rivals also cut their prices to avoid losing buyers. With everyone's price lower, some buyers may be attracted to the market, but there is no reason for many existing buyers to switch to the seller that initiated the price cut.
Thus, the relatively flat portion of the kinked demand curve above the current price shows that a firm increasing its price stands to lose a large number of sales if its rivals do not follow its lead. The steep portion of the curve below the current price illustrates that, with rivals following price cuts, sales increase only slightly. The conclusion to be drawn from this model is that prices are relatively stable in this type of oligopoly market because the fear of rivals' reactions gives little or no incentive to either raise or lower price. In other words, there is not much price competition.
Nonprice Competition The degree of nonprice competition found in an oligopoly market depends on the extent to which the products are identical or differentiated. Where competitors sell largely identical products, spending money on product promotion could end up benefiting all firms in the market, rather than just the individual firm that makes the expenditure. On the other hand, a strong promotional campaign emphasizing a seller's product makes sense when the products are clearly differentiable on the basis of quality, style, size, or some other characteristic. Think about all of the beer ads that you have recently seen that want you to buy beer for its taste or its image.
Nonprice competition is important if a seller faces a situation where price cuts do not lead to large increases in sales. In this case, nonprice competition may provide a nice alternative to price competition. However, mutual interdependence also exists with regard to nonprice competition. Watch food companies. They respond quickly to new flavors of ice cream, the introduction of new types of chips and sodium free foods, and the creation of new and different flavors of bottled drinks. Even the fast food restaurants have begun to sell various types of coffee drinks as they react to each other. And, when a textbook publisher offers a web-based tutorial for students in a course, the other publishers do the same.
Long-Run Costs, Profit, and Efficiency Over the long run, purely competitive and monopolistically competitive sellers earn only normal profit: Easy entry allows new firms to come into the market and compete economic profit away. But with oligopoly, entry is not easy. Therefore, oligopolists can continue to earn economic profit over the long run because new sellers cannot readily enter the market.
The ability to earn economic profit over the long run affects the price buyers pay for a product. With pure competition, easy entry ensures that price is equal to long-run average total cost and is as low as possible. But the ability of an oligopolist to earn economic profit means that the firm's price can be greater than its cost. Thus, over the long run, restricted entry may result in economic profit for the firm and in higher prices for the buyer.
Restricted entry may also allow an oligopolist to operate inefficiently over the long run. The greater the difficulty potential rivals face entering a market the less the competitive pressure on a firm, which can weaken its incentive to operate at lowest average total cost. Restrictions, or barriers to entry, are more fully explained in our discussion of monopolies.
MONOPOLY
Characteristics of Monopoly
Of the four market structures, none is further removed from pure competition than is monopoly. In a monopoly market there is
Monopoly
A market with one seller that maintains its position because entry by new sellers is impossible.
- only one seller—the monopolist;
- no need to consider the issue of product differentiation since there is just one seller; and
- no possibility of entry by new sellers.
There are a number of barriers to entry into a monopolized market. Significant economies of scale in the production of a good or service that cause long-run average total cost to fall as output expands can keep out competitors.7 In this case, it may be cheaper and more efficient for one large firm to service the entire market by producing all the output at a lower average total cost than to have several firms each produce smaller amounts of output at a higher average total cost. This situation, called a natural monopoly, will be further discussed in Chapter 14.
Natural Monopoly
It is more efficient (less costly) to have the entire product in a market come from one large producer rather than from several smaller producers.
If a monopoly is a public utility—the only firm providing natural gas, electricity, or some other essential service to a community—entry of a new seller may be blocked by its inability to receive permission to operate from a regulatory authority. For example, a startup electric company cannot provide service in an area unless it obtains a license from the state commission that regulates utilities, and usually just one license is granted in an area.
The ownership of a patent on a product or a process may give a firm monopoly power in a market. In the United States, patents give the patent owner exclusive rights over it for twenty years. Anyone who uses the patented process or produces the patented product without the monopolist's permission can be sued. Patents have given many pharmaceutical companies exclusive rights to particular drugs until the patent expires.
A firm may be a monopolist because it is the sole owner of a factor necessary for production, such as the franchise for a professional sports team in a city. It may also have gained its monopoly position because it engaged in illegal practices involving prices and contracts that keep potential rivals out of the market.
Whether or not a seller is considered to be a monopoly depends on how the market is defined. Some examples could include a company that owns the only pipeline carrying natural gas into a region, the only newspaper in a city, the firm that has the food concessions at an airport or a national park, and the only general store near a campground.
Related to monopoly is an arrangement in which several sellers formally join together with the intention of acting as if they were a single-firm monopoly. The organization they form is called a cartel, and its purpose is to obtain more profit and other benefits for its members than they would receive if they competed with one another. Although the best-known example of a cartel is the Organization of Petroleum Exporting Countries (OPEC), other organizations have also been found to carry out cartel-type activities. For example, the court in Application 13.1 called NCAA control over college football a classic cartel. Cartels are illegal in the United States.8
Cartel
An arrangement whereby sellers formally join together in a market to make decisions as a group on matters such as pricing.
Behavior of a Monopolist
Control over Price Because it is the only seller in its market, there are two important points to consider about a monopolist's pricing. First, all other things being equal, a monopolist has more control over its price than does a firm in any other market structure. There are no direct competitors to take buyers away when a monopolist raises its price. Second, because the monopolist is the only seller in its market, its demand curve is the market demand curve: All buyers demanding the product demand it from the monopolist.
Demand for a Monopolist's Product Since market demand curves are downward sloping, and since the monopolist's demand is identical to the market demand, the monopolist's demand curve is the downward-sloping market demand curve.
Unlike the pure competitor, a price taker who must accept the price dictated by market supply and demand, the monopolist is a price searcher who will assess the costs and revenues from operating at different levels of output, or different points on the demand curve, and select the one price and output combination that maximizes profit. For example, the monopolist facing the demand curve in Figure 13.12 will assess revenues and costs at different levels of output and apply the profit-maximizing rules to find the one price–quantity combination that yields maximum profit. Depending on the behavior of costs, this combination could be shown by point A, B, C, or any other point on the demand curve in Figure 13.12. The appendix at the end of this chapter fully develops revenue and cost information to show how a monopolist locates the profit-maximizing point on its demand curve.
Price Searcher
A firm that searches its downward-sloping demand curve to find the price–output combination that maximizes its profit.
FIGURE 13.12 Demand Curve for the Output of a Monopolist

A monopolist will search its downward-sloping demand curve and choose the one price and output combination that will maximize its profit. The monopolist's demand curve and the market demand curve are the same.
One of the significant features about pricing in a monopoly market structure is that, since the monopolist's demand and the market demand are the same, the monopolist is establishing the price and output level for the whole market. In other words, one firm makes all the supply decisions. In addition, once the monopolist chooses a price, there are no competitors to force it down. The monopolist also has no immediate threat of entry by new firms.
Table 13.1 gives the 2011 Major League Baseball Fan Cost Index for attending major league games in the league ballparks. The Fan Cost Index includes four average price tickets, some food and drinks, parking, programs, and caps (see Table 13.1 for details). If the market is defined as live major league baseball and other forms of sports activities or entertainment are not regarded as substitutes, then buying tickets and spending time at the game could be regarded as participation in a monopoly market.
Nonprice Competition Because monopolists face no direct competitors, they use nonprice competition differently from oligopolists or monopolistic competitors, who use it to attract buyers to a particular brand of a product. For example, in the hybrid market, nonprice competition encourages buyers toward a Ford Escape, Toyota Prius, Chevy Volt, Lexus CT, Hyundai Sonata, or other hybrid. But with monopoly there are no competing brands; there is simply the product. As a result, a monopolist's advertising and other nonprice competition may be designed to make people aware of the good or service itself, not the seller. For example, people are likely aware of the advertising slogan, “A Diamond is Forever,” used since 1947 by De Beers, the company which was the dominant force in the diamond industry for most of the twentieth century. Since De Beers supplied most of the world's diamonds, there was no need to advertise the company—just diamonds.
Long-Run Costs, Profit, and Efficiency The monopolist enjoys its position as sole seller in its market because of barriers to entry that keep potential rivals out. Those same barriers allow the monopolist to make an economic profit over the long run. With barriers to entry blocking new competitors, no seller can come into the market, force the monopoly firm to lower its price, and compete economic profit away. The monopolist can protect its economic profit as long as its monopoly position can be maintained. Also, with no competition, the monopolist can operate inefficiently, or at higher than minimum average cost.
TABLE 13.1 Team Marketing Report's Major League Baseball Fan Cost Index
Buying tickets to a major league baseball game might be considered a purchase in a monopoly market.
| Team | 2011 Fan Cost Indexa |
| Boston Red Sox | $339.01 |
| New York Yankees | 338.32 |
| Chicago Cubs | 305.60 |
| Chicago White Sox | 258.68 |
| New York Mets | 241.74 |
| Philadelphia Phillies | 240.66 |
| Los Angeles Dodgers | 226.36 |
| St. Louis Cardinals | 223.18 |
| Houston Astros | 221.36 |
| Minnesota Twins | 213.16 |
| Toronto Blue Jays | 212.68 |
| San Francisco Giants | 208.15 |
| Detroit Tigers | 207.28 |
| Washington Nationals | 196.34 |
| Seattle Mariners | 183.59 |
| Oakland Athletics | 178.09 |
| Baltimore Orioles | 174.10 |
| Cleveland Indians | 170.96 |
| Florida Marlins | 170.24 |
| Atlanta Braves | 169.02 |
| Cincinnati Reds | 162.24 |
| Colorado Rockies | 161.00 |
| Milwaukee Brewers | 160.40 |
| Kansas City Royals | 159.80 |
| Texas Rangers | 159.40 |
| Tampa Bay Rays | 139.68 |
| Los Angeles Angels | 129.50 |
| Pittsburgh Pirates | 127.71 |
| San Diego Padres | 125.81 |
| Arizona Diamondbacks | 120.96 |
a The Major League Baseball Fan Cost Index includes the price of four average-priced adult tickets, two small draft beers, four small soft drinks, four regular-size hot dogs, parking for one car, two game programs, and two least expensive, adult-size adjustable caps. Premium seating and luxury suites are not included in the average price calculation.
Source: Team Marketing Report, “2011 mlb fan cost index,” www.fancostexperience.com.
However, even with the monopolist's exclusive position in the market, some restraints may exist. Although it faces no direct competition in its own market, the monopolist must be concerned with competition from products in other, closely related markets. A natural gas distributor may have no direct competition from other gas distributors, but in some respects it faces competition from suppliers of other types of energy. For example, a developer of a subdivision of homes may have the choice of installing gas, electric, oil, or solar heat, and homeowners may have the option of converting from one type of heat to another. If the gas company's price gets too far out of line, over the long run, as buyers have the opportunity to move into other markets, it could lose business not to other gas distributors but to companies supplying alternative forms of energy.
APPLICATION 13.3
PATENTS WORK–FOR A WHILE
The names of large pharmaceutical companies in the United States, like Pfizer, Eli Lilly, and GlaxoSmithKline, are as familiar to us as are the names of many of the drugs that they produce. These companies are part of the substantial pharmaceutical industry that provides relief from headaches and pain, helps to reduce anxiety and depression, treats a variety of conditions like heart disease, and prolongs life for people who have serious illnesses.
The large pharmaceuticals (pharms) spend considerable sums of money on the research and development of drugs. In doing so, they typically apply for a patent on a proposed drug, usually when they begin development of it. In the United States, a patent is granted for 20 years; however, by the time a drug is developed and tested and marketed, many of those patent years are used. So when a drug “hits” the market, it may provide the company monopoly protection over the drug for fewer than 20 years. For example, Pfizer's Lipitor hit the market in 1997 and its patent expired in 2011 giving Pfizer a fourteen-year window.
Patent protection sets up a monopoly over a particular drug for its company and becomes a barrier to entry from other sellers. Until it loses that protection and generics come onto the market, the company maintains complete control over the drug's price and availability. This monopoly protection comes with some controversy. Drug firms say that they need to price high enough to cover their costs, fund additional research and development of new products, and provide a profit to their stockholders. Those in opposition to this monopoly position believe that a high price keeps people who need the medication from having access to it. They cite examples of people who do not take needed medications or skimp on dosage because they cannot afford the drugs.
In 2011 and 2012, several well-known, highly prescribed drugs that were major sellers for their pharmaceutical companies went off patent coverage: cholesterol busting Lipitor, the antipsychotic Zyprexa, asthma fighting Advair, and the antibiotic Levaquin to name a few. An upstate New York pharmacy officer for a major insurance company said, “My estimation is at least 15 percent of the population is currently using one of the drugs whose patents will expire in 2011 or 2012.”
When generics enter the market, the monopoly position of a large pharm's drug is gone and the price seriously declines. Generics are said to cost 20 to 80 percent less than name brands: There is no cost for development and marketing, and frequently the drug is produced in another country where the costs of production are lower. How do generics impact the pharmaceutical that loses its patent?
Take Lipitor, which has been the most prescribed name-brand drug in the United States, said to have earned Pfizer $81 billion dollars. It was anticipated that its generic, atorvastatin, when it became available in November 2011, would cause Pfizer to lose a substantial share of that market. However, rather than handing the market over to a generic, Pfizer went on a campaign to keep its users, including a lowering of the price of Lipitor to compete with the generic.
It will be interesting to watch the reaction by the big pharms to the major drugs going generic in 2011 and 2012. For those who study the market structures, it is watching the result of a transformation of a monopoly market to one of the other structures. Perhaps like Pfizer and Lipitor, it may not be a total exit from the market but entry into one with competition.
Sources: “Drug prices will fall sharply as patents expire,” http://articles.boston.com/2011-07-25; Lisa Zamosky, “Lipitor patent ends; generic available: What now?” Los Angeles Times, http://articles.latimes.com/print/2012, “6 Drug companies With Expiring Patents in 2011,” www.investopedia.com, 3/19/2012.
The monopolist is also restrained in its profit-making ability when it is a public utility. With public utilities, state regulatory commissions or other public authorities oversee the prices they charge. For example, privately held water companies are subject to rates and standards set by a state commission. Typically, prices are set in such a way that the utility's ability to earn excess profit is limited.
Application 13.3, “Patents Work—for a While,” discusses the coming changes in the monopoly markets for certain drugs as their patents expire. How do you think the large pharmaceutical companies plan for this sudden loss in a monopoly position?
MARKET STRUCTURES, THE CONSUMER, AND EFFICIENCY
Let's review what we have learned about competition and the behavior of a business in a market. We are particularly concerned with the effects on consumers of buying from sellers in each of the four market structures and the levels of efficiency achieved by firms in these structures.
Buyers fare best when facing purely competitive sellers because the market, not the individual seller, determines the price. In the long run, price is equal to average total cost and average total cost is as low as possible. This means that over the long run, no economic profit goes to sellers (again, no more profit than is necessary for production to continue), consumers get the good or service at the lowest possible price, and these firms operate efficiently.
In monopolistic competition, price is again equal to average total cost in the long run. But because the demand curve for an individual seller's product is downward sloping, the long-run average total cost of the product is not at its lowest possible level. Thus, even though buyers pay no economic profit to the seller, they do not get the good or service at the minimum possible cost. Since firms do not operate at their lowest average total costs, they are less efficient than purely competitive firms. But, in this structure, consumers enjoy a differentiation in products among sellers.
TABLE 13.2 Characteristics and Behavior of Firms in Each of the Four Market Structures
Consumers fare best in purely competitive markets: Sellers have no control over price, and over the long run, average total cost and price are as low as they can get and sellers earn no economic profit.
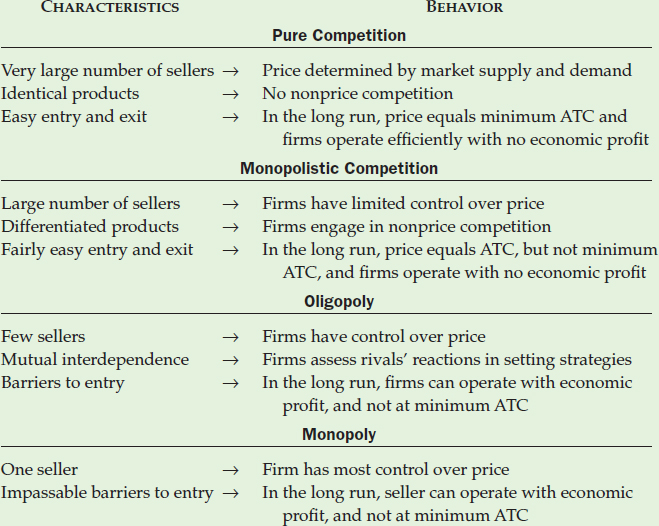
In oligopoly and monopoly, the price of a product can remain above its average total cost over the long run; that is, in these market structures the prices buyers pay may regularly include an economic profit to the seller. These market structures may also lack the forces that cause firms to produce as efficiently as possible. Because of these and other manifestations of the market power of oligopolists and monopolists, the government has taken steps from time to time to modify their behaviors. Some of those measures are taken up in Chapter 14. Table 13.2 summarizes the characteristics and resulting behaviors of firms in each of the four market structures.
Summary
- A market is composed of firms selling similar products and competing for the same group of buyers. The boundaries of a market are determined by product substitutability and geographic considerations.
- The degree of competition in a market influences a firm's pricing and nonprice policies as well as its ability to earn economic profit in the long run. To analyze competition and its effects, markets can be classified into four structures: pure competition, monopolistic competition, oligopoly, and monopoly.
- Pure competition is characterized by a large number of independent firms selling identical products in a market that is easy to enter and exit. Individual purely competitive firms have no control over price, which is set by the forces of supply and demand in the market. An individual firm's demand curve is a straight, horizontal line at the market price, indicating that the firm can sell as much as it wants at that price but nothing at a higher price. Nonprice competition doesn't occur in purely competitive markets since sellers' products are identical.
- Due to easy entry and exit, in the long run a purely competitive seller's price is equal to minimum long-run average total cost. This results in efficient production, the lowest possible price that can be charged in the market, and no economic profit for the firm. From the buyer's point of view this makes pure competition the ideal market structure. In the real world, there are few purely competitive markets.
- Monopolistic competition is characterized by a large number of sellers with differentiated products in a market that is fairly easy to enter and exit. Because of product differentiation, each seller has a downward-sloping demand curve and exercises some control over its price. This control, however, is limited by the large number of sellers offering buyers similar products. Nonprice competition through packaging, location, and other methods is important in these markets.
- Since entry into and exit from the market are fairly easy, over the long run monopolistic competitors operate where price equals long-run average total cost, resulting in no economic profits. However, these firms do not produce at the lowest point on their long-run average total cost curves, so their prices and costs are higher, and the firms are less efficient, than if they were pure competitors.
- Oligopoly is characterized by a few sellers producing identical or differentiated products in a market that is difficult to enter. By virtue of their relatively large size in the market, oligopolists have some control over their prices. But large size also causes the competitive decisions of one firm to affect other firms in its market, giving rise to mutual interdependence among the sellers.
- Since mutual interdependence can assume different forms, there are several explanations for oligopoly pricing. Two popular explanations are leadership pricing, which occurs when one firm changes its price and others follow, and the kinked demand curve model, which is based on the assumption that rivals follow a firm's price decreases but not price increases. With the entry of potential rivals into the market impeded, oligopolists may be able to charge prices greater than average total cost, earn economic profits over the long run, and not operate efficiently.
- Monopoly is characterized by a single seller facing no direct competition in a market that is impossible to enter. All other things being equal, a monopolist has more control over its price than does a firm in any other market structure. Since it is the only seller in its market, the market demand curve is the monopolist's demand curve, and the monopolist searches for the one price and output combination on the demand curve that maximizes its profit. With the entry of new rivals blocked, the monopolist can charge a price greater than its average total cost, earn economic profit over the long run, and not operate efficiently.
Key Terms and Concepts
Market structures
Industry
Market
Geographic boundary of a market
Product boundary of a market
Purely competitive market
Barriers to entry
Price taker
Market demand curve
Individual firm's demand curve
Economic profit, loss, or breaking even
Nonprice competition
Efficient production
Monopolistic competition
Differentiated products
Oligopoly
Mutual interdependence
Leadership pricing
Kinked demand curve
Monopoly
Natural monopoly
Cartel
Price searcher
Review Questions
- Into which of the four market structures would you place each of the following? Why would you make this classification?
- A small organic farm growing herbs, arugula, and tomatoes on 5 acres
- A large grain farm producing wheat on 2,500 acres
- A major airline
- A community college
- The water company for a region
- A small retail shoe store in a large mall
- A big box discount shoe store in a large city
- A college food service
- The only long-term parking facility at an airport
- Passenger travel on Amtrak
- The best bakery in town
- The local small town newspaper
- A coffee shop that sells a well-known global brand
- How do firms in each of the four market structures differ in terms of their number of rivals, control over price, product differentiation, ability to earn economic profit over the long run, and efficiency?
- What is the relationship between price and average total cost when a firm operates with an economic profit, takes a loss, or breaks even? Illustrate, in the accompanying graphs, the relationship between an individual firm's demand curve and average total cost curve in each of the following situations.
- A purely competitive firm in the long run
- A monopolist earning an economic profit
- A purely competitive firm operating with a loss
- A monopolistically competitive firm in the long run
- A monopolistically competitive firm operating with a loss
- An oligopolist pricing at the kink in its demand curve and earning an economic profit
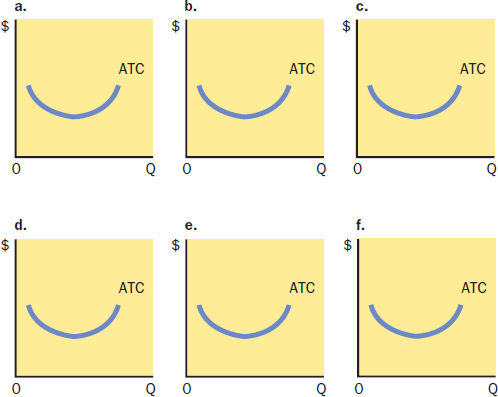
- Explain the process that drives purely competitive firms to operate efficiently, receive a price equal to lowest average cost, and earn no economic profit in the long run.
- Why does a firm in pure competition operate efficiently in the long run while firms in the other three market structures do not? Why is it important to consumers that a firm operate efficiently?
- Monopolistically competitive sellers face downward-sloping demand curves, and pure competitors face perfectly horizontal demand curves. What is the difference in the competitive environments of these two market structures that causes this difference in the behavior of the individual firm's demand curve?
- Identify some important barriers to entry that keep firms out of a market.
- Firms in monopoly and oligopoly markets are protected in varying degrees by barriers to entry, and they can earn excess profits in the long run. How do barriers to entry relate to a firm's ability to earn excess profits in the long run?
- Explain what is meant by mutual interdependence and how it relates to the price leadership and the kinked demand curve models.
- Explain why a monopolist is labeled as a price searcher and not a price taker.
Discussion Questions
- Pure competition is said to be the most competitive of all the market structures. If this is true, why is it that no one firm is concerned with what any other firm does in a purely competitive market?
- You have a friend who thinks the market for automobiles should be changed from oligopolistic to monopolistically competitive by breaking the existing firms into a large number of smaller firms. Do you agree or disagree with your friend's proposal? Why?
- A market is defined according to the geographic area in which sellers compete for buyers and the extent to which buyers view sellers' products as substitutes. What, in your opinion, would be the substitutes and relevant geographic market for each of the following? Be able to defend your answers.
- Beer from a small microbrewery in central Pennsylvania
- A four-door Swedish automobile for sale at a U.S. dealership
- A ski resort in the Rocky Mountains
- A major state university
- Frozen pizza
- Satellite television
- In the United States, people keep increasing their purchases over the Internet. Does this growth in Internet shopping increase competition for retail stores, or are these different markets? Explain your reasoning.
- Why might a seller in an oligopoly market where mutual interdependence and rivals' responses are important choose to increase its sales through an advertising campaign rather than by lowering the price of its product?
- Certain vehicles are basically the same but are marketed under different brand names. The cars, sometimes built on the same assembly lines, may have different standard equipment, styling, accessories, and prices. The Ford Expedition and the Lincoln Navigator, for example, are largely the same. It is understandable why one automobile company would want recognizable differences between its cars and those of a rival, but what does the company gain by creating differences among its own products? What costs and benefits do automobile buyers experience from this differentiation strategy?
- Why are economists so concerned with efficiency? Would the world be a better place to live if all goods and services were produced efficiently and sold in purely competitive markets?
- Identify a monopoly market in which you participate as a buyer. Can you determine any negative effects on you as a buyer that would not occur if there were more competition in that market?
- In economics courses, students learn that there is value in competition in markets and that competition should be encouraged. In some business courses, students learn strategies for reducing competition. What accounts for the difference in the view of competition in these two areas of study?
Critical Thinking Case 13 
THE $800 HAIRCUT
Critical Thinking Skills
Using criteria for grouping
Analyzing the unobvious
Economic Concepts
Market definitions
Market structures
$800 for a haircut? No way!
Well, not so fast. There are stories out there about people paying that much for a haircut. Just go to the Internet and type in $800 haircut, and you might be surprised at the number of hits you get.
It seems unlikely that the average person would pay such an outrageous price for a haircut. Most of us would like to eat a few meals a day, pay the cell phone bill, and put gas in our cars to get to work and the fitness center. But what will people pay for a haircut?
Some folks are willing to “do” the local cheap-cuts hair salon. The $10 special on Thursday is okay and serves the purpose. Others search out the best in the area—which might mean a cool $200 rather than $10. In some places, the cheap joints are on almost every corner; in some places, there are independent hairdressers in malls, storefronts, home basements, and garages; and in some places, there are integrated hair salons and spas.
All of this brings us to market structures and pricing. At first glance, we might think that haircutting is a good example of a monopolistically competitive market. But spending $800, or even $200, for a haircut when you could spend $10 doesn't seem to conform to what people typically think of when describing monopolistic competition.
So what's the story? Are some of these haircutters monopolists? Have they risen so far above the competition and established such a name for themselves that no one can compete with them? If this is the case, can this happen with chefs? With surgeons? With college professors? With any career or profession?
Questions
- In what market structure do haircuts generally belong? Does this differ by location?
- Can a service seemingly in a monopolistically competitive market become so unique that it leaves that market? Could some sellers become oligopolists or monopolists? How do you explain this phenomenon?
- What other markets can you identify that have behaviors similar to the haircut market described in this case?
- Do you think a heart surgeon could ever be a monopolist? Why?
CHAPTER 13 APPENDIX
DETERMINING THE PROFIT-MAXIMIZING PRICE AND OUTPUT FOR THE FIRM IN PURE COMPETITION
Profit-Maximizing Behavior
Since a firm in pure competition can sell as much or as little as it chooses at the going market price, how does it determine what quantity it actually will produce and sell?
Remember that the objective of decision making by a purely competitive firm (or a firm in any market structure) is to choose the output level that will maximize profit. In Chapter 11 we learned that a firm will maximize its profit by operating where the additional cost and the additional revenue from the last unit produced and sold are equal. That is, the firm will maximize profit by operating where marginal cost equals marginal revenue. Consider how this rule applies to a purely competitive firm.
Demand, Revenues, and Costs Table 13A.1 gives price, quantity, and revenue information for a purely competitive grain farmer operating in a market where the equilibrium price is $3 per bushel. The first two columns of the table list the demand schedule for the farmer's grain, which shows that regardless of how much is demanded—be it 3, 1,003, or 8,003 bushels—the farmer receives a price of $3 per bushel. Total revenue, given in the third column, is calculated by multiplying price times quantity demanded at each level of demand. Total revenue with a demand of 3 bushels is $9; with 1,003 bushels it is $3 × 1,003 = $3,009; and so on.
Marginal revenue is the change in total revenue as one more unit of a product (bushel of grain in this example) is demanded. The marginal revenue figures in Table 13A.1 indicate that no matter how much or how little is demanded, the next bushel demanded always adds $3 to the farmer's total revenue. Because $3 is the price at which the farmer can sell each bushel of grain, it can be concluded that in pure competition the firm's marginal revenue is equal to its price.
When graphed, marginal revenue is a straight, horizontal line at the equilibrium market price of $3 per bushel. In other words, in pure competition the individual seller's marginal revenue curve is identical to its demand curve. This is shown in Figure 13A.1 by the line D = MR which illustrates the demand and marginal revenue data for the grain farmer in Table 13A.1.
The marginal cost for a purely competitive seller behaves like the typical marginal cost curve discussed in Chapter 12. Graphically, it is “fishhook” shaped: As output increases, it decreases to a minimum and then increases. The marginal cost for this pure competitor is also illustrated in Figure 13A.1.
Determining the Profit-Maximizing Output The profit-maximizing output for a firm can be found by examining its marginal cost and marginal revenue curves, as is done in Figure 13A.1. To maximize its profit, a firm should produce where its marginal cost curve intersects its marginal revenue curve. This occurs in Figure 13A.1 at point A. Reading down from point A to the horizontal axis, we can see that the profit-maximizing output is 6,000 bushels of grain.
TABLE 13A.1 Price, Quantity, and Revenue Information for a Purely Competitive Seller
Because a seller in pure competition receives the same price for its product regardless of the quantity demanded, the seller's marginal revenue is always equal to the price.

An additional note about profit-maximizing behavior is necessary. Up to this point, the marginal cost equals marginal revenue rule has been presented as a guide to lead the firm to maximum profit. But what if a firm is operating at a loss? What if, at every level of output, its costs are greater than its revenues? Here again the marginal cost equals marginal revenue rule leads to the “best” (where best means “least bad”) output level.
When a firm is producing at the output where marginal cost equals marginal revenue, it is operating at the strongest net revenue position it can reach. When revenue is greater than costs, this leads to maximum profit, but when revenue falls short of costs, this leads to minimum loss. So, whether a firm is trying to maximize its profit or minimize its loss, the decision-making rule is the same: Operate where marginal cost equals marginal revenue.
We can determine whether a firm is maximizing its profit or minimizing its loss by measuring whether the cost of producing each unit of output is less or more than its price at the best level of output. Graphically, this is indicated by whether the average total cost curve lies below or above the demand curve at the output level where marginal cost equals marginal revenue. Figure 13A.2a shows a grain farmer operating with maximum economic profit where marginal cost equals marginal revenue. At the profit-maximizing output of 6,000 bushels, the price is $3 per bushel, and the average total cost is $2 per bushel. In this case the farmer is earning an economic profit of $1 per bushel, or $6,000 in total economic profit.
FIGURE 13A.1 Profit-Maximizing Output for a Purely Competitive Seller
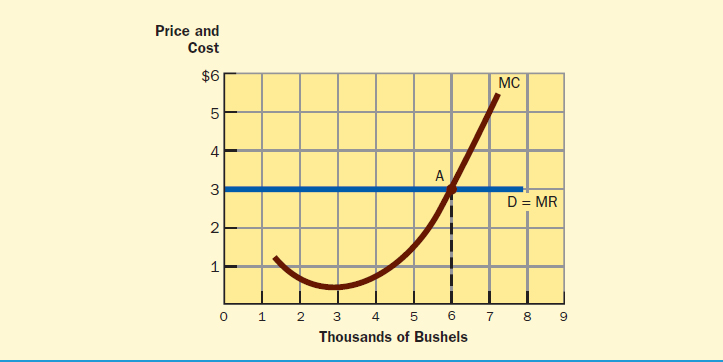
Graphically, a purely competitive seller's marginal revenue curve is identical to its demand curve. Profit is maximized or loss is minimized by operating at the output level where marginal revenue equals marginal cost.
Figure 13A.2b shows a grain farmer minimizing a loss by operating where marginal cost equals marginal revenue. At the loss-minimizing output of 6,000 bushels, the cost per bushel is $4 and the price received is $3. The farmer is taking a loss of $1 per bushel, or a total loss of $6,000.
FIGURE 13A.2 A Purely Competitive Seller Maximizing Profit or Minimizing Loss
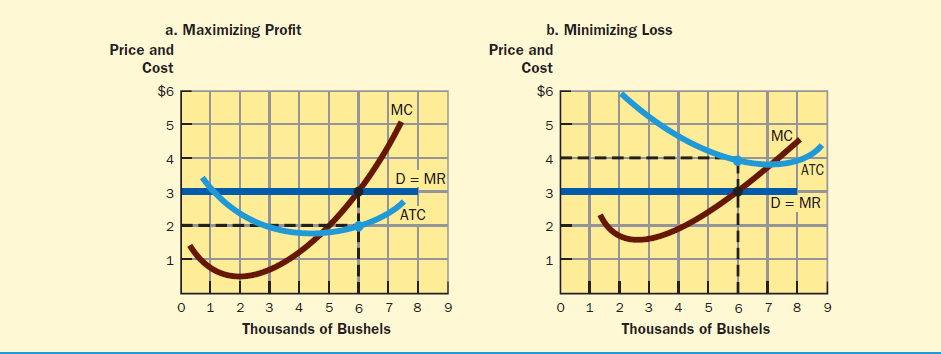
If a purely competitive seller's demand curve is above its average total cost curve, it will maximize profit by operating at the output level where marginal revenue equals marginal cost. If its demand curve is below its average total cost curve, it will minimize its loss by operating at the output level where marginal revenue equals marginal cost. Profit or loss per unit is the difference between price and average total cost.
In summary, economic profit is maximized if cost per unit is less than price, or if the average total cost curve lies below the demand curve, at the output where marginal cost equals marginal revenue. A minimum loss is incurred if cost per unit is greater than price, or if the average total cost curve is above the demand curve, at the output where marginal cost equals marginal revenue.1
DETERMINING THE PROFIT-MAXIMIZING PRICE AND OUTPUT FOR THE FIRM WITH A DOWNWARD-SLOPING DEMAND CURVE
Profit-Maximizing Behavior
If a firm faces a downward-sloping demand curve, such as a monopolist or monopolistic competitor faces, at what price–output combination, or point on its demand curve, should it operate? Since the firm is trying to maximize profit or minimize loss, it will produce the output at which marginal cost equals marginal revenue and charge the price given by the demand curve at that output.
Demand, Revenues, and Costs A firm with a downward-sloping demand curve, where more can be sold only by lowering price, faces demand conditions identical to those given in the example in Chapter 11 of the craftsperson selling rocking chairs. Table 11.5 showed that, with demand behaving in this way, the marginal revenue from each additional chair sold was less than its price. Table 11.5 is reproduced in Figure 13A.3.
FIGURE 13A.3 Demand and Marginal Revenue from Selling Chairs
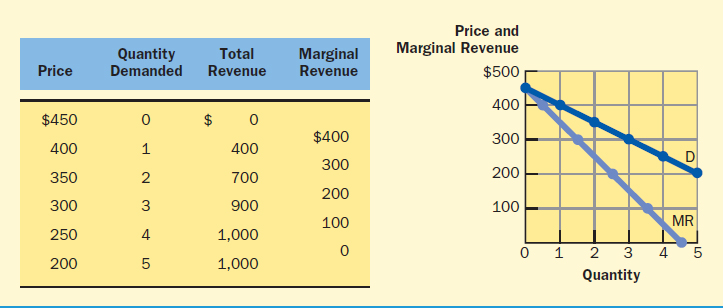
When price must be lowered to sell a larger quantity, the marginal revenue for each additional unit demanded is less than price. As a result, the marginal revenue curve lies below the demand curve.
Since price is shown on the demand curve, and since marginal revenue is less than price when price falls, the marginal revenue curve associated with a downward-sloping demand curve is also downward sloping and lies below that demand curve. To illustrate this principle, the demand and marginal revenue curves for the craftsperson's chairs are also given in Figure 13A.3. Marginal revenue, like all marginal measurements, is plotted midway between the quantities. For example, the marginal revenue of $400 for the first unit is plotted at one-half unit.
The marginal cost curve for a seller with a downward-sloping demand curve is typically like that for any firm: It decreases to a minimum and then increases. Figure 13A.4 illustrates representative demand, marginal revenue, and marginal cost curves for a firm with a downward-sloping demand curve.
Determining the Profit-Maximizing Output To determine the profit-maximizing position for the seller in Figure 13A.4, the intersection of its marginal cost and marginal revenue curves must be located. To find the profit-maximizing output, one reads down from the point where marginal cost equals marginal revenue to the quantity axis. The profit-maximizing output is 300 units. The profit-maximizing price is found by reading up from the intersection where marginal cost equals marginal revenue to the demand curve, and from the demand curve to the vertical axis. For this seller, the profit-maximizing price is $6 per unit. Thus, point A on the demand curve shows the profit-maximizing price and output position for this seller: This seller should charge $6 and sell 300 units.
As is the case with a purely competitive firm, whether a firm with a downward-sloping demand curve is maximizing economic profit or minimizing loss depends on the relationship between price and average total cost at the output level where marginal cost equals marginal revenue. If the average total cost curve lies below the demand curve, economic profit is maximized, and if the average total cost curve lies above the demand curve, the firm is incurring a minimum loss.
FIGURE 13A.4 Profit-Maximizing Output for a Firm with a Downward-Sloping Demand Curve

The rule for maximizing profit is the same for all firms: Operate at the output level where marginal revenue equals marginal cost. Firms will charge the price given by the demand curve at that output level.
FIGURE 13A.5 A Firm with a Downward-Sloping Demand Curve Maximizing Profit or Minimizing Loss

When the average total cost curve lies below the demand curve at the output where marginal revenue equals marginal cost, the firm is maximizing profit by producing that output. When the average total cost curve is above the demand curve, the firm is minimizing its loss by producing where marginal revenue equals marginal cost. Profit or loss per unit is the difference between price and average total cost at the output where marginal revenue equals marginal cost.
Figure 13A.5a shows the firm maximizing profit. At the output level of 300 units, where marginal revenue equals marginal cost, price is $6 per unit and average total cost is $4. Economic profit for this seller is $2 per unit, and total economic profit is $600 ($2 × 300 units).
Figure 13A.5b shows the firm operating with a loss. At the loss-minimizing output of 300 units, price is $6 and the cost per unit is $8, leaving a per unit loss of $2. The total loss for this firm is $600. Test Your Understanding, “Maximizing Profit and Minimizing Loss,” lets you check your skill at identifying the best output level at which a firm can operate and the profit or loss it would earn at that output.
TEST YOUR UNDERSTANDING
 MAXIMIZING PROFIT AND MINIMIZING LOSS
- The table to the right shows the market price of corn and the various quantities that a purely competitive farmer could sell at that price. Based on this information, complete the table and answer the following questions about this farmer.
- On the basis of your completed table, draw the demand and marginal revenue curves for this farmer's corn on graph A.
- To maximize profit or minimize loss, this farmer should sell ____ bushels of corn.
- At this quantity the farmer's average total cost is $____ per bushel, profit/loss is $____ per bushel, and total profit/loss is $____.
- On the same graph, draw the new demand and marginal revenue curves the farmer would face if the market price were to rise to $3.50 per bushel.
- At this price, the farmer should sell ____ bushels of corn to maximize profit or minimize loss.
- At this quantity, the farmer's average total cost is $____ per bushel, profit/loss per bushel is $____, and total profit/loss is $____.
- Given in graph B are the demand and cost conditions faced by a pure monopolist. To maximize profit or minimize loss, this firm should produce and sell ____ units of output and charge a price of $____ per unit. At this level of output the firm's average total cost is $____ per unit, its profit/loss per unit is $____, and its total profit/loss is $____.
Answers can be found at the back of the book.

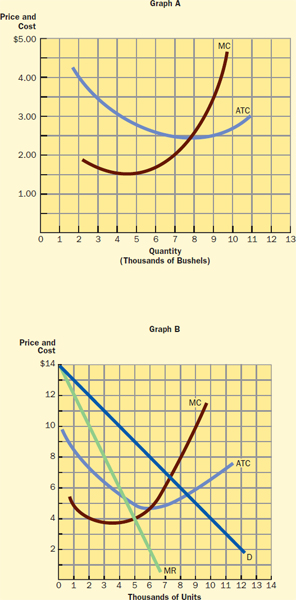
1 Remember that there are two types of profit: Normal profit is a return for implicit costs and necessary for a business to continue; economic profit is not a cost of production and is the profit over normal profit.
2 An increase in market supply would cause the market supply curve to shift to the right. The resulting fall in equilibrium price would cause the individual seller's demand curve to shift downward.
3 Sometimes trade associations to which firms in an industry or market belong will advertise the product itself. Promotions for beef, eggs, and milk are good examples of product–not firm–advertising.
4 Here we need to stress that we are talking about the demand curve for an individual seller's product, not the market demand curve.
5 Generally, in monopolistic competition the response to a price change is elastic; that is, over the broadest range of the demand curve, buyers respond strongly to price changes. In Figure 13.8, when the price increases from $2.50 to $3.00, or by 20 percent, the quantity demanded decreases from 500 to 200 units, or by 60 percent. Since the percentage change in the quantity demanded is greater than the percentage change in price, the response is characterized as elastic. (The exact price elasticity is 60%/20% = 3. You can refer to Chapter 3 to refresh your memory about elasticity.)
6 Some question whether there really are undifferentiated oligopolies. While the physical products of the sellers in the market might be the same, there can be differences among the sellers' delivery systems, financing options, and other arrangements.
7 See Chapter 12 for a review of economies of scale.
8 Over the years, the power of OPEC has diminished. The members of OPEC have had some difficulty in reaching agreements, and sometimes individual members break a cartel agreement when it is in their own best interest to do so. The power of OPEC has also been reduced by new sources of oil, such as the Alaska pipeline, oil reserves in the North Sea, and alternative supplies of energy, such as ethanol and solar energy.
For the court's comment on the NCAA as a classic cartel, see Board of Regents of the University of Oklahoma v. National Collegiate Athletic Association, 546 F. Supp. 1276 (1982), pp. 1300–1301.
1 A firm facing a loss over the short run may minimize its loss by shutting down, rather than producing. Recall from Chapter 12 that a firm has both fixed costs and variable costs in the short run. If it shuts down and produces nothing, it must still pay its fixed costs, but it has no variable costs to pay. Thus, we can say that the “shut-down loss” to a business over the short run is the fixed costs it must continue to pay even though it is not producing.
Whether a firm that is losing money is better off shutting down or producing depends on the relationship between its price and average variable cost. If price is greater than AVC, the firm should continue operating at a loss in the short run: The firm can pay all of its variable costs and contribute something to its fixed costs. Because of this, its operating loss (equal to part of its fixed costs) is less than its shut-down loss (all of its fixed costs). If price is less than AVC, the firm should shut down. In this case the firm cannot cover all of its variable costs. Continuing to operate means that the firm is losing an amount equal to all of its fixed costs and some of its variable costs. By shutting down it loses just its fixed costs.
The left-hand figure below shows a firm that should continue to operate. At the loss-minimizing output of 6,000 bushels, the price of $3.00 will cover the average variable cost of $2.50 and contribute $0.50 per bushel to the fixed costs. The right-hand figure shows a firm that should shut down. At the loss-minimizing output of 6,000 bushels, the price of $3.00 will not cover the average variable cost of $3.50. The firm loses all the fixed costs plus $0.50 per bushel for the variable costs.