
CHAPTER OBJECTIVES
To define economics and introduce the scarcity and choice problem which underlies economics.
To explore opportunity cost, efficiency, and equity and their relationships to scarcity.
To identify the four factors of production and the income return to each type of factor.
To differentiate between economic theory and economic policy, and introduce the tools economists use to express theories and policies.
To use the production possibilities model to illustrate and explain the basic problem of scarcity.
To explain (in an appendix) how to construct a graph and interpret the illustrated relationship.

WHAT IS ECONOMICS?
We are always making choices. We constantly choose how to spend our time and our money. We make simple choices like whether to take the time to eat lunch rather than work or whether to spend money for bottled water rather than drink from a water fountain. We make complex choices about careers, where to live, and colleges. And, as members of society, we make choices about voting, supporting public policy issues, recycling, and volunteering to clean up the local park.
Choices are a part of everyday life because our wants exceed our ability to satisfy them. You may want to achieve a high grade point average (GPA) and maintain a job that gives you enough money for clothes, a car, and decent housing during a semester that does not provide enough time for both. People in a community may want a recreation complex, street repairs, an ambulance, and other services but don't have enough tax dollars to pay for it all. It is this scarcity of time and things and the resulting choices that must be made that bring us to the study of economics.
Economics is the study of how scarce, or limited, resources are used to satisfy people's unlimited wants and needs. In other words, economics is concerned with how people make decisions in a world of scarcity. Much of the study of economics is focused on satisfying people's wants and needs for material “things”—shoes, cars, medical services, entertainment, and the like. And, while happiness, sorrow, beauty, and integrity are not direct concerns of the discipline of economics, we know that often these values underlie the economic decisions that people make. Many of us have given our time and money to a person or cause rather than spend it on ourselves because it gives us greater happiness.
Economics
The study of how scarce, or limited, resources are used to satisfy unlimited wants and needs; the study of decision making in a world of scarcity.
The field of economics is extensive and it is always growing. While you may hear economists voicing opinions about unemployment, inflation, interest rates, poverty, energy, the environment, and international trade, this just scratches the surface. This textbook will introduce you to some of the major areas of study in economics, some key institutions and relationships, and some controversial policy issues. A quick glance through the table of contents will give you an idea of the breadth of topics included in the discipline of economics.
Why study economics? What can it do for you? Economics permeates our lives. Many of our own personal decisions are obviously rooted in economics: how we pay next semester's tuition or whether we should take a job halfway across the country. But economics is also at the root of decisions made with far-reaching impacts: what programs to fund in a congressional budget or how much support to provide for concerns over global warming.
A course in economics provides valuable information, but it also develops reasoning and analytical skills that enable you to think smarter. Through the study of economics, you will be introduced to important institutions, such as the Federal Reserve and foreign exchange markets, which play a key role in the unfolding of economic events. You will also be introduced to analytical techniques that develop your critical thinking and reasoning skills, enabling you to better understand, for example, why the price of a product you want keeps rising, why the benefits of a job move out-weigh its costs, or why you support the position of a candidate for public office.
Once you are armed with economic institutional information and skills—skills you will be developing for the rest of your life—you will be better prepared to evaluate and respond to news reports, promises of aspiring politicians, crises at work, personal decisions, and other daily situations. In short, an understanding of economics helps make you a better-informed citizen and decision maker and is important for success in your career—be it law, health care, journalism, or anything else.
Economics and Scarcity
Without scarcity there would be no reason to study economics. Scarcity means that there are not enough, nor can there ever be enough, goods and services to satisfy the wants and needs of all individuals, families, and societies. Look at your own situation. Do you own the car you would most like to have? Do you have enough money for the DVDs, concerts, e-reader, and boots you want? Does the recent car insurance bill mean ramen and peanut butter this month? Societies face the same scarcity problem on a larger scale. Money spent for roads is money not available for hospitals or schools. Gasoline and oil used now will not be available in the future.
Scarcity
Too few goods and services to satisfy all wants and needs.
The root of the scarcity problem is in the definition of economics—that people have limited resources to satisfy their unlimited wants and needs. People seem to continually require more goods and services and to become dissatisfied with what they have. When this psychological drive for more is considered for all members of society, wants and needs become so great in number that they can be viewed as virtually unlimited. For example, your instructor could devote one class period to listing everything everyone in the class wanted both for themselves and for society in general. By the next class period, and in all later periods, the list would increase as students added goods and services originally forgotten or introduced to them throughout the semester. The list would never be completed! One might recall that 10 years ago the average American did not need an iPad, wireless Internet, organic apples, a GPS system, or a hybrid SUV.
All of these unlimited wants and needs cannot be satisfied because the resources available to produce goods and services are limited. These resources include all the people, materials, machinery, and other items that contribute to the production of goods and services. For example, to provide pizzas, a business needs cheese and other ingredients, people to cook and serve, electricity, water, ovens, refrigerators, a manager, a building, and so on. Every resource available for production is limited in amount: There is not an infinite supply of labor, energy, or any other resource.
The problem of limited resources also occurs for individuals. We never seem to have enough money to purchase everything we want and need, and never have enough time to accomplish everything we want to do. Limited resources keep many students from taking a trip over spring break, upgrading a computer, or buying a new car instead of repairing an old one. Many students would like to produce a high grade point average, work at a part-time job, and enjoy an active social life but cannot achieve all of these due to time constraints.
In recent years, we have become more conscious than ever of our limited resources as we face worldwide environmental issues. We are keenly aware of the limits of air, water, energy, and the ability of the earth to sustain itself. Global warming, holes in the ozone layer, greenhouse gas emissions, fracking for natural gas, and water shortages throughout the world have become topics of regular discussion and concern.
Scarcity and Choice
Since it is impossible to satisfy all of the wants and needs of individuals, businesses, nonprofits, government units, and societies, decisions must be made about what to satisfy and how to use limited resources. A student, for example, who is pressed by the demands of a job and the need to study for an exam must make a decision about how to use limited available time. A state university that is facing a reduction in funds must make choices about what programs, staff, and services to cut. And, as a society, we must choose the degree to which we will pollute our air and water.
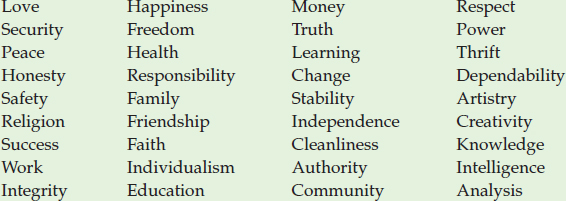
Each of us has several core values that drive us. They are at the heart of our decisions and the actions that we take. Sometimes it is helpful to identify these core values so that we understand what is at the root of our actions. The following lists some possible values. Circle the five that best represent your core values.
Anytime we make a choice, there are tradeoffs and consequences. Suppose that a student has $100 (a limited sum) and wants to use the money for either e-supplements in a tough course or a weekend visit with an old friend. The visit is the tradeoff for the course supplements, and the supplements are the tradeoff for the visit. In choosing between these, the student will evaluate the consequences of each alternative. The supplement purchase might result in a good grade in a course; the visit might mean renewing a friendship.
Tradeoff
Giving up one thing for something else.
In making choices, a decision maker's values play a very important role and underlie most choices. Values are those principles and standards that a person considers to be worthwhile and are the ideals that drive people and organizations. Try the exercise in Table 1.1 to determine your own core values.
Decisions usually involve a value judgment, which is the relative importance that a person assigns to an action or alternative. If the student faced with the choice of course supplements or a weekend with a friend decides that a good grade is more important, the course supplements will be purchased with the $100; if friendship is valued more than a good grade, the student will choose the visit.
Value Judgment
The relative importance one assigns to an action or alternative.
Scarcity also forces business owners and managers to make decisions based on value judgments. Companies often have to decide between raises for employees and equipment updates, or whether or not to continue an outstanding, yet costly, health insurance program at the expense of another business need, such as a building renovation. The choices made will reflect the value judgments of the business owners and managers. In some cases, employees are highly valued and wage increases and benefits are important; in other cases, stockholder profit or expansion needs may be the primary value.
Society faces the same scarcity-related tradeoff problem. Take a look around your community to see the value judgments of its residents. Public decisions about how well schools, parks, roads, fire and police, and other services are funded—or not funded—reflect the values of the community. Through the ballot process, choices are made about representatives who make public decisions and about the level of taxation for education and public services.
FIGURE 1.1 Scarcity, Choice, and Influences on Decision Makers
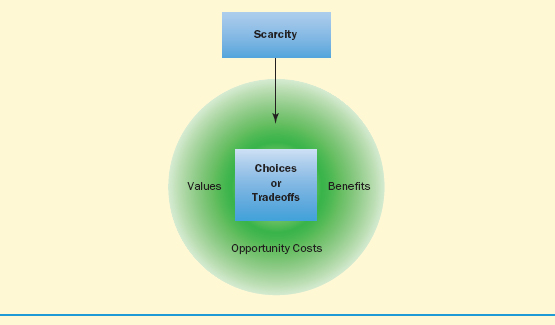
Scarcity imposes choices on decision makers who are influenced by the benefits and opportunity costs of the alternatives, as well as by their own values.
We are also aware of tradeoffs at the national level. If society chooses to balance a federal budget and increase defense spending, it may need to reduce government spending on other areas. If we choose to permit trucks and SUVs that guzzle gas or buses that emit large amounts of carbon, we stand to face future environmental consequences.
Each tradeoff made is necessary, because we cannot have everything, and each tradeoff reflects the value judgments of the decision makers.
Opportunity Cost In making choices, people evaluate both the benefits and the costs of their choices. Because of scarcity, every decision to acquire a good or service or to spend time or money in a certain way has a cost attached to it. Economists call this opportunity cost. An opportunity cost is the cost of a purchase or a decision measured in terms of a forgone alternative—that is, what was given up to make the purchase or carry out the decision. Once time or money is devoted to one thing, the opportunity to use that time or money for something else is lost.
Opportunity Cost
The cost of a purchase or decision measured in terms of a forgone alternative; what was given up to make a purchase or carry out a decision.
Everything that someone can purchase or do has an opportunity cost attached to it. If you spend $40 to put gas in your car, the opportunity cost of that gas is what was given up to buy it—perhaps a few decent meals. What was the opportunity cost of the last purchase you made? What is the opportunity cost of cutting a class in this course?
The opportunity cost of choosing to acquire more shoes or food, rather than supporting an increase in a school tax, could be an inferior education for children in a community. The opportunity cost of balancing a government budget could be forgone educational and health benefits due to reduced spending. Because of scarcity, individuals, families, businesses, and societies make choices based on both the benefits and the opportunity costs of their decisions. Figure 1.1 shows the relationship between scarcity and choice, and the influences on a decision maker.
APPLICATION 1.1
 TO WORK OR NOT TO WORK
After-dinner visits to the mall or the local Starbuck's and late night stops at McDonald's reveal that a lot of teenagers spend their evenings working at close-to-minimum-wage jobs. Teens are driven to work late hours, especially during the school week, for various reasons: unemployment for a good family income earner that creates a critical need to contribute to household expenses; escalating car insurance payments from multiple accidents; simply wanting cash for clothes and concerts; or just plain enjoyment from the socialization part of a job.
Understanding the impact of teen employment and long working hours during high school has been the subject of some economic, sociological, and psychological studies. Findings on the positive side of teen employment include learning about the responsibilities of a job and the expectations of an employer, exposure to time management, and interaction with the public. Time at work also means time staying out of trouble.
But what are the costs? Obviously, time spent at work is time given up for studying and engaging in activities that are part of the high school club and athletic experience, and time not spent with family and friends. In addition, the teen who works long hours may not get the sleep needed to be a productive learner during the school day. In one study, too many work hours often led to higher alcohol use.
There could also be long-run consequences. Those work hours and extra income could mean lower grades, the inability to gain acceptance into a competitive college, and missed opportunities for discoveries about cultural, athletic, and academic interests that ultimately drive and enrich one's life. Also, consider how this affects an economy that increasingly relies on mental rather than physical contributions from its work force for economic growth. One study found that 53 percent of American teens worked in any given week. In some other countries this was much less: only 18 percent of Japanese students worked.
“There are a lot of benefits to students' working in moderation,” says one sociology professor at the University of Minnesota. “But most sociologists and psychologists would say that it's an excessive load for full-time students to work 25 or 30 hours a week if you think it's important for young people to participate in extracurricular activities, develop friendships, and spend time with their families.”a
aQuote and references to studies are from Steven Greenhouse, “Problems Seen For Teenagers Who Hold Jobs, The New York Times, January 29, 2001.
Application 1.1, “To Work or Not to Work,” deals with the opportunity costs faced by teenagers who work long hours while going to school. What are students trading off to work more and earn more income?
Efficiency and Equity
In dealing with the basic problem of scarcity—not enough goods and services to satisfy everyone's wants and needs—there are two important concepts to consider: efficiency and equity.
Efficiency is concerned with using resources effectively or getting the most from scarce resources. Efficiency occurs when a given good or service is produced at the lowest possible cost. If all goods and services were produced efficiently, society would experience the greatest possible lessening of the scarcity problem. Producing efficiently does not eliminate scarcity, but it does allow for the production of the maximum amount of goods and services to satisfy unlimited material wants and needs. This is important in a world of scarcity and is a major economic goal.
Efficiency
Producing a given good or service at the lowest possible cost; getting the most output from resources.
When is a student efficient? Most students set a goal for a grade, and then need to commit the time to achieve that grade. (While most instructors think this should be an A, in reality it might just be a C!) A student is efficient when this targeted grade is earned using the least amount of time possible. This could result from effective note taking, good study habits, careful textbook reading, and the like. Students who study efficiently have more time for other activities and get the most from their limited resource of time.
Likewise, a society gets the most from its limited resources when efficient techniques of production allow those resources to be used to the fullest. With the aid of good computer software, for example, professionals like architects, accountants, and others can be very efficient. As more household appliances are manufactured to operate with less energy usage, society can stretch its energy resources. Inefficient students waste their time, and an inefficient use of a society's resources wastes those resources. In both cases the scarcity problem is worsened.
In a world of scarcity, where there are not enough goods and services to satisfy everyone's wants and needs, there is the issue of what is a fair, just, or equitable distribution of goods and services among the members of a society. Equity, or justice and fairness, raises two basic questions: Should a fair distribution of goods and services be an economic goal for a society? If it is, how is a fair distribution defined and achieved?
Equity
Justice or fairness in the distribution of goods and services.
The concept of what constitutes an equitable distribution of goods and services is controversial because it is based on people's value judgments. To some people, equity occurs when goods and services are divided equally. To others, the distribution of goods and services should be made according to people's needs. And to some, equity results when people are rewarded according to what they contribute to production: Those who contribute more or better resources should receive more. This last view—that people should be rewarded for their contribution to production—is the philosophical basis of a market system. Market and other economic systems will be discussed in Chapter 2.
The issue of how to define and achieve equity is not easily resolved because there are so many diverse viewpoints. In the United States, for example, there is a continuing debate over how much the government should provide for those who are in need. This debate has received extensive media coverage in recent years over such issues as health care, tax breaks, welfare payments, and unemployment compensation.
FACTORS OF PRODUCTION
Think about all of the thousands of different types of resources, or factors of production, that are used to produce goods and services, from the shelving in a big box store, to the skilled hands of a neurosurgeon, to the air filters on a plane. To bring order and manageability to any discussion about resources, economists classify them into four groups: labor, capital, land, and entrepreneurship.
Resources (Factors of Production)
Persons and things used to produce goods and services; limited in amount; categorized as labor, capital, land, and entrepreneurship.
- Labor includes all human effort, both physical and mental, going into the production of goods and services. It encompasses the efforts of everyone from lawyers to lifeguards—all who work to produce goods and services.
Labor
Physical and mental human effort used to produce goods and services. - Capital includes warehouses, machinery and equipment, computers, office furniture, and all other goods that are used in the production of goods and services.
Capital
Items, such as machinery and equipment, used in the production of goods and services. - Land includes all inputs into production that originate in nature and are not human-made—oil, iron ore, and fertile acreage to name a few.
Land
Productive inputs that originate in nature, such as coal and fertile soil. - Entrepreneurship is the function of organizing or bringing other factors together and taking the risk of success or failure. Without this function, economic activity would not occur. A small business owner usually performs this function and is called an entrepreneur, and in corporations, managers organize and stockholders take the risk.
Entrepreneurship
The function of organizing resources for production and taking the risk of success or failure in a productive enterprise.
The relationship between productive resources and society's material wants and needs is summarized in Figure 1.2.
FIGURE 1.2 Relationship between Resources and Wants and Needs

Producers transform factors of production that they get from resource owners into goods and services to satisfy society's wants and needs.
Factors and Income
People who own resources provide them for production because they expect a return. Although the return may be personal satisfaction, such as a positive feeling from community service, most often people expect to be paid, or to receive an income. While money is money, and $100 received by a worker is no different from $100 received by the owner of a machine, it is helpful to label the incomes received from selling different types of resources. There are
- wages—income for labor,
Wages
Income return to labor. - interest—income for capital,
Interest
Income return to owners of capital. - rent—income for land resources, and
Rent
Income return to owners of land resources. - profit—income for carrying out the entrepreneurial function.
Profit
Income return to those performing the entrepreneurial function.
While it might appear trivial to give a separate name to the income received by each of the different groups of resources, the distinction can be significant. For example, various legislative and public policy initiatives are aimed at particular income groups. Take the Social Security program. Payments into this program come from wages as well as income, or profit, earned by the individual entrepreneur. Rent, interest, and corporate profit are incomes that are not part of the Social Security system.
The classification of people into different earning groups has also had interesting social connotations. As the economist Robert Heilbroner put it, “It is not just Labor on the one hand and Land or Capital on the other; it is the Bronx on the one hand and Park Avenue on the other.”1 In addition, Marxian theory, which has been the most persistent critique of capitalism, is based on the premise that a conflict exists between wage and profit earners that is inherent in capitalistic systems.
Scarce Resources
How scarce are resources, or factors of production? Table 1.2 suggests that there is an abundance of people and things with which to produce goods and services. In the U.S. economy alone, there are over 150 million people working or looking for work, almost a billion acres of farmland, and billions of barrels of petroleum reserves. The list of available resources goes on and on.
TABLE 1.2 Selected Available Resources in the U.S. Economy
Although the U.S. economy has a large number of available resources, there are not enough to satisfy all material wants and needs.
| Resource | Amount available in 2010 |
| Total civilian labor force | 154 million people |
| Total farm land | 920 million acres |
| Crude oil reserves | 20.7 billion barrelsa |
| Locomotives | 24 thousanda |
| Manufacturing establishments | 314 thousanda |
a Crude oil reserves and locomotives are for 2009 and manufacturing establishments are for 2008.
Source: U.S. Bureau of the Census, Statistical Abstract of the United States: 2012, 131st ed. (Washington, DC: U.S. Government Printing Office, 2011), pp. 377, 500, 536, 576, 674.
Although large numbers of resources may be available in an absolute sense, they are scarce relative to the wants and needs that their use attempts to satisfy. People's wants always continue to outrun the economy's ability to satisfy them.
If we cannot solve the scarcity problem, can we at least ease it? Over the last few decades, there has been debate over whether the scarcity problem has eased or worsened. On the positive side, we have made much progress: Life expectancies have increased with improved medicines; technological changes in transportation allow us to travel rapidly; fashionable clothing is available to buyers of all income levels; and we can prepare food, process information, and communicate faster than ever before. In addition, the average person has more belongings and lives in a larger house.
But there is evidence to suggest that, in some respects, the scarcity problem has worsened. Today we worry about the availability of clean air and water, while earlier generations thought of these as free and abundant. There is growing concern about our current rates of production and disposal of goods, and the resulting effects on our quality of life, our health, and the earth's forests, open spaces, and ozone layer. Some people argue that today we are more acutely aware of the limits of our productive capability than we have ever been.
Application 1.2, “Does Money Buy Happiness?,” takes a look at some research on the ties between money and happiness. Many people think that a larger income lessens scarcity by providing more personal opportunities to satisfy wants and, therefore, makes people happier. This may not be the case. After reading this application, how would you answer the question “Does money buy happiness?”
ECONOMIC THEORY AND POLICY
As households, businesses, and governments go about conducting their economic affairs, it is helpful to have an understanding of some basic economic cause-and-effect relationships. Knowing about the drivers behind consumer behavior and spending and the causes of changing interest rates, income levels, and job growth fosters better decision making. Some economic relationships are complex, and gaining an appreciation for them is important. This task of sorting out and understanding cause-and-effect relationships falls to economic theory.
APPLICATION 1.2
DOES MONEY BUY HAPPINESS?
In recent decades, much research in the fields of economics and psychology has focused on the ties between money and happiness. And the answer to the question “Does money buy happiness?” is maybe yes, maybe no.
Money allows people to buy more, and better-quality, goods and services. On the surface, it appears that the basic economic problem of scarcity is lessened by having more money, and that this should lead to higher levels of happiness. We might think that people who drive new luxury cars and live in big homes are happier than people who ride a bus and live in a small apartment. A few researchers might say yes, the richer are happier, but many say the opposite, and a few say that happiness is increased very slightly with more money.
Psychologist Richard E. Lucas of Michigan State University thinks there is evidence to answer yes to three interesting happiness questions: Does money make you happier? Does being happier in the first place allow someone to earn more, perhaps through increased creativity or energy? Is there another factor that brings more of both money and happiness?
Happiness is certainly a subjective state of mind influenced by a person's values, experiences, future prospects, and a host of other factors. There is also a difference between short, even momentary, periods of happiness and a longer-term level of sustained satisfaction. Winning the lottery or receiving a year-end bonus can provide immediate happiness, but whether or not it will have a sustained impact is another consideration.
There is also some thought that extra money for someone who is very poor might account for higher levels of happiness because it has a greater positive effect on negative circumstances. News stories of families who receive homes built through volunteer efforts or children who attend a summer camp that they could not afford without donors often focus on the intense happiness of the recipients.
So, if there is no evidence to suggest that people who live in Virginia are happier than those who live in Oregon because their average household income is greater ($59,330 for Virginia and $48,457 for Oregon in 2009), what does make us happier? A clear answer to this question would certainly land us on the talk show circuit. Professor George Lowenstein of Carnegie Mellon University suggests that people aren't good at figuring out what to do with their money and might overestimate the pleasure from something they buy. Professor Daniel Gilbert suggests that human relationships, time with family and friends, and experiences are the key to happiness. And others suggest that altruistic spending is the answer.
Sources: Malcolm Ritter, “Study: Money-Happiness Link Is Complex,” Associated Press, November 26, 2006, www.sfgate.com; Matthew Herper, “Now It's a Fact: Money Doesn't Buy Happiness,” Forbes, moneycentral.msn.com; “The Smiling Professor,” The New York Times, April 22, 2008, www.nytimes.com; U. S. Census Bureau, The 2012 Statistical Abstract, Table 706, “Income—Distribution by Income Level and State: 2009,” www.census.gov.
While theory tells us about relationships, economic policy deals with guidelines and actions. Policy decisions are made at many levels—from an instructor setting a grading policy, to a corporation setting policy about executive salaries, to a city setting its annual budget. When a decision maker sets parameters for actions, policy is made.
When the media speak of an economic policy for dealing with rising prices or unemployment, they are referring to the course of action that has been chosen to deal with the economic problem. Ideally, theories and policies are related. Before committing to a particular course of action, a person should make an effort to order and understand the basic relationships with which he or she is dealing.
Economic Theory
An economic theory is a formal explanation of the relationship between economic variables.2 A theory gives a reason why something happens, offers a cause-and-effect interpretation for a set of events, or shows the effect on one variable when another changes. There are economic theories to explain unemployment, inflation, price movements in the soybean market, wage rates paid to teenagers, changes in foreign exchange rates, and almost any other economic condition. For example, one important economic theory deals with the relationship between changes in the price of an item and the quantity of the item demanded by consumers.
Economic Theory
A formal explanation of the relationship between economic variables.
In order to obtain a valid and predictable relationship between economic variables, theories are explored within the framework of a model. This model framework includes several elements:
Model
The setting within which an economic theory is presented.
- variables to be explored,
- assumptions concerning the model,
- data collection and analysis, and
- conclusions.
Variables A theory is created to provide an explanation for something. This is why the first step in developing a model is the selection of two variables that have a potential cause-and-effect relationship to explore. For example, suppose that students in a class agree that it was unusually hard to find a job last summer and are interested enough in the problem to explore it further. One student theorizes that it was hard to find a job because a major employer left the area, another student thinks that the number of 16-through 22-year-olds wanting summer jobs increased, and another says that the economy in general had weakened. From this discussion, three separate sets of variables have been identified, and each set could be selected for exploration within the context of a model: the change in the number of employers and the number of summer jobs, the changing demographics of the student population and the number of summer jobs, and the state of the economy in general and the number of summer jobs.
In developing theories, disputes may occur because a variety of factors can be considered in analyzing a problem, and only one or a few of those factors are chosen as variables when developing a theory to explain the problem. In exploring reasons for a slow-growing economy, for example, some economists focus on the relationship between the money supply and growth, some on spending and growth, and some on the price level.
Assumptions Assumptions are the conditions held to be true while exploring the relationship between variables. For example, if our students were to develop an economic theory about the relationship between changes in the number of employers and the number of available summer jobs, assumptions could be made about demographics, the economy in general, the number of students wanting to enroll in summer school, and so on.
Assumptions
Conditions held to be true within a model.
Frequently, an assumption is made to hold constant everything other than the variables under consideration. For example, if we were exploring the relationship between the price of coffee and the quantity demanded by consumers, an assumption to hold constant everything that affects the demand for coffee other than its price could be made. That is, it would be assumed that there would be no newly published health report extolling the virtues of coffee drinking, no shift in people's taste toward tea, and no change in income earned while the effect of a change in the price of coffee on the quantity demanded was explored.
Whether an assumption is “true” is not absolutely necessary within the context of a theory. For purposes of developing the theory, it is treated as if it were true. For example, in examining the effect of a change in the number of employers on available summer jobs, one could assume an annual growth rate in the 16-through 22-year-old population group of 0 percent, 3 percent, 12 percent, or any other rate. Whatever rate was assumed would be held constant while the theory was developed.
Data Collection and Analysis When developing a theory, researchers collect and analyze data to determine how the variables are related. This is easy to understand with medical theories: Someone proposes a cause of a disease and then data are collected and analyzed to support or deny that cause-and-effect relationship. In other words, a theory can be supported by showing that the relationship between the variables is logically or statistically valid.
In economics, theories are often demonstrated to be statistically valid by examining real-world numbers concerning the variables. For example, if we wanted to evaluate the relationship between changes in the price of coffee and the amount consumers buy, statistics regarding coffee prices and sales could be used. When data are not readily available, a model builder might conduct a study to gain the necessary information. Offices of institutional research at colleges often conduct studies to determine levels of student satisfaction, completion rates, and such. The federal government, private research groups, and others collect and provide valuable information and extensive data on many facets of economic life, and the computer has made possible speedier and more sophisticated testing of ideas. Econometrics, which is the use of statistical techniques to describe the relationships between economic variables, is an important subfield in economics.
Econometrics
The use of statistical techniques to describe the relationships between economic variables.
One of the most valuable sources of data for the United States is the U.S. Census Bureau's annual publication of the Statistical Abstract of the United States, which is available in libraries as well as online. This authoritative and comprehensive source provides access to information about thousands of topic areas from population to disease to government budgets—information that is valuable in many more courses than economics. Just put the Statistical Abstract of the United States in your search engine to locate the latest copy as well as earlier editions. Or, you can go to www.census.gov/compendia/statab.
Conclusions The conclusion in a model gives the resulting relationship between the variables based on the assumptions, logic, and data analysis that went into the model. For example, by assuming buyers' tastes and incomes to be constant, and by examining past sales records, an economist could statistically show that consumers will decrease the quantity of coffee demanded as the price rises. The variables—price of coffee and quantity demanded—have an inverse relationship.
It is important to understand that different assumptions, data collection methods, or statistical techniques can cause the conclusions of studies to vary. Over the past two decades we have become obsessed with coffee: drinking lattes and frappuccinos, scheduling visits with friends and meetings in coffee shops, and conversing about coffee brands and brews. As this interest grows, so do the studies on the effects of caffeine on our health. And, these studies come with a wide variation in their conclusions.
Some studies say that caffeine causes dehydration; other studies indicate little or no evidence that it serves as a diuretic. Some studies suggest that it holds off baldness, lowers the risk of Parkinson's, and may be beneficial in type 2 diabetes prevention. Other studies have shown that caffeine raises blood pressure and that boiled unfiltered coffee (like French-pressed) may raise cholesterol levels.3 So, what is a person to believe?
APPLICATION 1.3
OK, WHAT ARE THEY?
For most of us, our only contact with UFOs—unidentified flying objects—is watching films like Steven Spielberg's hit, Close Encounters of the Third Kind. Do you know that the movie's title is actually a technical term—CE-3—used by people, called “ufologists,” who study UFOs?
Unidentified flying objects may have caught people's attention since ancient times. But it is only since the late 1940s that serious investigation and efforts to document the phenomenon have occurred.
Someone who wants to understand exactly what a UFO is will have to be ready to work through a not-too-short list of competing theories. One theory is that UFOs are objects flown by aliens from outer space or by some type of being who is smart enough to move back and forth in time and space. Another theory is that UFOs are simply images in the atmosphere caused by things like “ball lightning,” glowing ionized gas, or light refraction.
A further theory says that UFOs are highly advanced military aircraft undergoing testing in absolute secrecy. And yet another theory claims that people who have “seen” UFOs are simply not seeing clearly enough to recognize that they are actually looking at conventional aircraft or natural atmospheric conditions. Finally, there is speculation that people “seeing a UFO” might be searching for something to save them from today's world.
If building arguments to support an economic theory seems difficult, imagine what it must be like building supporting arguments for a UFO theory! Just think, what data would you use? There is nothing comparable to the widely accessible numbers available to explain the effect of a tax increase on spending or a drop in business sales on unemployment rates. Also, like economics, for every argument there could be a counterargument. The argument that Einstein's theory of relativity raises serious doubts about whether aliens from outer space could make it to earth can be countered by the argument that his theory, while brilliant, may not capture something we have yet to learn.
So, just like someone who pulls an economic theory apart to decide whether it is realistic, a person looking into a UFO theory should want to know about the credibility of the person making the argument, the reliability of the evidence (for example, whether the photograph of the UFO has been doctored), the consistency of the arguments, and other details. In other words, we should not be surprised by a relatively large similarity in the rules to evaluate theories across fields of inquiry.
Based on: “Frequently Asked Questions about UFOs,” http://www.cufos.org/Faq_English_P1.html; “Frequently Asked Questions about UFOs Part II,” http://www.cufos.org/Faq_English_P2.html; “BBC—Science & Nature—Space—UFOs,” http://www.bbc.co.uk/science/space/life/aliens/ufos/index.shtml; “Northern UFOs—Theories,” http://www.ssimicro.com/~ufoinfo/theories.html.
Why are there so many conflicting results on the pros and cons of caffeine? As one delves into these studies, there are obvious differences in the assumptions and data collection methods. The number of observations, the conditions held constant in the study, and the choice of analytical techniques all contribute to the conclusion.
Serious controversy has always existed among economists concerning their theories. Scholarly publications sometimes devote many pages to running disputes among practitioners in the field. Questions arise as to the assumptions underlying a theory, the significance and appropriateness of the variables studied, the data collection and analysis, and the possibility that a more influential factor has not yet been tested. Controversies such as these are not limited to economics and are a healthy sign. They are found in all serious inquiry—be it in the social sciences, natural sciences, or humanities—where people are not satisfied with what they now know. Application 1.3, “OK, What Are They?,” further explores problems and controversies surrounding theories by looking at an area of inquiry where alternative points of view are likely more hotly contested than in economics: explaining UFOs (unidentified flying objects).
In summary, economic theories explain the relationships between economic variables. By focusing on one or a few key relationships, economic theories simplify reality so that it can be better understood. Figure 1.3 summarizes the components of a model.
FIGURE 1.3 Economic Theory and Models
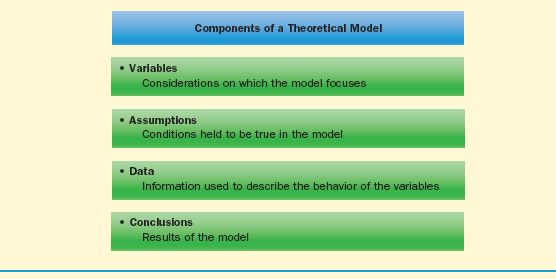
An economic theory is generally explored within the context of a model.
Economic Policy
An economic policy sets a guide for a course of action. Usually an economic policy is created to address an economic problem or change an economic condition. A legislated tax decrease to speed up the economy, mandatory clean air measures, and restrictions on imports of foreign-produced food are all examples of economic policies.
Economic Policy
A guide for a course of action.
Economic policy is the result of a decision by a policymaker, whether a business manager, a local city council, the Congress, voters, or the president. Usually policymakers can choose among several courses of action and may even have several available policy tools. For example, board members of a university that is facing a serious budget crisis could put policies in place that raise tuition, hire fewer faculty members and increase class size, or postpone maintenance or new building construction.
Making policy is not always easy because of the need to weigh the consequences of various courses of action. Take the problem of rising gasoline prices due to a rapidly increasing usage of gasoline coupled with a slowly decreasing supply of gasoline. There are several possible policies to keep gas prices from rising including adopting fuel efficiency requirements for trucks and SUVs, banning vehicles with a low mileage per gallon of gas, funding mass transit projects, encouraging more transit-oriented development, and opening up oil reserves in the Alaskan wilderness. Each of these policies carries significant consequences ranging from a loss of truck and SUV sales and jobs in that industry, to an expenditure of tax monies in rail systems, to environmental issues.
Policy decisions are heavily influenced by the values of the policymaker. Someone who values the environment would likely not support destruction of the Alaskan wilderness, while a Congressperson from a state that depends on the production of trucks and SUVs for significant employment would likely not support policies that negatively affect that industry. Take the question of granting tax credits for college tuition. Families who are facing financial difficulties sending their children to college will likely favor this type of tax break, and those who think that existing programs for tuition relief are adequate may oppose it.
UP FOR DEBATE
 SHOULD ST. LOUIS COUNTY, MISSOURI, IMPOSE MANDATORY TRASH PICKUP AND RECYCLING?
Issue Recently, St. Louis County, Missouri, established trash districts in its unincorporated, nonmunicipal areas and mandated a subscription service that would provide trash pickup and curbside single-stream recycling. Every household was required to participate and pay a monthly fee for the service. The program sparked substantial public support, but also created a great deal of opposition. Should the program have been approved?
Yes Recycling should not be optional. It is the right thing to do to address growing environmental issues. Every citizen needs to participate. Furthermore, curbside pickup encourages recycling by making it easy. Communities with mandatory recycling, especially with large wheeled carts, have experienced significant increases in the volume of recycled materials and decreases in items going to landfills.
There are substantial economic benefits for a district from using one trash hauling company, rather than many private haulers. With one company there is less trash traffic. Rather than many trash trucks using residential streets every day, there is just one service in the neighborhood on pickup day. This saves on street pavement conditions, noise, and gas. Typically, bills are also less for each household.
No The government should not mess with people's garbage. It is another example of government interference with private property and the right of property owners to make their own decisions. People have a right to choose what to throw away, where to throw it, and who to haul it away. Also, by going with a government contracted trash hauler, smaller trash companies may be put out of business.
Many people produce little trash, especially single-person households. Why should these people pay the same price as all other households? Sometimes people find other means to dispose of their trash. These include taking it to work, using a neighborhood business's dumpster, or placing it in a public trash can. Why should these people be forced to now pay a monthly trash bill?
Because economic theories explain how economic variables interact, and because economic policies involve the manipulation of those economic variables, it is crucial that policymakers have some knowledge of these theories and their complexities. If policymakers do not understand basic economic principles, the consequences of their policy decisions could be disastrous. One benefit of a course in economics is that it enables you to better evaluate the consequences of policies and to judge how well or how poorly policymakers are informed.
Up for Debate, “Should St. Louis County, Missouri, Impose Mandatory Trash Pickup and Recycling?,” provides a real-world example of an economic policy decision before a county council. Arguments that St. Louis County Council members heard in support of and against this mandated service are given. Can you identify the economic analysis in the arguments as well as the value judgments of those supporting and those opposing this program?4
TOOLS OF THE ECONOMIST
Words, Graphs, and Mathematical Equations
There are several ways to express economic theories and policies. The first and most basic method is a verbal presentation, or descriptive statement. Earlier we noted that the quantity of coffee demanded falls as its price increases. This is a simple verbal statement about the relationship between coffee prices and the amount people will buy. The advantage of using such verbal statements to express theories is the ease with which concepts can be conveyed. But simple verbal statements with no information about actual numbers can be imprecise. As numbers are added, verbal descriptions can become lengthy and clumsy.
FIGURE 1.4 Relationship between Coffee Prices and the Amount of Coffee Demanded

The downward-sloping line in this graph illustrates the various amounts of coffee demanded at different coffee prices.
A second method for expressing theories and policies is graphing. A graph is a picture illustrating the relationship between two variables, one shown on the horizontal axis and the other on the vertical axis. For instance, returning to our coffee example, the graph in Figure 1.4 shows a relationship between the price of a pound of coffee and the number of pounds of coffee demanded by consumers over a certain period of time.
Graph
An illustration showing the relationship between two variables that are measured on the vertical and horizontal axes.
We frequently use graphs because numbers can easily be incorporated and relationships are visualized. For example, the graph in Figure 1.4 tells us that at a price of $8 per pound 600 pounds of coffee are demanded, and at a price of $4 the quantity demanded increases to 1,200 pounds. Or, if the price is $8 and you lower it by 50 percent, you will increase the quantity of coffee demanded by 100 percent. Or, if you are interested in selling 900 pounds of coffee, the price will need to be $6 per pound.
Once you have had some practice in reading graphs, you will discover that a line or curve illustrates at a glance the relationship between the variables. In a direct relationship, the variables move in the same direction and the line slopes upward. In an inverse relationship, the variables move in opposite directions and the line slopes downward. If you are uncomfortable working with graphs, you should stop at this point and read the appendix to this chapter. In it, direct and inverse relationships and other information on constructing and interpreting graphs are presented.
Direct Relationship
Two variables move in the same direction: when one increases, so does the other; graphs as an upwardsloping line.
Inverse Relationship
Two variables move in opposite directions: when one increases, the other decreases; graphs as a downward-sloping line.
A third way to express economic theories is through mathematical equations. While a major drawback with using equations is fear and lack of confidence in using mathematics, equations have an important advantage. They are very specific about how economic variables are related. Let us return to our coffee example.
Suppose we find that the relationship between the price of coffee and the amount demanded is shown by the equation
Qc = 1,800 − 150Pc.
Here Qc represents the quantity of coffee demanded, and Pc represents the price of coffee. By putting different prices in place of the Pc term, you can see how much coffee buyers would want. For example, if the price were $6 per pound, buyers would want 900 pounds of coffee [900 = 1,800 − 150(6)]. If the price fell to $4, they would want 1,200 pounds [1,200 = 1,800 − 150(4)]. If coffee were given away, people would want 1,800 pounds; and if coffee were $12 per pound, people would stop buying it.
SCARCITY, MODEL BUILDING, AND GRAPHS
Because economists frequently illustrate concepts and theories through models and graphs, we will use these tools to explore scarcity in greater detail.
Modeling Scarcity
As we know, theories are explored within the context of a model that includes variables, assumptions, data, and conclusions. Here we will develop a model to explore scarcity in an economy by examining the production of two goods using that economy's resources. Although this hypothetical economy has the potential for producing a large assortment of goods and services, in this model all the economy's resources will be diverted to the production of only two goods: cell phones and garden tractors. These two goods are the variables in our model.
In the example that follows, the hypothetical economy will be viewed over a short period of time using the following assumptions.
- All resources, or factors of production, are held constant. There are no changes in the available amounts of the economy's labor, machinery, trucks, or other factors.
- All resources are fully employed. Everyone who wants a job has one, and all other resources (such as factories and transportation equipment) available for use are being used. There is no involuntary unemployment of resources.
- The existing technology is held fixed; no new inventions or innovations occur.
The data for this model are provided in Table 1.3, which lists some possible combinations of cell phones and garden tractors that could be produced in the economy given the assumptions made. Because the table provides possible levels of production, it is termed a production possibilities table. The data show that if all resources are fully employed in the production of cell phones, then 25 million cell phones can be made, but no garden tractors. If some garden tractors are manufactured (for example, 200,000), then some resources employed in the production of cell phones must be diverted to making tractors, and fewer cell phones will be produced. If all factors are used in the manufacture of garden tractors, no cell phones can be made.
Production Possibilities Table (or Curve)
Gives the various amounts of two goods that an economy can produce with full employment and fixed resources and technology.
TABLE 1.3 Possible Combinations of Cell Phones and Garden Tractors
This production possibilities table illustrates various combinations of cell phones and garden tractors that a hypothetical economy could produce with full employment and fixed resources and technology.
| Cell Phones (Millions) | Garden Tractors (Hundreds of Thousands) |
| 25 | 0 |
| 24 | 2 |
| 20 | 4 |
| 15 | 6 |
| 9 | 8 |
| 0 | 10 |
The production possibilities listed in Table 1.3 can be graphed to illustrate the same relationship. In Figure 1.5, the different cell phone and garden tractor combinations from the table are plotted on a graph and the points are connected with a line to form a production possibilities curve.
FIGURE 1.5 Possible Combinations of Cell Phones and Garden Tractors

A production possibilities curve illustrates graphically the various combinations of two goods that an economy could produce with full employment and fixed resources and technology. Under these conditions, more of one good can be produced only by giving up some of the other.
Interpreting the Model
The basic conclusion of the production possibilities model is a restatement of the scarcity problem: Even with full employment, limited resources allow only limited production of goods and services. In our hypothetical economy, it would be impossible to produce 15 million cell phones and 800,000 garden tractors (shown by point A in Figure 1.5) in the time allowed, even if desired, because there are not enough factors of production to do so. In other words, scarce resources impose a boundary, or limit, on an economy that is illustrated by a production possibilities curve. Our hypothetical economy cannot produce beyond (to the right of) the curve in Figure 1.5.
The production possibilities model also emphasizes the concepts of tradeoff and opportunity cost. When an economy operates at full employment, more of one good can be produced only by giving up some amount of another good. If this economy were producing 20 million cell phones and 400,000 garden tractors, and households demanded 600,000 tractors, then households could have the additional tractors only by giving up some cell phones. This tradeoff concept is a restatement of the principle of opportunity cost, which was introduced earlier: The cost of additional garden tractors can be measured by the number of cell phones given up, and vice versa. The opportunity cost of going from 400,000 to 600,000 tractors is 5 million cell phones. What is the opportunity cost of going from 800,000 to 1,000,000 tractors?5
Several other economic concepts can be illustrated with the production possibilities model by changing the model's assumptions. If the assumption of full employment is dropped and it is assumed that some resources available for production are not used, or there is unemployment, then the economy cannot produce as much as it does under the condition of full employment. With full employment, one production combination was 15 million cell phones and 600,000 garden tractors. If some labor, machinery, or other resource is idle, then less will be produced—perhaps only 10 million cell phones and 400,000 tractors. The result of unemployment is illustrated graphically by a point inside, or to the left of, the production possibilities curve, such as point B in Figure 1.6.
Unemployment
Resources available for production are not being used.
When we drop the assumptions of fixed resources and fixed technology, this model can also be used to illustrate economic growth, which is an increase in an economy's full employment level of output over time. Economic growth can result from additional resources and/or better methods of production (technology). In this case, more labor and other resources or a newly automated manufacturing process would allow an increase in cell phone and garden tractor production. Economic growth can be illustrated graphically by a shift of the production possibilities curve to the right, as shown in Figure 1.7. Point A, which was unattainable under the original assumptions, is now within reach of the economy.
Economic Growth
An increase in an economy's full employment level of output over time.
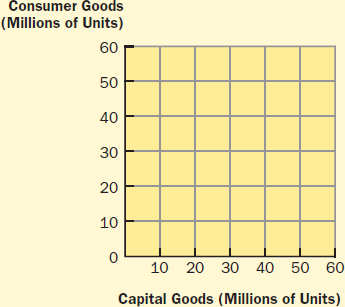
Test Your Understanding, “Production Possibilities,” provides an opportunity to examine your command of the concepts illustrated by the production possibilities model. Here the model is used to evaluate the choices an economy can make between producing capital goods, such as machinery and equipment, which are used to produce other goods and services, and consumer goods, such as food and household furniture, which are produced for final buyers.
Capital Goods
Goods, such as machinery and equipment, that are used to produce other goods and services.
Consumer Goods
Goods, such as food and household furniture, that are produced for final buyers.
FIGURE 1.6 Unemployment in a Production Possibilities Model

With unemployment, an economy is unable to reach the combinations of goods and services that it could produce if resources were fully employed. Point B represents production with unemployment.
FIGURE 1.7 Economic Growth in a Production Possibilities Model

An increase in the number of available resources or an improvement in technology allows the production of goods and services to increase, and the economy's production possibilities curve shifts to the right.
TEST YOUR UNDERSTANDING
 PRODUCTION POSSIBILITIES
All economies are subject to a tradeoff between the production of capital goods, which are used to produce other goods and services, and consumer goods, which are produced for final buyers. Assume that in a hypothetical economy with full employment and fixed resources and technology, the following amounts of consumer and capital goods can be produced.
| Consumer Goods (Millions of Units) | Capital Goods (Millions of Units) |
| 0 | 45 |
| 10 | 40 |
| 20 | 32 |
| 30 | 20 |
| 40 | 0 |
Create a production possibilities curve from this table on the accompanying graph and answer the following questions.
- What is the opportunity cost of increasing the production of consumer goods from 20 million to 30 million units? What is the opportunity cost of increasing the production of capital goods from 40 million to 45 million units?
- On the accompanying graph, illustrate the effect of a small amount of unemployment with a point labeled A, and a large amount of unemployment with a point labeled B.
- Where, in your opinion, is the ideal point on the production possibilities curve for this economy to operate? Label this as point C. On what value judgment about the importance of capital goods and consumer goods did you base your location of point C? What would cause another student to locate point C elsewhere on the production possibilities curve?
- What would life be like in this economy 10 years from now if today it produced only consumer goods? What would life be like in the economy today if it produced only capital goods?
- Demonstrate graphically what would happen if new technology were created for producing both capital goods and consumer goods.
Answers can be found at the back of the book.
MACROECONOMICS AND MICROECONOMICS
The study of economics is organized under two major headings: macroeconomics and microeconomics. Macroeconomics focuses on the operation of the economy as a whole and the interactions of the major groups (called the household, business, government, and foreign sectors) in the economy. It includes such topics as inflation, unemployment, taxes and government spending, and money and banking. Part 2 of this textbook deals with “The Macroeconomy.”
Macroeconomics
The study of the operation of the economy as a whole.
Microeconomics focuses on the behavior of individual businesses and households and on specific product and resource markets. It includes such topics as consumer behavior, cost-benefit analysis, the determination of business profits, and pricing in specific markets. Part 3 of this textbook, “The Microeconomy,” is concerned with understanding the behavior of these individual decision making units in the economy.
Microeconomics
The study of individual decision making units and markets within the economy.
Both macroeconomic and microeconomic concepts have global applications and are relevant to international topics. Part 4 of this textbook, “The International Economy,” which deals with international trade and finance, uses both macroeconomics and microeconomics.
Summary
- Economics is the study of how limited resources are used to satisfy unlimited wants and needs. The basis of economics is a scarcity of goods and services caused by people's insatiable wants for goods and services coupled with a limited amount of resources to produce them.
- Since individuals and societies cannot have everything they want, they must make choices, or tradeoffs. These tradeoffs are influenced by the decision maker's value judgments. Tradeoffs carry an opportunity cost, which measures the cost of a decision or purchase in terms of a forgone alternative.
- Efficiency and equity are important considerations when dealing with the problem of scarcity. Efficiency results when a given good or service is produced at the lowest cost. It allows the greatest attainable lessening of scarcity because resources are used to their fullest. Equity refers to fairness in the distribution of goods and services. The determination of equity differs according to people's value judgments.
- Resources, or factors of production, are those things used in the production of goods and services. All resources are scarce, or limited, in amount. Economists classify these limited factors into four categories: land, labor, capital, and entrepreneurship. When sold, they generate incomes termed, respectively: rent, wages, interest, and profit.
- There is a distinction between economic theory and policy. Economic theory explains why an event occurs, or gives a generalized interpretation of the relationship between economic variables. Economic theories are explored within the framework of a model that includes variables, assumptions or conditions held to be true, data collection and analysis, and conclusions. Economic policy is a guideline for a course of action. Value judgments are important in the selection of economic policies.
- In expressing theories and policies, economists use verbal statements, graphs, and mathematical equations. An upward-sloping line in a graph illustrates a direct relationship between variables, and a downward-sloping line indicates an inverse relationship.
- A production possibilities table and curve can be used to illustrate scarcity. These show that, with assumptions of full employment and constant resources and technology, more of one good can be obtained only by giving up some of another good, making tradeoffs necessary. The effect of unemployment, which causes an economy to produce fewer goods and services than with full employment, is shown by a point inside, or to the left of, the production possibilities curve. Increases in technology and/or resources allow for economic growth, permitting a shift of the curve to the right.
- Macroeconomics is concerned with the operation of the economy as a whole and with the interactions of its major sectors. Microeconomics deals with individual operating units and markets within the economy.
Key Terms and Concepts
Economics
Scarcity
Tradeoff
Value judgment
Opportunity cost
Efficiency
Equity
Resources (factors of production)
Labor
Capital
Land
Entrepreneurship
Wages
Interest
Rent
Profit
Economic theory
Model
Assumptions
Econometrics
Economic policy
Graph
Direct relationship
Inverse relationship
Production possibilities table (or curve)
Unemployment
Economic growth
Capital goods
Consumer goods
Macroeconomics
Microeconomics
Review Questions
- What are the definition of and the root of the study of economics? How does a combination of scarce resources and unlimited wants force people to make economic decisions? How are value judgments and opportunity costs important in the making of these decisions?
- Classify each of the following factors of production into one of the four resource categories used in economics, and identify the income return to the owners of each factor.
- The scanner used to check out groceries in a supermarket
- The instructor of this course
- A pasture used for grazing a herd of cattle
- A coffee urn used by a catering service
- The person who just started her own lawn service company
- The manager of a restaurant that is part of a national chain
- The green field site ready for construction of a new big box store
- What is meant by a direct and an inverse relationship between economic variables? Illustrate, using the accompanying graphs, how you think each of the following relationships would appear, and indicate whether each relationship is direct or inverse.
- Inches of snow and sales of mittens
- Tuition and students demanding to enroll in a university
- Consumers purchasing the same amount of gasoline regardless of its price
- Salaries and years of education

- Distinguish between economic theory and economic policy. What are some reasons for economic theory controversies and economic policy controversies? Give a recent example of economic policy.
- Identify and briefly explain the four elements of a model used to explore an economic theory. How can the choice of assumptions and data used affect the conclusions?
- Draw a production possibilities curve and explain how it illustrates the tradeoffs, or choices, that must be made when an economy is operating at full employment. How can unemployment and economic growth be shown on this graph?
- What is a capital good and what is a consumer good? How does an economy's choice about how many of its resources to devote to capital goods production as compared to consumer goods production affect its current standard of living and its future standard of living?
- The following production possibilities table gives the various combinations of hours that can be worked and GPAs that can be earned by a particular college student who holds a job and takes 12 credit hours of courses a semester. Draw a production possibilities curve based on the information in this table on the graph provided and answer the following questions.
- What is the opportunity cost for this student of increasing the hours worked per week from 10 to 20?
- What factors could cause this curve to shift to the right?
- What factors could cause this student to operate inside, or to the left, of this production possibilities curve?
- What would determine the student's best location on this curve?
- Are there any similarities between the choices that this student makes concerning hours worked and GPA and the choices an economy makes between the production of consumer goods and capital goods?
Hours Worked per Week GPA 50 0.00 40 1.00 30 1.90 20 2.60 10 3.25 0 3.75 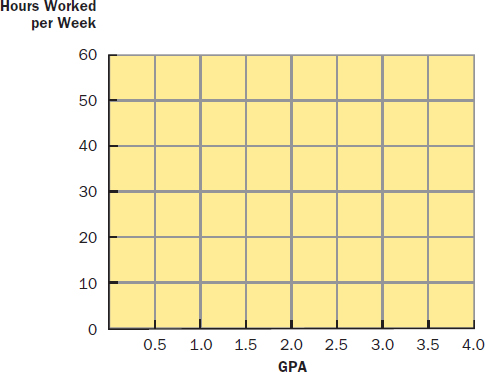
- (From the appendix) Think about the relationship between driving at higher speeds and the likelihood of injury in an automobile accident. How can this relationship be illustrated in one graph to make it appear that the likelihood of injury increases relatively little at higher speeds, and in another graph to make it appear that the likelihood of injury increases dramatically at higher speeds? What warning does this sound about basing a decision on a quick scan of the appearance of a line in a graph?
- Distinguish between macroeconomics and microeconomics, and identify some topics relevant to each.
Discussion Questions
- If resources are scarce and if people are always wanting more than the economy can provide, how is it possible that we would have unemployment?
- Suppose that you are an advisor to a health team working in a poor country. In that country, 20 percent of the children below the age of five die of a particular disease each year. If the health team were to inoculate the population, the disease would cease to be a problem. However, with more people surviving, the country's food supply would become grossly inadequate, and it is estimated that about 20 percent of the children below the age of five would die of starvation each year. Which policy would you follow: inoculation or no inoculation? What are the tradeoffs with each policy? Why would you follow your chosen policy, and how are your values important in reaching a decision?
- How do the popular expressions “you can't have your cake and eat it, too” and “there is no such thing as a free lunch” relate to the basic economic problems of scarcity, choice, and opportunity costs?
- Is there a tradeoff between efficiency and equity, or are these two goals mutually compatible for an economy? Why?
- In your opinion, what would be an equitable, or fair, distribution of goods and services in a society? Why would this be an equitable distribution and what value judgments underlie your opinion? Do you think your opinion would be shared by your friends and family? Why?
- Should national defense-related goods, such as submarines and nuclear weapons, be classified as capital goods or consumer goods? Why?
- Individuals and societies evaluate both the benefits and costs of their choices when making decisions. Can you think of a recent decision you made where you consciously weighed the benefits and costs of possible courses of action? Can you think of a decision where you did not consciously weigh the benefits and costs but wish now that you had?
Critical Thinking Case 1 
DIFFICULT CHOICES IN THE EXTREMEa
Critical Thinking Skills
Defining a problem and possible solutions
Identifying values that underlie a problem
Economic Concepts
Scarcity
Choice
Most Americans today would identify the cost and availability of health care as a major economic concern. In 2010, health care expenditures in the United States came to about $2.64 trillion or close to 18 percent of GDP and were projected to be over $3.5 billion by 2016b Yet, with this substantial sum, many people were not able to afford preventive and necessary medical care.
Advanced technology that keeps critically ill people alive, the increasing incidence of expensive diseases, the aging of the population, the growth in diabetes and heart disease, costly disease detection tests, high-priced medications, and overtreatment from rising malpractice suits have all contributed to the escalation in costs. Add to this, the rise in health care insurance premiums.
The philosophy in the United States has long been to pursue all medical procedures necessary to prolong life. These include life-support equipment, treatments, and intensive hospitalization for all persons regardless of their prognosis. Medicare reports, for example, that a large portion of its funding goes to people who are in the last few days of their life.
A concern for people who are unable to afford routine and necessary medical care and basic medication has given impetus to a discussion for the past decade about health care reform and medical coverage. Even recent plans passed by Congress continue to be debated. Mandatory coverage, increased regulation on hospitals and doctors, the Medicare program, family coverage for young adults, and more continue to meet opposition.
Regardless of where one falls in the health care debate, lurking behind the medical care issue is a major, unavoidable decision imposed by scarcity. If it is impossible to fund every person's medical needs and provide the latest in treatment for all conditions, then decisions must be made as to who gets medical treatment and what treatment is provided. Does treatment go to those who are insured? To those who can afford to purchase it in the market? To younger people? To those who are productive? However we choose to reallocate scarce resources to medical care, we must question whether we can continue to operate under the current premise that all medical procedures must be used at all times for everyone.
Economic decisions rarely exist in a vacuum, but are influenced by social, ethical, and other values. The decisions about the allocation of scarce medical resources are perfect examples about the role that value judgments play in making hard choices. What should Americans consider in the debate about access to health care?
a At the end of each chapter, a Critical Thinking Case will be presented. These cases have two objectives: the development of critical thinking skills and the application of economic concepts. The skills and concepts associated with each case are identified. Suggested questions for discussing each case are included. If an instructor makes no assignment regarding a case, you might want to try answering the questions on your own.
b Centers for Medicare & Medicaid Services, Table 1, “National Health Expenditures and Selected Economic Indicators, Levels and Annual Percent Change: Calendar Years 2006-2012,” www.cms.gov, September 12, 2012.
Questions
- What is the basic economic problem in this case?
- What values underlie a solution to this problem? What values are deeply rooted? What values seem to be more political?
- What reasonable choices can be made to deal with this problem? Are there unreasonable choices? What solutions would be totally off the table?
CHAPTER 1 APPENDIX
GRAPHING
Constructing a Graph
A graph is a picture of a relationship between two variables. The variables are given on the vertical and horizontal axes of the graph, and the line in the graph provides a visual image of how those variables are related. Table 1A.1 provides data about two variables that will be used to construct a graph in Figure 1A.1: various hourly wage rates in a market for day camp assistants and the numbers of teenagers applying for a job at each rate.
The first step in constructing or reading a graph is to identify the variables on the vertical and horizontal axes. In Figure 1A.1, wage rates are represented on the vertical axis and applicants for jobs on the horizontal axis. (It is conventional in economics to put money data on the vertical axis.)
The second step in graphing is to assign numbers along the axes. The numbers assigned to the axes of a graph are important for proper interpretation of the graph. In assigning numbers to a graph, several rules need to be remembered: (1) Always use zero at the origin (the point where the horizontal and vertical axes meet); (2) work up the number scale as you go out on each axis; and (3) when moving along an axis, use equal spaces for equal amounts.1 Notice the application of these rules in Figure 1A.1. Zero is used at the origin, numbers along each axis move up the number scale, the vertical axis is labeled in equal series of $1.50, and the horizontal axis is labeled in equal series of 50 applicants.
The third step in constructing a graphic relationship is to plot data points. Each data point gives a specific combination of the two variables observed. Each point in Figure 1A.1a, for example, indicates a wage rate–applicant combination given in Table 1A.1. Point A shows that when the wage rate is $6, the number of applicants is 150, and point B shows that at a wage rate of $12, 350 teenagers apply.
TABLE 1A.1 Hourly Wage Rates and Numbers of Applicants for a Job
This table illustrates a relationship between hourly wage rates and the number of teenagers applying for a job.
| Hourly Wage Rate | Number of Teenagers Applying for a Job |
| $ 3.00 | 50 |
| 4.50 | 100 |
| 6.00 | 150 |
| 7.50 | 200 |
| 9.00 | 250 |
| 10.50 | 300 |
| 12.00 | 350 |
FIGURE 1A.1 Hourly Wage Rates and Numbers of Applicants for a Job
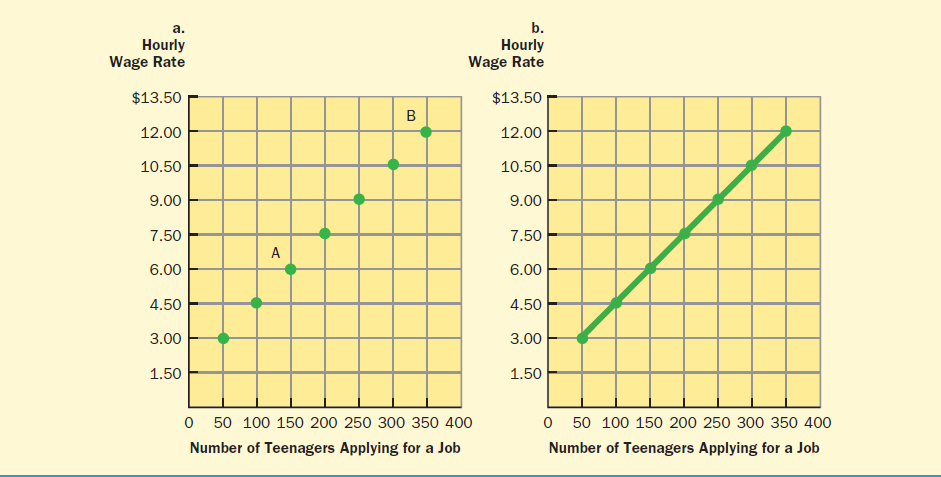
A line in a graph is a series of connected points; each point represents a particular combination of the two variables.
Finally, a line in a graph is nothing more than a series of connected data points. In Figure 1A.1b, the wage rate–applicant combinations from Figure 1A.1a are connected. Joining these points allows us to visualize the relationship between the variables and to “read between” the points. For example, we could conclude that if the wage offered were $6.75, the number of applicants would be approximately 175.
Direct and Inverse Relationships
Earlier in the chapter, it was pointed out that the slope of a line in a graph indicates whether a direct or an inverse relationship exists between the variables. A direct relationship exists when both variables move in the same direction; that is, as one gets larger or smaller, so does the other. We can conclude that the relationship between wage rates and the number of job applicants just discussed is direct. Graphically, a direct relationship is illustrated by a line that slopes upward. An inverse relationship exists when the variables move in opposite directions; that is, as one becomes larger, the other becomes smaller, and vice versa. Graphically, an inverse relationship is illustrated by a line that slopes downward.
The upward-sloping line in Figure 1A.2a illustrates a direct relationship between the price of average-size hot fudge sundaes and the number of sundaes some ice cream stores would be willing to sell at different prices. At a price of $3.75 per sundae, the number supplied would be 1,500, and if the price fell to $1.25, they would like to sell only 500 (preferring instead to sell other, perhaps more profitable, items).
The downward-sloping line in Figure 1A.2b illustrates an inverse relationship between the price of pistachios and the number of pounds of pistachios demanded at each price. At a price of $8 a pound, consumers would demand 200 pounds, and when the price fell to $2, they would demand 500 pounds.
FIGURE 1A.2 Direct and Inverse Relationships

A direct relationship is illustrated by an upward-sloping line in a graph, and an inverse relationship is illustrated by a downward-sloping line.
Students often have trouble reading a graph when there are no numbers given on the axes. If this occurs with you, just put a few hypothetical numbers along each axis and try reading it again. (Remember the rules for numbering when you do this.) After you have some practice in reading graphs, this problem should disappear. Figure 1A.3 gives you an opportunity to test your ability to recognize graphic relationships. What does each graph say about the relationship between the variables identified?
FIGURE 1A.3 Examples of Direct and Inverse Relationships

What type of relationship (direct or inverse) is illustrated in each of these graphs?
FIGURE 1A.4 Undergraduate Tuition and Required Fees for Full-time Students in Degree-Granting Institutions, Public and Private Schools

In considering information given in graphs, one needs to be careful that a quick glance might lead to misinterpretation. In addition, sometimes graphs are used to present a point of view that is not always apparent to the reader. Figure 1A.4 shows two graphs that show information about college tuition and fees for students in public and private institutions. In the graph on the left, the increases are less severe than they are on the right, giving the impression that private school tuition over the years has increased more steeply than public tuition. Yet, when the numbers are calculated, private tuition and fees increased by 325 percent while public tuition increased by 389 percent from 1984 through 2010. What accounts for this differing display? Who might want to use the graph on the left rather than the right? Information about manipulating statistics to present a point of view is available in many books and articles.2
1 R. L. Heilbroner, The Limits of American Capitalism, Harper Torchbook ed. (New York: Harper & Row, 1967), p. 71.
2 A dictionary definition of a theory is “systematically organized knowledge applicable in a relatively wide variety of circumstances; especially, a system of assumptions, accepted principles, and rules of procedure devised to analyze, predict, or otherwise explain the nature or behavior of a specified set of phenomena.” From The American Heritage Dictionary of the English Language, ed. William Morris (New York: American Heritage Publishing Co., 1973), p. 1335.
3 Anahad O'Connor, “The Claim: Caffeine Causes Dehydration,” The New York Times, March 4, 2008, www.nytimes.com; Anna Jane Grossman, “Black for Me, Light for My Hips,” The New York Times, July 12, 2007, www.nytimes.com; Jane E. Brody, “Personal Health: You Are Also What You Drink,” The New York Times, March 27, 2007, www.nytimes.com.
4 In St. Louis County some areas are organized as cities, or municipalities, and some are unincorporated. In the unincorporated areas the county provides municipal services.
5 The production possibilities table and curve show that this economy is producing 9 million cell phones when it produces 800,000 tractors, and no cell phones when it produces 1 million tractors. Therefore, the opportunity cost of moving from 800,000 to 1 million tractors is 9 million cell phones because cell phone production goes from 9 million to zero.
1 For those students who are familiar with graphing techniques, we might point out that only the first, or northeast, quadrant of a graph is used in most examples in this text.
2 The difference between the two graphs in Figure 1A.4 is the spacing used for the numbers on the vertical axes. The graph on the left uses each vertical mark to represent $700, and the graph on the right uses each vertical mark to represent $2,000. By choosing each vertical mark on the left graph to represent $700, rather than a larger number, it exaggerated the rise in the line. The line would have been much less steep if $1,000, for example, had been used. On the right hand graph, the line could have been steeper with vertical marks used to represent something less than $2,000 or more shallow with vertical marks of less than $2,000. In other words, we can deliberately create a different impression for the reader through a selection of units of measure on the axes.
The percentage increases in tuition and fees are found by taking the change in the tuition and dividing it by the base tuition. For private tuition, it is $17,289 divided by $5,315; for public tuition it is $3,780 divided by $971.