
Work Breakdown Structures
Abstract
Work breakdown structure is a generic term for a number of different breakdown structures such as product breakdown structure (PBS) and cost breakdown structure (CBS); it can also have a specific meaning for work carried out on a product. These differences are discussed in detail, including the use of the CBS as a tool for estimating. Diagrams are provided which show the hierarchy of each breakdown structure. Also discussed is the organization breakdown structure (OBS) and its related responsibility matrix.
Keywords
Work breakdown structure (WBS); product breakdown structure (PBS); cost breakdown structure (CBS); organization breakdown structure (OBS); top-down estimating; responsibility matrix
Chapter Outline
An examination of the project life cycle diagram will show that each phase can be regarded as a project in its own right, although each will be of very different size and complexity. For example, when a company is considering developing a new oil field, the feasibility study phase could be of considerable size although the main project would cover the design, development, and production phases. To be able to control such a project, the phase must be broken down further into stages or tasks, which in turn can be broken down further into subtasks or work packages until one can be satisfied that an acceptable control structure has been achieved.
The choice of tasks incorporated in the work breakdown structure (WBS) is best made by the project team drawing on their combined experience or engaging in a brainstorming session.
Once the main tasks have been decided upon, they can in turn be broken down into subtasks or work packages, which should be coded to fit in with the project cost coding system. This will greatly assist in identifying the whole string of relationships from overall operational areas down to individual tasks. For this reason the WBS is the logical starting point for subsequent planning networks. Another advantage is that a cost allocation can be given to each task in the WBS and, if required, a risk factor can be added. This will assist in building up the total project cost and creates a risk register for a subsequent, more rigorous risk assessment.
The object of all this is to be able to control the project by allocating resources (human, material, and financial) and giving time constraints to each task. It is always easier to control a series of small entities that make up a whole than to control the whole enterprise as one operation. What history has proven to be successful for armies, which are divided into divisions, regiments, battalions, companies, and platoons, or corporations, which have area organizations, manufacturing units, and sales territories, is also true for projects, whether they are large, small, sophisticated, or straightforward.
The tasks will clearly vary enormously with the type of project in both size and content, but by representing their relationships diagrammatically, a clear graphical picture can be created. This, when distributed to other members of the project team, becomes a very useful tool for disseminating information as well as a reporting medium to all stakeholders. As the completion of the main tasks are in effect the major project milestones, the WBS is an ideal instrument for reporting progress upwards to senior management, and for this reason it is essential that the status of each work package or task is regularly updated.
As the WBS is produced in the very early stages of a project, it will probably not reflect all the tasks that will eventually be required. Indeed the very act of draughting the WBS often throws up the missing items or work units, which can then be formed into more convenient tasks. As these tasks are decomposed further, they may be given new names such as unit or work package. It is then relatively easy for management to allocate task owners to each task or group of tasks, who have the responsibility for delivering each task to the normal project criteria of cost, time, and quality/performance.
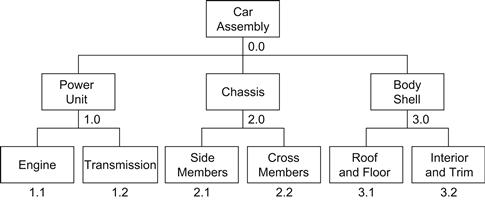
The abbreviation WBS is a generic term for a hierarchy of stages of a project. However, some methodologies like PRINCE call such a hierarchical diagram a product breakdown structure (PBS). The difference is basically what part of speech is being used to describe the stages. If the words used are nouns, it is, strictly speaking, a PBS, because we are dealing with products or things. If, on the other hand, we are describing the work that has to be performed on the nouns and use verbs, we call it a WBS. Frequently, a diagram starts as a PBS for the first three or four levels and then becomes a WBS as more detail is introduced.
Despite this unfortunate lack of uniformity of nomenclature in the project management fraternity, the principles of subdividing the project into manageable components are the same.
It must be pointed out, however, that the WBS is not a programme, although it looks like a precedence diagram. The interrelationships shown by the link lines do not necessarily imply a time dependence or indeed any sequential operation.
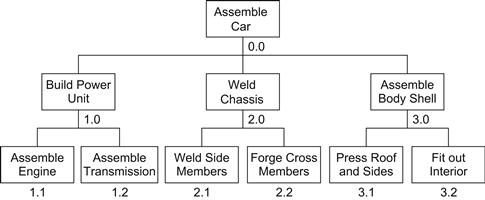
The corresponding WBS shown in Figure 12.2 uses verbs, and the descriptions of the packages or tasks then become: assemble car, build power unit, weld chassis, press body shell, etc.
The degree to which the WBS needs to be broken down before a planning network can be drawn will have to be decided by the project manager, but there is no reason why a whole family of networks cannot be produced to reflect each level of the WBS.
Once the WBS (or PBS) has been drawn, a bottom-up cost estimate can be produced starting at the lowest branch of the family tree. In this method, each work package is costed and arranged in such a way that the total cost of the packages on any branch must add up to the cost of the package of the parent package on the branch above. If the parent package has a cost value of its own, this must clearly be added before the next stage of the process. This is shown in Figure 12.3, which not only explains the bottom-up estimating process, but also shows how the packages can be coded to produce a project cost coding system that can be carried through to network analysis and earned value analysis.
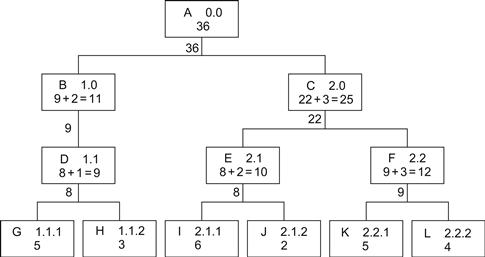
The resulting diagram is now a cost breakdown structure (CBS).
It can be seen that a WBS is a powerful tool that can show clearly and graphically who is responsible for a task, how much it should cost, and how it relates to the other tasks in the project. It was stated earlier that the WBS is not a programme, but once it has been accepted as a correct representation of the project tasks, it will become a good base for drawing up the network diagram. The interrelationships of the tasks will have to be shown more accurately, and the only additional items of information to be added are the durations.
An alternative to the bottom-up cost allocation is the top-down cost allocation. In this method, the cost of the total project (or subproject) has been determined and is allocated to the top package of the WBS (or PBS) diagram. The work packages below are then forced to accept the appropriate costs so that the total cost of each branch cannot exceed the total cost of the package above. Such a top-down approach is shown in Figure 12.4.

In practice both methods may have to be used. For example, the estimator of a project may use the bottom-up method on a WBS or PBS diagram to calculate the cost. When this is given to the project manager, he or she may break this total down into the different departments of an organization and allocate a proportion to each, making sure that the sum total does not exceed the estimated cost. Once names have been added to the work packages of a WBS or PBS it becomes an organization breakdown structure (OBS).
It did not take long for this similarity to be appreciated, so that another name for such an organization diagram became organization breakdown. This is the family tree of the organization in the same way that the WBS is in effect the family tree of the project. It is in fact more akin to a family tree or organization chart (organogram).
Figure 12.5 shows a typical OBS for a manufacturing project such as the assembly of a prototype motor car. It can be seen that the OBS is not identical in layout to the WBS, as one manager or task owner can be responsible for more than one task.

The OBS shown is typical of a matrix-type project organization where the operations manager is in charge of the actual operating departments for ‘pay and rations’, but each departmental head (or his or her designated project leader) also has a reporting line to the project manager. If required, the OBS can be expanded into a responsibility matrix to show the responsibility and authority of each member of the organization or project team.
The quality assurance (QA) manager reports directly to the director to ensure independence from the operating and projects departments. He or she will, however, assist all operating departments with producing the quality plans and give ongoing advice on QA requirements and procedures as well as pointing out any shortcomings he or she may discover.
Although the WBS may have been built up by the project team, based on their collective experience or by brainstorming, there is always the risk that a stage or task has been
Table 12.1
forgotten. An early review then opens up an excellent opportunity to refine the WBS and carry out a risk identification for each task, which can be the beginning of a risk register. At a later date a more rigorous risk analysis can then be carried out. The WBS does in effect give everyone a better understanding of the risk assessment procedure.
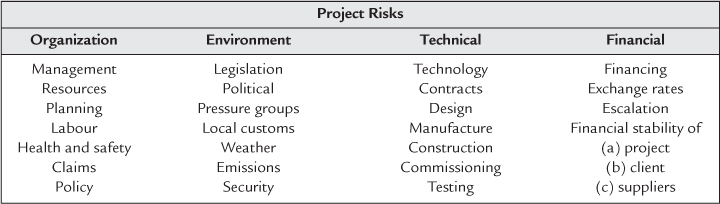
Indeed a further type of breakdown structure is the risk breakdown structure. Here the main risks are allocated to the WBS or PBS in either financial or risk rating terms, giving a good overview of the project risks.
In another type of risk breakdown structure the main areas of risk are shown in the first level of the risk breakdown structure, and the possible risk headings are listed below. (See Table 16.1 in Chapter 16, Risk Management.)
Responsibility Matrix
By combining the WBS with the OBS it is possible to create a responsibility matrix. Using the car assembly example given in Figures 12.1 and 12.5, the matrix is drawn by writing the WBS work areas vertically and the OBS personnel horizontally, as shown in Figure 12.6.

By placing a suitable designatory letter into the intersecting boxes, the level of responsibility for any work area can be recorded on the matrix.
The vertical list giving the WBS stages could be replaced by the PBS stages. The horizontal list showing the different departmental managers could instead have the names of the departments or even consultants, contractors, subcontractors, and suppliers of materials or services.