8.4. Assessing Findings
Using all the information you have collected internally and externally, you now want to summarize what you have learned and analyze your findings to produce the strategy. All programs, even those that don't involve technology, follow the same basic assessment steps: consolidate findings and analyze results.
All of the following sets of findings are real, although they are not from a single company. We will be learning from XYZ Corporation's experiences throughout the rest of this book.
XYZ Corporation is a medium-sized company founded in 1992 and headquartered in Chicago. XYZ manufactures and sells environment management equipment (electric fans), as well as environment management consulting and product support to a broad range of customers. They produce very large “systems” (combinations of their large scale 800 and 900 Series fans, plus consulting and support services) to a wide range of customers, including some of the Fortune 50 as well as many mid-sized companies around the world. XYZ also has a few products that are targeted at consumers and very small businesses. These include the very small 100 Series fans as well as portable (100P) and solar-powered (100S) models.
The XYZ examples given have all actually occurred, but for a number of companies of differing sizes, businesses, and geographic locations.
8.4.1. Summarize Findings
The starting point for the plan is the sum of all the information you've collected from customers, competitors, and your company itself. Let's review all the results from XYZ Corporation's data collection efforts.
Internal Interview
The internal interviews give us a picture of where the company is today and where it wants to be. There are two segments of the internal interview findings: interview summary and risk summary.
The Interview Summary highlights the key topics that were covered by the interviews. It is very important to clarify each major point with direct quotes you heard. The quotes will make your presentation more alive and will lend credibility to your findings with recognizable language and phrasing. It also another opportunity to let your constituents feel involved and included. Table 8-6 summarizes the key results from XYZ's internal interviews.
| Topic | Interview Quotes | Congruence |
|---|---|---|
| Business objectives | Grow revenue to $100 million Profitable growth | High |
| Business opportunities | New customer selling model: solutions, installed base, not just boxes
Execute on channel strategy. Customers are confused by our multiple channels with different messages. New vertical market product categories | |
| Business issues | Marketplace consolidation
Competitor price gouging We don't know who our most valuable (profitable) customers are. Current infrastructure doesn't support order and revenue growth targets. Improve Sales Force productivity. Too internally/product focused | |
| Stupid things we do to our customers | Can't recognize customers across all touch points. Don't know who they are.
We “sell” CRM solutions, but we don't use them. We make it difficult to do business with us (buying, selling, support). Leave money on the table (installed base upgrade and cross-sell opportunities) | |
| Customer segmentation and valuation | Industry segments no longer useful; need new approach. Partners | Low |
| What is CRM? | Customer recognized wherever he interacts
Just software: SF automation, call center automation 360° view of customer Loyalty, retention, increased sales Sales sees everything about their customers/territories Scoring/measuring customer value | Low |
| What will CRM do for XYZ? | Match cost of touch point to value of customer Can't reach financial goals without it | |
| Where should we start? What are our priorities? | Get a quick win, whatever can be quick
Customer database Personalized web sites Total touch point and system integration Sales Force Automation Customer master file (“the bible”) Segmentation strategies | Very Low |
You notice a column labeled Congruence in Table 8-6. Congruence, the level of company-wide agreement on a subject, is a very important piece of information to know for each of these key points covered by the internal interviews. Any area with a low score is a potential risk to project success. Low congruence indicates that everyone has a different set of expectations in this area. High congruence is an area of strength that can be leveraged to build understanding and support.
|

For example, if everyone in the organization knows exactly what your company business goals are, then you can leverage this strong congruence by showing how your CRM program is directly aligned with and supports those goals. If your company's view of business goals varies all over the map, then you have nothing with which to align.
The Risk Summary is the other output from the internal interviews. This is a critical, but often ignored, opportunity to prepare for the worst. If the worst happens, you can have your head in the sand and it can wipe you out, or you can be well prepared so that the impact is reduced or even eliminated. Just as people don't want to write a will because it's such a downer, many think it's too negative to focus on potential project risks. But the opposite is true: Rather than being too negative, thinking about potential risks doesn't make them happen; it helps you avoid them. If you have thought about the potential risks and understand their danger, you can identify and implement ways of overcoming or avoiding them. (Okay, the parallel isn't perfect. A will doesn't guarantee you eternal life, but at least you have some control over what happens to your “stuff” when you go.) At the very least, being aware of program risks will make you sensitive to the early signs of problems, and you can stop them before they've really derailed your program.
Each risk should be assigned an owner. This is an individual who will take responsibility for seeing that the risk is resolved by providing any necessary plans and resources. Table 8-7 lists XYZ's key risk areas.
| Risk Area | Quotes | Owner |
|---|---|---|
| Sponsorship and leadership | Need passionate executive support.
Sponsor must make a financial commitment and STICK WITH IT over the long haul. Sponsor must understand that CRM is not a quick fix and needs executive clout. Not enough people understand CRM. | Xavier |
| Planning | Not having a strategy and plan
No means of internal communication Scope creep, project management | Yolanda |
| Process | Visible benefits (stick and carrot) No culture of consistent processes | Zeke |
| Organization | Continuing with silos
Too inward focused Multiple geographies, but too UK-centric Conflicting functional business priorities | Xavier/Zeke |
| Technology | Don't have an overall technology architecture. Do we really perceive Information Technology as a strategic weapon? | Yolanda |
By the way, let me introduce you to a few members of the XYZ management team. Xavier is the Vice President of Sales and Marketing. XYZ is lucky that he is a charismatic leader and a very involved executive sponsor for the program. Yolanda is the Chief Information Officer. Yolanda has an MBA and has had extensive experience in business planning, finance, and IT management before taking on the CIO role. Zeke is a senior marketing manager for one of XYZ Corporation's product lines and has been assigned the organization-wide responsibility for CRM.
System Inventory
Through the internal interviews, we learned about the systems that are part of the company's IT infrastructure, as well as those that are being built on or run outside of the IT mainstream. We'll gather this knowledge of projects that don't have official status by asking about CRM-related programs and touch points instead of IT. Armed with this knowledge, the team will contact each of the project owners and complete the system inventory.
The system inventory gives us knowledge of where we collect customer information today. Most companies have hundreds of customer databases, many of which are redundant, inconsistent, or out of date, with more being planned. Large companies are likely to number their customer databases in the thousands. Even small companies often have multiple customer files. Each employee generates his or her own account lists, e-mail directories, and spreadsheets to support his/her business. In Table 8-8, we see XYZ's systems inventory.
| System Name | Status | Purpose | Function | Information | Package |
|---|---|---|---|---|---|
| COSMIC | Live | Order administration | Corporate Marketing | Customer
Company Product Sales-$ Discount-$ | Home grown |
| OM CENTRAL | Live | Order Customer Master | Corporate Marketing | Customer
Company Contact points | Home grown |
| SFA | In development | SF Automation | Consumer Sales | Customer
Account Territory Deals Channel | Package A |
| CRM | Planned | SF Automation | Business-to-business sales | Customer
Company Account Territory Deals | Package B |
| CRM | Planned | Call center | Support | TBD | Package B |
XYZ is actually fairly lucky; many companies have several hundred customer systems distributed throughout the organization.
Customer Assessment
The customer assessment is compiled from your external surveys. After you have defined the life cycle of your customers and identified current (and potential) touch points, you will ask your customers which of these are important supports for each step of their life cycle. Figure 8-5 shows the relative priorities for one of XYZ's customer segments.
Figure 8-5. XYZ's customer-prioritized touch points
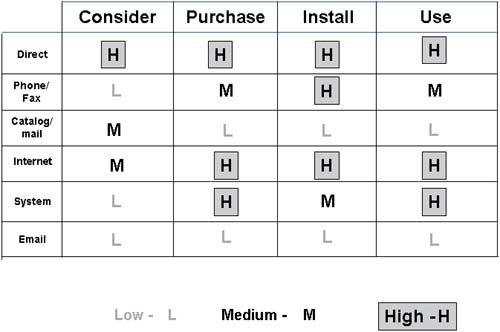
This diagram summarizes average responses from all customers on the importance of the touch point for each stage of the customer life cycle. Later, we will use it to help us set our project priorities.
The Competitive Assessment
The competitive assessment is also created based on feedback from customers and secondary research. Note that there may be cells for which we have no information. Some of these missing cells are not important enough to pursue (such as mail or e-mail during the purchase stage). Others, like mail and e-mail during consideration, we want to continue working on. But what's important for now is that we have enough information to get started in understanding how we're doing compared to the competition. Figure 8-6 shows XYZ's relative position compared to its competitors as judged by customers and the marketplace.
Figure 8-6. Competitive assessment

Together with the customer survey information, the competitive assessment helps us understand where we need to start.
8.4.2. Analyze Findings
Next, we must analyze all these findings to help us determine what needs to be done, when it needs to be done, and the how it needs to be done.
Priorities
To help identify your priorities, you will look at several factors. The first piece of information comes from combining data collected from the two external assessments. Figure 8-7 illustrates this technique. Start with the Customer Performance Rating, and highlight the cells that the customer indicated were of high importance for that phase of the life cycle.
Figure 8-7. XYZ customer identified priorities and gaps

If you're already doing better than competitors in certain areas, then even if your customers aren't delighted, you may not need to start there. You'll probably want to start your program in an area where you're not doing so well. Sure, the area in which you're outstanding is a competitive advantage, and you want to maintain that advantage. If the competition is catching up, then you may want to widen your lead. The point to remember is that the competitive assessment step will give you the information you need to make objective decisions about where to start and where to go next.
Gaps
The customer touch point matrix provides a picture of the various media that your company is currently using to interact with your current customer segments. Figure 8-8 shows XYZ's customer experience matrix for two of its original industry segments and for consumers.
Figure 8-8. XYZ's customer touch point matrix for three segments

As you can see, XYZ discovered that there was virtually no difference in the way it was delivering industry experiences; that's one of the reasons they decided to rethink their segmentation strategy – they weren't using it anyway!
Using the touch point matrix and the customer priority matrix, we can identify those areas which we are not taking advantage of and which the customer finds to be most important. We also can identify the areas in which we are doing the poorest in comparison to our competitors. These two tools form the basis from which all future CRM projects can be prioritized and measured. Any project that might touch the “large business” segment must be governed and measured by this Customer Experience Map.