CHAPTER 2
Process Management and Process-Orinted Improvement Programs
Although the focus of this book is on analytical process modeling, evaluation, and design rather than implementation and change management, it is clear that the best design in the world is of little interest unless it can be implemented and managed successfully. Therefore, this chapter will look at the governing principles behind successful process management, which is at the core of all the process-oriented improvement programs that have surfaced over the last couple of decades. We also will take a closer look at the basic ideas behind two of the most influential programs of this sort in recent years.
The list of candidate approaches can be made long and covers many of the buzzwords that have appeared in the management arena in recent times: JIT, TQM, TQC, Lean Manufacturing, Quick Response, BPR, ABM/ABC, and Six Sigma. The ones we will examine are Six Sigma, which is a state-of-the-art quality-improvement program, and business process reengineering (BPR), which has its roots in strategic management. The rationale for choosing these approaches is, first of all, that they appeared on the managerial radar screen fairly recently. Second, they stem from different business disciplines, illustrating the wide impact of the process view. Third, they do not have a clear manufacturing focus but rather an emphasis on business processes in general.
It should be noted that sometimes process management in itself is considered a specific improvement program developed at IBM during the 1980s. Without diminishing the importance of the work performed at IBM, we will use the term process management in a generic sense to mean a collection of basic principles, guidelines, and insights for how to manage processes. The last part of the chapter contrasts the revolutionary change tactic for implementing a new process design advocated by the BPR movement with a more evolutionary approach used successfully by many companies.
2.1 Process Management and the Power of Adopting a Process View
Process management, as defined in this chapter, deals with the issues of managing, controlling, and improving processes. Process design is an important element in successfully managing a process; however, so are the implementation of the design and the continuous improvement and control systems necessary to reach a desirable level of process performance. Another important aspect is managing the people involved in the process.
Process management originated in the field of modern quality management. The focus on processes and process control is a fundamental component of quality management today and an integral part of the ideas put forward by its founders: Deming, Juran, Crosby, Feigenbaum, and Ishikawa. The power of adopting a process focus was made all too obvious by the Japanese during the 1970s and 1980s when they expanded the notions of quality and productivity to completely new levels.
The strength of adopting a process view and the importance of process management uncover the weaknesses of functional organizations. Although the functional structure has many virtues, not least of which is achieving economies of scale and scope, it has the inherent weakness of fostering a focus on skills and resource utilization rather than work output. As mentioned in Chapter 1, this tends to lead to suboptimization of resources due to insufficient coordination and transparency of the overall process. According to Melan (1993), this tendency can be further explained by the following conditions that are usually built into the functional structure.
- Reward systems that promote the values and support the objectives of the functional department rather than the business in its entirety. For example, the performance of an employee in the manufacturing department might be based on his or her output quantity. However, the quality of the output is deemed more important for the firm, which must satisfy customer requirements.
- Group behavior, which encourages a strong loyalty within the department and an “us versus them” attitude toward other departments within the firm.
- Strong cultural and behavioral patterns within a function. These patterns can differ across departments, reinforcing the “us versus them” mentality.
- A high degree of decentralization, creating “firms within the firm,” each with its own agenda.
The deficiency of the functional organization in terms of suboptimization due to lack of coordination also has been discussed extensively in the organizational literature. To quote Mintzberg (1979), “The functional structure lacks a built-in mechanism for coordinating the workflow” and has given rise to concepts such as matrix and project organizations.
A process focus remedies the issues of coordination and transparency by creating a clear emphasis on work output and the fact that this output must meet the customers’ requirements. In terms of people management, adopting a process view means that the process structure needs to be made clear to everyone involved. This increased transparency tends to improve the employees’ understanding of how their efforts fit into the big picture and why their contribution matters. This, in turn, is usually a good way to make people feel proud of what they do. Pride encourages involvement and participation, a cornerstone in modern quality management and a stepping-stone for successfully empowering the workforce. Another effect of adopting a process orientation is that it helps break down barriers among departments and hampers the “us versus them” attitude by creating a sense of loyalty to the process and everyone involved.
Historically, quality management has focused largely on the manufacturing sector. It was not until the broader concept of Total Quality Management (TQM) got wide recognition in the mid to late 1980s that the principles of quality management and process thinking were applied to a significant degree in the service sector. The principles of process management, therefore, have been drawn primarily from managing manufacturing processes. However, time has proven them equally valuable in managing service processes. The explanation is that the main challenges with process management lie in the focus on workflow; that is, how a job moves through an organization. Whether the job is a product or a service is inconsequential, at least as far as the basic principles of process management are concerned.
Having acquired a general understanding about the purpose of process management and why process orientation is a powerful approach, the next step in understanding what successful process management entails is to identify the characteristics of well-managed processes. According to Melan (1993), the core principles for successful process management involve the following.
- Establishing process ownership.
- Analyzing boundaries and interfaces.
- Defining the process by documenting its workflow.
- Identifying control points and measurements.
- Monitoring the process for control purposes by implementing the measures.
- Taking corrective action and providing feedback if deviations indicate that the process is no longer in control.
Based on these core principles, the road to successful process management of an existing process can be divided into three phases: Phase I, initialization; Phase II, definition; and Phase III, control (See Figure 2.1.)
Subsections 2.1.1 through 2.1.3 are devoted to an in-depth investigation of what these phases entail. Section 2.1.4 provides an illustrative example of a document distribution process. The exposition in these subsections is largely based on the work of Melan (1993).
2.1.1 PHASE I: INITIALIZATION
The purpose of the initialization phase is to appoint a process owner or process manager and to define the boundaries and interfaces for the process; that is, its entry and exit points. In other words, the objectives of the initialization phase are to clarify the scope of the process and to determine who will take responsibility for it. (See Figure 2.2.)
Process Ownership
In order to make things happen in any organizational structure, someone must be in charge. Processes are no exceptions. Lack of accountability tends to paralyze the decision-making process and at best leads to uncoordinated actions pulling the process in different directions. Comments like “It’s not my responsibility” and “Don’t blame me, it’s their fault” are symptomatic of a process without an established process owner.

FIGURE 2.1 The Basic Principles of Process Management

FIGURE 2.2 The Initialization Phase
The difficulty in assigning process ownership is essentially a function of process complexity, culture, organizational structure, and management attitudes. Typically, cross-functional processes in decentralized organizations with uninterested management pose the greatest challenge.
Ownership in general implies possession; consider, for example, ownership of a factory. However, process ownership usually does not imply possession of the resources used by the process. It refers to the responsibility and accountability for the work performed within the process and for the process output. More precisely, the critical duties facing the process owner include the following.
- Be accountable and have authority for sustaining process performance and, when necessary, for implementing changes.
- Facilitate problem resolutions and make sure action is taken.
- Mediate jurisdictional issues among functional managers with authority over different activities or resources in the process. For example, in order to meet the delivery dates, the sales manager wants the employees in the paint shop to work overtime. For budgetary reasons, the paint shop manager opposes this. The owner of the delivery process needs to step in and mediate the issue.
Because of differences in culture, organizational structure, operating environment, and personal relationships, no definite rules can establish how to identify and assign process ownership in an effective way. It needs to be done on an individual, case by-case basis. However, some general guidelines suggest that the process owner can be the manager with the most resources invested in the process, the manager who is most affected if the process does not work as intended, or simply the manager who does the most work directly related to the process. In any case, it is important that the process owner has a high enough position in the organization to see how the process fits into the larger scope of the entire business.
For processes contained within a work group, a department, or a function, it is usually fairly easy to find a suitable process owner. The logical choice is the manager who is already responsible for a majority of the activities and resources involved in the process. Matters generally become more intricate in situations where the process transcends different geographical locations or functional, organizational, or national boundaries. For these types of processes, the process owner often has to come from the top management layer in order to muster enough clout to fulfill the process owner responsibilities mentioned previously. For example, it is not unusual that corporate vice presidents are assigned ownership of core business processes. It should be emphasized that although assigning ownership is a requirement for successful process management and process improvement, it also requires process owner commitment and involvement. The process owner is not just for show; that person needs to be engaged and take charge.
Establishing process ownership is closely related to determining the scope of the process, meaning its boundaries and interfaces. In some cases, it might even be better to clarify these issues prior to appointing a process owner.
Analyzing Process Boundaries and Interfaces
As discussed in Chapter 1, process boundaries define the entry and exit points; that is, the points where input flows into and output flows out of the process. The boundaries provide a clear picture of the process scope. For example, an order delivery process might begin with the receipt of a customer order via fax and end with a truck delivery to the customer’s doorstep. In this case, the receipt of the fax constitutes the input boundary or entry point, and the output boundary or exit point is when the product is left on the customer’s doorstep. Defining boundaries is necessary in order to assign process ownership properly and to identify the process’s external interfaces: the input interface with the suppliers and the output interface with the customers.
Internal interfaces, on the other hand, represent handoff points within the process boundaries. Typically, the most critical internal interfaces are where the process crosses organizational or functional boundaries with different managers (i.e., when the job or workflow is handed off from one department or business unit to the next). However, any handoff between activities, individuals, work groups, or other resources does represent an interface. Because most workflow problems are caused by insufficient interface communication (i.e., lack of coordination), it is important to identify critical interfaces early.
A useful approach to deal with interface-related workflow problems is the customer-producer-supplier (CPS) model, which is based on the simple premise that a producer’s output should satisfy the customer’s requirements. Notice that this is closely related to the definition of a business process provided in Chapter l. The CPS model has three agents: the supplier who provides the inputs, the producer who transforms the input into value-added output, and the customers who are the recipients of the output. The interactions among these agents can be divided into three phases: the output requirement phase, the production capability phase, and the input requirement phase. (See Figure 2.3.) A fundamental principle in the CPS approach is that all requirements must be mutually agreed upon by the parties involved: the producer and the customer, and the supplier and the producer, respectively.
The output requirement phase is the first step in the CPS approach and involves defining and reaching an agreement on the customer requirements for the final process output. To avoid misunderstandings and costly rework procedures, the customer requirements should be documented carefully. Methods for analyzing and documenting requirements include the following.
- Word descriptions of a qualitative or quantitative nature; for example, “The service should be timely, respectful, error free, and not cost more than $50.”
- Graphical and quantitative specifications; for example, blueprints or pictures shown to a hairdresser.
- Attribute lists of qualitative or quantitative characteristics; for example, the service experience at a barbershop can be described by the following list: comfortable chairs, short waiting time, maximum cutting time of 30 minutes, fashionable hairstyles to choose from, and price less than $20.
- Information flow charts, which are particularly useful in software development and data processing, specify data types, frequencies, and so on.
- Deployment matrices, which represent basic variants of the well-established quality function deployment method (QFD), widely used in product and service design for translating customer requirements into product and service characteristics. See, for example, Hauser and Clausing (1988) and Mizuno and Akao (1994).

Having acquired a good understanding of the customer requirements, the next step in the CPS approach is the production capability phase, during which the producer assesses the process capabilities to see if it can meet the customer requirements. If the process is unable to match the requirements, the producer has to renegotiate the requirements with the customer or change the process. For example, Joe in accounting is required to present a budget report on the 25th of every month. To complete the report, Joe needs data from several sources within the company 1 week before the report is due. At the moment, these inputs are often late and incomplete, preventing Joe from completing his report on time. To resolve the situation, Joe must renegotiate the output due date with his customers, renegotiate the input data due dates with the suppliers, or change the process to shorten its lead time.
The final step in the CPS approach is the input requirement phase, during which the producer negotiates with the suppliers to agree on the input requirements necessary to satisfy the producer’s needs. The input requirements usually revolve around cost, timeliness, quantity, and quality characteristics. It is not unusual for the customer to be one of the suppliers also; for example, a customer might provide information in terms of a blueprint for a specified product to be produced.
The three phases of the CPS model are interrelated and although conceptually described as a sequential process, they usually have to be performed iteratively in order to result in a well-coordinated process. By applying the CPS model to all critical interfaces, we adopt a view of the process as a chain of customers where coordination across interfaces is the result of a thorough understanding of internal and external customer requirements.
2.1.2 PHASE II: DEFINITION
After assigning process ownership and defining the process scope, the next step to successful process management is to acquire a thorough understanding of the process work-flow, the activities, and their precedence relationships (see Figure 2.4). More precisely, the objective of the definition phase is to document the activities and workflow that constitute the process and thereby facilitate communication and understanding regarding operational details for everyone involved in the process. Also, understanding how things are working currently provides a baseline against which to evaluate process improvement.
A simple but important rule in order to manage and improve a process is that one must first understand it. Often just defining and documenting a process will reveal some obvious inefficiency, such as the existence of redundant or non-value-adding activities. In fact, many redesign projects never go beyond this rudimentary level of analysis.
The question that remains is how to document the process in a way that leads to detail the documentation of the work content in activities and tasks. These descriptions are referred to as operating procedures or standard operating procedures. Unfortunately, these documents tend to be fairly lengthy and not overly reader-friendly; on the other hand, they usually contain detailed information (which may or may not be up-to-date).
The preferred way to document entire processes regarding how the work flows between activities is to use some type of flowchart-based method, meaning a combination of graphical and verbal description. A wide range of different graphical tools for describing processes and workflow is discussed in Chapter 4, including general process charts, process activity charts, process flow diagrams, and general flowcharts. The first step toward having something to document is to gather information about the process. Common information-gathering techniques include the following.
- Individual or group interviews with people working in the process.
- Analytical observation (i.e., following people around and documenting what they do).
- Review of relevant documentation (e.g., existing operating procedures).
It is worth emphasizing that although information gathering and documentation appear to be disjointed activities, they often are hard to separate. For instance, an efficient technique in interviewing employees about what they do is to draw simple flowcharts together with them. The graphical picture helps them sort out what tasks they really perform.

FIGURE 2.4 The Defination Phase
To summarize, defining a process a two-step procedure.
- Identify the process boundaries, input, and output.
- Collect information about the work performed in the process, define activities, and describe the workflow (i.e., the network of activities and the path a job follows) using some type of graphical tool.
2.1.3 PHASE III: CONTROL
After assigning ownership, setting boundaries, aligning interfaces, and defining activities and work flows, the last phase of successful process management is to establish a system for controlling the process and providing feedback to the people involved. As shown in Figure 2.5, the process control phase can be divided into three steps: establishing control points, developing and implementing measurements, and obtaining feedback and exercising control.
Establishing Control Points
Control points are activities such as inspection, verification, auditing, measuring, checking, or counting. In Chapter 1, we saw that these activities often are referred to as business-value-adding, meaning activities that are essential for the business but not something for which the customer is willing to pay.
Control systems are essential to any operation or organization. Without them, managers have no way of assessing the effects of their decisions, and therefore no way of knowing whether the organization or process is heading in the right direction. If no control points are established within the process, the only means of assessing the process performance is to rely on customer feedback. Although extremely important, the purpose of the process is to satisfy the customer requirements; therefore, sole reliance on customer feedback leaves the process in a reactive rather than proactive mode. Poor quality is discovered too late when the work has already reached the customer and jeopardized future business because customers are unsatisfied and annoyed. Handling rework and returns at this stage also is costly. In service industries, the situation is even more sensitive because only limited opportunities are available to correct a service after the fact. For example, the barber cannot put the hair back and start over if the customer is not satisfied. The only way to assure quality is to correct and control the process itself, which requires in-process control points. To avoid unhappy customers, the barber should verify that a customer wants to have his or her hair no longer than half an inch before it is cut off.

FIGURE 2.5 The Control Phase
The location of control points within a process depends on two factors: how critical it is for the customer satisfaction that a certain activity is performed as intended, and feasibility, meaning how physically and economically feasible it is to install a control point at a specific point in the process.
Developing and Implementing Measurements
Having established the control points, the next question is what to measure. For proper control, the measurements should be meaningful, accurate, timely, and useful. Collecting the measurements may involve complete inspection or sampling techniques. In either case, the measurements can be categorized into the following five types.
- Measures of conformance, which imply verification that the work conforms to a given specification or requirement.
- Measures of response time, which focus on the time it takes to complete a sequence of activities. Response time is often referred to as lead time or cycle time.
- Measures of service levels, which focus on the degree to which a service or resource is available to a user or customer. For example, the service level at a storage facility is often measured as the fraction of customer orders in a replenishment cycle that can be filled upon request.
- Measures of repetition, which refer to the frequency of recurring events, such as the number of times a job needs to be reworked before it is approved.
- Measures of cost, which for control purposes often include the “cost of quality.” This cost refers to the cost of waste, which traditionally is divided into three major components: prevention costs associated with preventing future nonconformance, appraisal costs associated with detecting nonconformities, and failure costs, which are the costs of dealing with nonconformities including scrap and rework warranties. A distinction also can be made between internal and external failure costs. The internal failure costs are due to rework within the organization, so only internal customers are affected by the defects. External failure costs occur when the nonconformities affect external customers. These costs are usually more severe because they involve warranties and the potential loss of future business in addition to the immediate rework costs.
The broader issue of measurement implementation typically involves answering the following questions.
- What is to be controlled and measured? What are the critical factors or the most important customer requirements? For example, a critical factor for FedEx is response or cycle time.
- What is currently being measured? Are recent data available that can be used to determine the measure?
- If no measurement data are readily available, can a business case be made for installing a new measurement system?
- Given the chosen measurement, what is the appropriate sampling method? What sample sizes should be used, and what should the measurement frequency be?
In order to leverage the full potential of any measurement data for identifying problems and changes in process performance, the data need to be analyzed statistically and then displayed graphically. In other words, the data must be converted into useful information. Examples of the most common types of statistical charts are bar charts, pie charts, histograms, Pareto charts, box plots, and scatter plots. However, the predominant tool for process control is the well-known process control chart, also called as the Shewhart chart.
Feedback and Control
It is critically important to provide feedback and take corrective action in response to detected process deviations in order to stabilize and improve the process. The objectives of corrective actions are either regulation or improvement. Regulation, or control, aims at maintaining the process performance at a certain level; improvement is intended to reduce variability so the process is more predictable or to raise the average performance level. If mechanisms for regulation and improvement are lacking, the process could become unstable and degrade over time.
An important enabler for corrective action is feedback. The people in the process need to be aware of how the quality of their work affects the overall process performance, and how errors in their work impact the downstream activities (i.e., internal customers) and ultimately the external customer. However, it is extremely important that the process owner is sensitive to how feedback is provided. When it is given in a constructive manner, employees usually perceive feedback as a positive action and will display interest and concern for the information, as well as for the process. This tends to make people feel that they matter and encourages them to get more involved. In some cases, employees will suggest ways to improve their work and the process performance. Getting everyone involved and committed to their work and the process is one of the keys to successful process management. On the other hand, if feedback is given in a punitive manner, it will alienate employees and can do more harm than good.
2.1.4 AN ILLUSTRATIVE EXAMPLE: MANAGING A DOCUMENTDISTRIBUTION PROCESS
The following example adapted from Melan (1993) illustrates the basic principles of process management discussed in this chapter thus far.
Joe recently started his new position as associate manager of the business development department, with special responsibility for strategic planning. In January and in June, Joe is now responsible for formulating and issuing copies of the company's strategic plan to the firm’s key managers. In fact, this is one of his more important functions. The managers then have to respond to Joe within 2 weeks regarding a wide range of strategic issues before the plan can be finalized. The importance and visibility of this document mean that any kind of problems with the process will reflect badly on Joe personally and on his department.
In early January, copies of the document were delivered from the print shop. Joe’s staff then sorted the documents, put them in envelopes addressed to the designated managers, and left them to be picked up by internal mailing services. The address to each manager eligible to receive a copy was easily available from a distribution list kept by the departmental secretary. No mailing problems were reported to Joe. By mid-January, only four managers had responded to Joe, who was disappointed and embarrassed to report to his manager that he would not be able to finalize the strategic plan before the agreed deadline. He then immediately began making phone calls to the 24 managers who had not responded and was astonished by their responses.
- Three had not yet received the document.
- Two had just received the document at their new location.
- Seven complained about missing pages.
- Four reported pages out of sequence.
- Five said they could not respond in only 1 week.
- Three had left the organization.
The following day, Joe received a message from his manager to be in his office the next morning with an analysis of the problem and an action plan for how to avoid this type of debacle in the future.
Clearly, this process was not well managed. The following pages will discuss how the basic principles of process management can be used to improve it.
Assign Process Ownership
It is clear that Joe is the manager responsible for formulating and distributing the strategic plan document. Although he has no managerial control over the print shop or the mailing services, he is perceived as the owner of the entire process by his managers and is held accountable for its failure. Neither the print shop nor the mailing service is aware of its role in the process and that Joe is the owner of the process; they just perform an operation without understanding its impact. This is why it is important to clarify to all parties involved who the process owner is.
Analyze Boundaries and Interfaces
With the process ownership in place, Joe needs to analyze the process boundaries and interfaces. Based on the detected problems, he decides to focus his attention on the document distribution process starting when the print shop receives the original document to be copied and ending when the mailing services deliver the mailed copy to the managers. Joe also defines two critical internal interfaces: the first one when the job (i.e., the copies) leaves the print shop and is handed off to his staff and the second one when the addressed envelopes are handed off to the mailing service. The external interfaces coincide with the boundaries. Furthermore, it should be noted that for the document distribution process, the input to the print shop is the original master document, and the supplier is Joe’s department. The customers at the other end are the managers who are to receive a copy of the document. A high-level flowchart describing the process along with its boundaries and interfaces is given in Figure 2.6.
From the telephone conversations Joe had with the managers, he can conclude that many of the problems are related to the critical interfaces and lack of communication and coordination across them. Delivery delays and poor quality of the document copies appear to be the main issues. To approach the interface problems, Joe decides to use the customer-producer-supplier (CPS) model, starting with the requirements of the final customers and working his way back through the process. The phone conversations with the managers who received the copied document (i.e., the final customers) revealed that they have two main requirements: a perfect copy of the document and 2 weeks to prepare a reply. Following the CPS model, Joe now focuses on the production capabilities of the mailing services. A manager at mailing services informs Joe that in order for mail to be distributed the next day, the sender must take it directly to the mail room. If it is left at the department to be picked up by mailing services, it takes an additional day before the envelopes are delivered to their recipients. Furthermore, if the mail is going to one of the company’s satellite locations, which is the case for several managers on Joe’s distribution list, it might take up to 4 days until the envelopes are delivered, assuming they are brought straight to the mail room. In the current process, the envelopes were left at Joe's department and the assumption was next-day delivery.

The input to mailing services is the addressed envelopes supplied by Joe's department. Consequently, following the CPS model and assuming Joe intends to continue using internal mailing services, the supplier requirements indicate that Joe needs to deliver the copied documents to the mail room 4 days earlier than what was done this time in order to satisfy the customer requirements. Another option would be to use an external courier, but Joe has no room in his budget for that. He also could change the mailing services process to shorten the delivery time, but Joe has no managerial jurisdiction over mailing services, so this is not a viable option either.
The next interface of interest is that between Joe’s department and the print shop, where the former is the internal customer to the latter. The requirements posed by Joe’s department are linked directly to the end-customer requirements: The copies should be of good quality and be delivered promptly. The manager of the print shop informs Joe that for a large size document such as the strategic plan, a 2-day lead-time is to be expected. A rush job increases the risk of receiving bad-quality copies. When the last job was done, Joe’s secretary, not understanding the production capabilities, requested “same-day service” but Received the copies 2 days later. Also, the print shop staff noticed a reversed sequence of page numbers but assumed this was desired because that was how the original master document was arranged. The print shop just copies the master document as is. Assuming that Joe will continue using the print shop, understanding the print shop’s capabilities renders some clear requirements on the supplier of the master document, which is Joe’s department: The document must be in perfect shape and be delivered to the print shop 2 days before it needs to be sorted, addressed, and put in envelopes.
To summarize, applying the CPS model has revealed some important requirements that Joe’s department must take into account in order to get the copied documents out on a certain day. Basically, the print shop needs the master document delivered in the morning of day 1, and the master document must at this point be in perfect shape because it is copied as is. The print shop delivers the copied documents to Joe’s department in the morning of day 3; then Joe’s staff has half a day to sort, address, and deliver the sealed envelopes to the mail room. Internal mailing services guarantees delivery to all locations during day 7. In addition to the timing issues that Joe must consider, his department also must pay special attention to the quality of the master document and the correctness of the distribution list.
Define the Process
Having determined the scope of the process, Joe is in a position to define the activities and workflow that are within the boundaries. The most common approach is to start with a high-level flowchart, like the one in Figure 2.6, and then create a hierarchy of successively more detailed flowcharts over the different subprocesses and activities until the right level of detail is obtained in the description. The right level is found when additional details no longer appear to offer further opportunities for improvement. In this particular case, Joe decides not to proceed beyond the high level or macro flowchart in Figure 2.6.
Establish Control Points
The current process does not contain any internal control points; as a result, Joe might not realize that something is wrong with the process until it is too late. This situation represents a high “failure cost” for Joe in terms of lost credibility within the firm. Based on the customer feedback and the analysis so far, Joe finds three instances where control points appear to make sense.
- Inspection of the master document before it is delivered to the print shop to assure that what goes to the print shop is flawless. This responsibility falls on Joe’s secretary and his other staff members.
- Inspection of the copies received from the print shop by Joe’s staff before they are put into envelopes and mailed. This is done to assure that pages are not missing and that pictures are not blurred due to quality problems in the print shop. Applying the CPS model, Joe should negotiate with the print shop and require them to change their process to avoid quality problems of this sort. This would make the inspection of the final copies redundant and save Joe some resources. However, even if Joe has enough clout to make this happen, it makes sense in the short run to install the control point to make sure the print shop process performs as intended, simply because the outcome is so important to Joe.
- Verification that the distribution list is accurate (the right people are on it and their addresses are correct). This job is appropriate for Joe’s staff. The purpose is to avoid sending copies to those who are no longer with the company or sending copies to the wrong address. The problem is magnified by the confidentiality of the strategy document.
As the quality of the process improves, these inspections will become redundant. Installing inspection points is not an efficient way to achieve quality output in the long run. However, it allows one to gather data in order to track down the root causes of problems that are occurring in dysfunctional processes.
Develop and Implement Measures
After determining the control points, the next step for Joe is to specify what to measure. Starting with the inspection of the master document at control point 1, it is important to record not just that a mistake occurred but what the mistake is. This assures that the data can be used to facilitate root cause analysis and improve the process that produces the original master document. Based on the customer feedback, it appears that the frequency of missing pages and pages out of sequence should be tracked. In addition, it seems wise to look for typographical errors, the types of mistakes, and their frequency.
Control point 2, dealing with the quality of the copies coming out of the print shop, will focus again on document quality, so the same measures should be used (i.e., frequency of missing pages; pages out of sequence; and a range of typographical errors including blurred figures, text alignment, and so on.)
For the third control point, verification of distribution list accuracy, interesting measures to track are number of address changes and the turnover of managers on the list. Joe decides to use these categorized frequency measures to track the copying and address quality.
In addition to the three internal control points, Joe also decides to solicit regular feedback from the end customers regarding copy quality and delivery time. To track the performance of the last step in the distribution process, the mail delivery, Joe also decides to record the time when the envelopes are delivered to the mailroom and then ask the final recipients in their response to the strategic plan document to specify when they received the envelope. This way, Joe will have a means to track the total distribution time because he will know when the master document was delivered to the print shop. Joe also intends to ask the managers to comment on the copying quality.
Perform Feedback and Control
An important issue for Joe is to try to improve process efficiency without compromising its effectiveness. In the proposed setup, inspection time decreases efficiency. By tracking the measurements discussed previously and using them to provide feedback to the people working in the process, he hopes to stimulate employee involvement and also put pressure on the managers of the print shop and internal mailing services by showing them data on their performance. Joe anticipates that this will stimulate them to take corrective action to improve their internal processes and eliminate the demand for inspection. In order to present the data in a pedagogical and convincing way, Joe has a wide range of charts and statistical tools at his disposal. To keep things simple, he has decided to start with basic histograms, and bar and pie charts. The data gathering will be initiated the next time the distribution process is activated in about 6 months.
Summary and Final Remarks
To complete the picture, let us review what Joe, based on the basic principles of process management, has come up with in terms of an action plan to improve process performance and achieve a well-managed document distribution process.
First, Joe will make sure that the master document is finished at least 7 working days before it should be delivered to the designated managers. He will allow them at least 2 weeks to prepare a response. Furthermore, Joe’s staff is instructed to inspect the master copy of the strategic plan, searching especially for any missing pages, pages that are out of sequence, or apparent typographical mistakes. These mistakes should be categorized and counted. The staff also needs to make sure the two-day production leadtime is taken into consideration.
Second, Joe’s staff is instructed to inspect each copy of the strategic plan for missing pages, pages that are out of sequence, and typographical errors and record the mistakes found. If enough mistakes are found and the time line permits it, the whole batch should be returned to the print shop to be redone. If there is not enough time to return the whole batch, the faulty documents will be reworked at Joe’s department and the time for this should be recorded. This rework time can easily be translated into costs and will provide Joe with some convincing arguments when providing feedback to the print shop manager. An important issue in this respect is to explain the effect of the print shop quality problems on the document distribution process and the overall strategy development process.
Third, the distribution list should be updated shortly before the envelopes are addressed. The number of changes to the list should be recorded; tracking the changes over time will help Joe decide how often the list needs to be updated. For now, updates will be done prior to every distribution round.
Fourth, the date and time that the envelopes are taken to the mail room should be recorded as a means of tracking how long they spend in the internal mailing system. To obtain the arrival times, Joe will ask that the managers disclose in their response to the strategic plan exactly when the document was delivered. He also will ask them to comment on the document copying quality.
By implementing these changes, Joe takes a huge step toward proactive process management, so he can avoid situations in which the process problems are not discovered until it is too late to correct them. Joe is also in a good position to explain to his boss at their meeting the next day what caused the problems with the document distribution process and what he plans to do to prevent future mishaps of this kind. Apart from the immediate actions to assure the effectiveness of the process in the near future, Joe also can point to the necessary long-term improvements. If the print shop and mailing services improve their internal efficiency, Joe can eliminate the inspection activities and thereby improve the overall efficiency of the document distribution process. Most likely, drastic improvements could be made to the process performances in the print shop and the mailing services if their managers were willing to rethink their entire design.
2.2 Six Sigma Quality Programs
Launched in 1987, Six Sigma was the name of a companywide, process-oriented initiative at Motorola for achieving breakthrough improvement in quality and productivity. It represented Motorola’s customized approach to quality management and was heavily influenced by the principles of modern quality thinking. The novelty with the Six Sigma approach was how these basic principles were combined into an integrated program for process and quality improvement. Because of the tremendous success of the Six Sigma approach at Motorola, rendering them the first Malcolm Baldrige National Quality Award in 1988 (the most prestigious U.S. quality award), other companies around the world-including IBM, ABB, Kodak, Allied Signal, and GE-embarked on Six Sigma initiatives of their own during the early to mid-1990s. The ongoing success of these programs has led to exponential growth in the number of prestigious global firms in a wide range of industries to adopt the Six Sigma approach. Recent examples include Ford, Compaq, American Express, Honeywell, Nokia, Ericsson, Phillips, Samsung, Johnson & Johnson, J.P. Morgan, Maytag, Sony, and Dupont. See, for example, Magnusson et al. (2000). In the meantime, the original Motorola concept has undergone some changes and evolved into what today is one of the most renowned and rapidly spreading quality improvement programs.
2.2.1 SIX SIGMA DEFINITIONS
Six Sigma can be defined as “an improvement program aimed at reducing variability and achieving near elimination of defects from every product, process, and transaction.” See, for example, Tomkins (1997). However, this somewhat narrow definition does not capture the strategic implications of Six Sigma initiatives. In a broader sense, a Six Sigma program can be described as a companywide strategic initiative for process improvement in manufacturing and service organizations. Six Sigma has the clear objective of reducing costs and increasing revenues; that is, increasing process efficiency and process effectiveness.
The Six Sigma approach is built around a project and a result-oriented, quantitative, and disciplined improvement methodology. This methodology focuses on variance reduction but also emphasizes cycle time reduction and yield improvement. The methodology usually is divided into five steps: define, measure, analyze, improve, and control (DMAIC). (Sometimes the define step is omitted and presumed to have been performed before the methodology is applied.) This methodology is embedded in a corporate framework based on top management commitment, stakeholder involvement, training programs, and measurement systems. We will look more closely at these issues, including the improvement methodology, in Section 2.2.4. However, it is worth noting the similarity between the DMAIC methodology and phases II and III in the process management framework discussed in Section 2.1.
The goal of the Six Sigma program, as it was conceived at Motorola, is to reduce the variation of the individual processes so that they render no more than 3.4 defects per million opportunities. To explain this further, we need to recognize that any product or process characteristic that is measured has some desired target value, T, and some upper and/or lower specification limits, USL and LSL, respectively. If the measured characteristic falls outside these limits, the product or service is considered defective. Furthermore, there is variation in any process output, so the measured characteristic will not be the same for every unit of output. Assuming that the distribution of process output follows a normal distribution with population mean, µ, and standard deviation, σ, Six Sigma Quality refers to a situation in which the distance between the target value and the closest of the specification limits is at least 6σ. See Figure 2.7. The number 3.4 defects per million opportunities is obtained as a one-sided integration under the normal distribution curve beyond 4.5σ from the process mean, µ. The explanation for this construct is that theprocess mean, µ, is allowed to shift over time and deviate from the target value by as much as 1.5σ. It is worth emphasizing that not all companies using Six Sigma programs choose to adhere to these particular numerical goals. An overarching Six Sigma objective is to achieve near elimination of defects, but ultimately it is up to each individual company to define what they consider “near elimination.”

FIGURE 2.7 The Technical Definition of Six Sigma Quality as Achieved When the Distance Between the Process Target Value and the Closest Specification Limit Is at Least Six Standard Deviations (sigma), and the Process Mean Does Not Deviate More Than 1.5 Sigma from the Target Value, T
2.2.2 THE SIX SIGMA COST AND REVENUE RATIONALE
A characterizing feature of Six Sigma that distinguishes it from most other quality management initiatives is its fierce focus on bottom line results. The top priorities and explicit objectives in every Six Sigma project are to decrease costs by improving process efficiency and to increase revenues by improving process effectiveness. The success of Six Sigma and the reason it is heralded in corporate boardrooms is its ability to achieve these goals. To acquire a better understanding of Six Sigma, we need to take a closer look at how its process improvement program is related to the underlying cost and revenue rationale.
The Cost or Efficiency Rationale
In simple terms, a firm’s profit or bottom line is given by its revenues minus its costs during a specified accounting period. Consequently, by decreasing costs, a firm experiences an immediate positive effect on the bottom line. Clearly this is the logic behind all efficiency improvement programs and cannot be attributed to Six Sigma alone. However, Six Sigma does bring an aggressive and focused approach to the table, based on attacking all types of costs, including labor costs. However, to assure cooperation and involvement from employees, Six Sigma ensures that the labor cost reductions are realized through increased productivity instead of layoffs.
A fundamental principle is that every improvement project must render measurable cost savings and every training course must include cost-cutting projects. To further understand the Six Sigma approach to cost reduction and improved process performance, it is helpful to consider the dimensions of variation, cycle time, and yield. This ultimately will lead to the efficiency or loop summarizing the cost rationale.
Variation is embedded in any process through the input used and the actual work or transformation being performed. A key operative objective in Six Sigma (see the technical definition in Section 2.2.1) is to decrease process variation and thereby increase quality and reduce costs. The first step to achieving this is to measure and gather data on important process, product, and/or service characteristics. In order to quantify and track the variation in these characteristics, the data need to be statistically analyzed and visualized graphically. After the measuring system is in place, the focus is placed on identifying the sources of variation.
Based on what is causing it, the variation usually is divided into two types: common cause variation and special cause variation. The latter, also referred to as nonrandom variation, typically is due to relatively few identifiable causes but tends to produce large, unpredictable contributions to the overall variation. Some recurrent special causes of variation are differences in the quality of input material from different suppliers, faulty equipment, and process tampering due to bad measurement systems or inadequate training of employees. The first step in reducing the overall variation is to eliminate the special cause variation by attacking its roots. The random or common cause variation, on the other hand, is typically the result of many contributing sources such that it is considered inherent in the process and can be affected only by implementing a radically new design.
Three important concepts in understanding the impact of variation on process performance are dispersion, predictability, and centering. In general terms, large dispersion refers to large variation or variability in the measured process characteristics. Predictability implies that the process characteristics over time belong to the same statistical distributions. In other words, a predictable process is considered to be in statistical control, meaning that over time the measured characteristic belongs to the same statistical distribution; that is, with the same mean and dispersion (often measured in terms of standard deviation). Given a process in statistical control, the dispersion refers to the width of the distribution; high dispersion implies that it is more likely to end up far away from the process mean. Centering refers to how well the mean of the process distribution is aligned with the target value. Ideally, we would like the process to be predictable, and the corresponding distribution should have a low dispersion and be well centered.
The standard approach for variability reduction in Six Sigma is as follows.
- Eliminate special cause variation to reduce the overall dispersion and bring the process into statistical control (i.e., improve the predictability).
- Reduce the dispersion of the predictable process.
- Center the process to target.
The Six Sigma philosophy is well in line with Deming’s mantra of striving for continuous improvements, as well as Taguchi’s perception that any deviation from the process target value will cause excess costs.
The tools used in Six Sigma approaches to reduce variation are the same as in traditional quality and process control: the 7QC tools and factorial experiments. These tools will not be explored further in this book. The interested reader can turn to any basic textbook about quality control or quality management, such as Foster (2001) or Evans and Lindsay (2002).
Cycle time and yield are important characteristics of any process. The cycle time is the time a job spends in the process, sometimes also referred to as process or production lead time. The process yield or productivity is the amount of output per unit of input or per unit of time. Consequently, cycle time and yield can be used to describe a variety of process performance aspects including input material, equipment utilization, setup times, lead times, capacity, and productivity.
Six Sigma improvement projects that focus on cycle times and yield follow the same approach as for variation, namely to gain predictability, reduce dispersion, and center with target. However, when it comes to centering, the target is usually more broadly defined in order to minimize cycle time and maximize yield improvement. For example, consider the operations of a regional distribution center (DC) where trucks arrive with incoming goods. At the DC, the trucks are unloaded and then reloaded with outgoing goods before they depart. For scheduling purposes, it is desirable to have trucks stay the same amount of time at the depot. The cycle time—the time a truck spends at the DC—is currently 2 ± 0.5 hours. Improving the performance in terms of predictability and reduced dispersion means that the trucks would depart more consistently in 2-hour intervals. To improve the centering, we would like to reduce the average cycle time without increasing the dispersion. Tentatively, by changing the unloading and loading process, perhaps by acquiring more or better forklift trucks, the average cycle time could be reduced to 1.5 hours, increasing the number of trucks and the tonnage handled by the DC on a daily basis. In Six Sigma companies, this type of improvement would be recorded in terms of the cost savings due to the increased capacity and in terms of the reduced variability.
The focus on cycle time and yield is not unique to Six Sigma; it has been emphasized by many business improvement programs including Lean Manufacturing, Time Based Management, Business Process Reengineering, and Activity Based Management. However, Six Sigma adds the important requirement that improvements in average cycle time or yield must not be made at the expense of increased process variability.
The Six Sigma cost rationale can be summarized by the efficiency loop (sometimes called the bottom line loop) illustrated in Figure 2.8. Improvement projects lead to cost savings by targeting the dimensions of variation, cycle time, and yield. Moreover, lower costs lead to increased profits. To complete the loop and achieve long-term effects, the last component is commitment to the Six Sigma initiative and to individual improvement projects. Without commitment from top management and other stakeholders, the Six Sigma initiative will not survive. Therefore, a core concern in Six Sigma is to generate this commitment and attention. An efficient Six Sigma strategy in this respect is to report the cost savings of every individual improvement project directly to top management.

FIGURE 2.8 The Six Sigma Efficiency Loop
The Revenue or Efficiency Rationale
Determinants of a company’s revenues are its sales volume, closely related to its market share, together with the prices it can charge for its products and services; both are highly dependent on the level of customer satisfaction. To put it differently, the firm’s ability to generate revenues is contingent on how well it can satisfy the external customers’ requirements and desires. According to Motorola, GE, and other Six Sigma companies, the Six Sigma recipe of improved process performance in terms of predictability, small dispersion, and good centering of characteristics important to the customers has been successful in this respect. The key to success is the focus in every improvement project on identifying and meeting the customer requirements, internal as well as external. An important concept in this respect is the CPS model discussed in Section 2.1. A critical insight is that the measured characteristics must be important not only for the process internally but also for its external customers.
To identify customer requirements and translate them into product and service characteristics, Six Sigma advocates the use of Quality Function Deployment (QFD). The customers are then asked not only about their critical requirements but also about the desired target values and specification limits for these requirements. The same approach is used whether the customers are external or internal. However, as discussed in Section 2.1, the internal customer requirements must be aligned with those of the external customers, who ultimately generate the revenues. A rigorous measurement system to make sure the processes consistently match the defined characteristics—produce few defects in the eyes of the customer—is another important ingredient in the Six Sigma pursuit of increased revenues.
The revenue rationale can be summarized by the effectiveness loop (sometimes referred to as the top line loop): Improved customer satisfaction leads to increased market share and larger sales volumes as well as a potential to charge higher prices, together implying increased revenues. Combining the effectiveness loop with the efficiency loop, as shown in Figure 2.9, summarizes the Six Sigma Cost and Revenue Rationale.
2.2.3 SIX SIGMA IN PRODUCT AND PROCESS DESIGN
Six Sigma has proven to be a successful strategic initiative for improving process performance when considering the dimensions of variation, cycle time, and yield by eliminating special cause variation. However, improvement projects eventually will arise for which it is not possible to reach the desired levels of performance simply by eliminating the special cause variation. In these situations, it is necessary to question the very design of the process. Six Sigma prescribes applying the same DMAIC methodology and the same statistical tools for improving the process or product design as for improving the performance of a process with a given design. In addition, prototyping and simulation are typical Six Sigma activities in designing products. Experience shows that using the Six Sigma program for design and implementation of new processes is considerably more complex than using it within an existing design. At the same time, it offers tremendous bottom line potential.
The Six Sigma approach to product and process design has three complimentary objectives or design steps.
- System design: To design the product/process to satisfy and delight the customers.
- Parameter design: To make the design less sensitive to variation by determining appropriate values for the design parameters.
- Tolerance design: To reduce the process variability by narrowing tolerances on input material and work performed.

FIGURE 2.9 The Six Sigma Rationale Combining the Efficiency and Effectiveness Loops
2.2.4 THE SIX SIGMA FRAMEWORK
As mentioned earlier, the Six Sigma framework, which is the vehicle used to attain the stated objectives and fulfill the Six Sigma rationale, encompasses five major components: top management commitment; stakeholder involvement; training; measurement system; and at the very core, the five-step improvement methodology DMAIC. (See Figure 2.10.) The formalized framework, with its disciplined and quantitatively oriented improvement methodology, is what sets Six Sigma apart from many other management programs. Therefore, this section is devoted to taking a closer look at each of these framework components.

FIGURE 2.10 The Six Sigma Framework
Top Management Commitment
To leverage the full potential of Six Sigma, it must be an integral part of the firm’s business strategy. This requires long-term management commitment. In a sense, the entire Six Sigma framework is relying on top management commitment to materialize. Without it, the ambitious Six Sigma program will not survive. The commitment must go beyond lip service and manifest itself in pragmatic and involved management, to push the Six Sigma concept out to every part of the organization. However, this does not imply that top management should be engaged in the daily improvement activities; their role is as owners of the Six Sigma initiative and project sponsors. A strength of Six Sigma, compared to many other improvement programs, is its bottom line focus, which tends to help keep top management’s motivation and commitment at a high level.
Stakeholder Involvement
A successful Six Sigma program needs active support and involvement from all its important stakeholders, with particular emphasis on the employees, the suppliers, and the customers. Other stakeholders are owners and in a broad sense, society.
The most important stakeholder group with respect to Six Sigma is the people in the organization. Without their active support and involvement, the initiative will never take off. Six Sigma tries to ensure this involvement through attractive training programs, the formalized improvement methodology, and frequent feedback on process performance and rates of improvement. Constructive union involvement is in many cases also a necessary prerequisite for workforce involvement.
The suppliers are another critical stakeholder group because wide variations in the quality and characteristics of the input immediately affect the firm’s processes and their output. Therefore, key suppliers are often encouraged and supported in launching their own Six Sigma initiatives. Furthermore, a common Six Sigma strategy for involving suppliers is to share the performance data on the input they deliver.
As recognized in the Six Sigma revenue rationale, the importance of the customers and their perceptions cannot be overestimated. Six Sigma cannot reach its full potential without understanding and involving the organization’s customers. Ways for involving the firm’s customers include identifying their requirements and desires, having customers participate in internal Six Sigma training courses, and actively helping customers improve their processes using the Six Sigma methodology.
Training
One important, characterizing feature of Six Sigma is a comprehensive and formalized training program. The training is largely focused on understanding the statistical tools used for the data analysis, which is a cornerstone in the Six Sigma improvement methodology. However, the courses also cover topics such as process performance, the DMAIC improvement methodology, project management, quality function deployment, and the Six Sigma framework. In order for Six Sigma to succeed, this knowledge has to be diffused throughout the entire organization.
Although the structure might vary, the Six Sigma strategy includes three fairly standardized training course levels: basic, medium, and comprehensive. They differ in scope, detail, and practical application. Comprehensive training is reserved for those employees who will devote a majority of their time to running Six Sigma improvement projects throughout the organization. The basic training is offered to all employees to prepare them for participating in improvement projects at their own workplace. As more and more projects are being performed, an increasing number of people are exposed to the Six Sigma approach, which raises the level of understanding even further. A distinguishing and appreciated feature of the Six Sigma training programs is that they go beyond classroom teaching and require the participants to apply their knowledge in hands-on improvement projects.
A common way to denote the hierarchical roles in the Six Sigma program is to use a martial arts-inspired belt rank system. Typically, the belt levels are White Belts, Green Belts, Black Belts, Master Black Belts, and Champions in increasing order of training and responsibility. Sometimes Yellow Belts are included between the White and Green Belts. Relating the training program to these different roles, the White Belt course is typically a 1-day course that provides a basic introduction to Six Sigma. It is offered to all or most of the workforce. The Green Belt course usually targets foremen and middle management. It teaches the participants to apply the DMAIC methodology, including the necessary statistical tools, in a real project. The Black Belt course is a comprehensive course for full-time improvement experts. Although it has no formal prerequisites, it is beneficial if the participants on this level have a basic understanding of mathematics, statistics, and the firm’s core processes. The Black Belt training lasts for about 6 months, and it consists of several weeks of seminars between which the participants are required to work on different improvement projects with specified cost-savings requirements. The Black Belts represent the force that drives the operational process improvement activities. They typically are handpicked from the ranks of the most promising young leaders in the organization. The Master Black Belt is a qualified Black Belt who works full-time teaching Six Sigma courses. The Champion is a senior executive whose primary duties are to drive the improvement work forward, to be an advocate for the Six Sigma program in the top management circle, and to serve as a source of knowledge and experience. In addition, the Champion often participates in the selection of improvement projects.
Apart from the three courses mentioned, the standardized Six Sigma training program also includes a course in Six Sigma engineering and one in Six Sigma management. The former is a Black Belt course that focuses on the design of products and processes, and the latter deals with Six Sigma rollout issues and how to create the necessary momentum to keep the program moving.
Measurement System
A central issue in Six Sigma is to base decisions on factual data and to quantify the effects of implemented improvements. Therefore, a measurement system that collects the relevant data is of critical importance. As discussed previously, the preferred measurement in Six Sigma is variation because it can be used to measure dispersion and centering of any characteristic of interest, including those categorized as cycle time or yield. In deciding which characteristics to monitor, the focus should be on what is important to the customers. The universal variation metric used in Six Sigma is defects per million opportunities (dpmo), and the goal is to achieve fewer than 3.4 dpmo for all products and processes. Because all individual characteristics are measured using the same metric, it is easy to track performance over time; to compare different processes; and to consolidate individual measures for larger processes, projects, classes of products and services, and even for the entire company. The measurement system helps emphasize the process performance issues throughout the entire organization. A keyword in this respect is simplicity–a single metric that is easy to understand and easy to remember.
The Improvement Methodology
At the core of every Six Sigma project is the same formalized improvement methodology consisting of the five phases: define, measure, analyze, improve, and control. See Figure 2.11. As mentioned earlier, the methodology is based on a quantitative philosophy, emphasizing that decisions must be based on factual data, not guesses. The Six Sigma training, therefore, focuses on applying appropriate statistical tools in each of the five phases.

FIGURE 2.11. The Six Sigma Improvement methodology DMAIC
The define phase deals with the selection of appropriate improvement projects. Valuable sources of information in identifying candidate projects and areas of improvement include the aforementioned measurement system, customer complaints, customer satisfaction surveys, nonconformity reports, returns and warranty claims, and employee suggestions. After identifying a potential area of improvement, the next step is to define the project scope and the processes involved. In some cases, the scope might be limited to improving the performance of just one characteristic, but other projects might involve a complete redesign of entire processes or products. Having identified a number of candidate projects, the question is which project to pursue. Commonly used selection criteria include customer and company benefits, complexity, cost savings potential, and likelihood of success.
After a project has been selected, it is assigned to an improvement team consisting of an appropriate mix of Black, Green, and White Belts. Larger projects also include a top management sponsor or champion.
The measure phase involves deciding exactly which characteristics to improve and what needs to be measured in more detail. The general measurement system might not be detailed enough for the project in question, implying the need for additional control and measure points. Apart from identifying the characteristics or result variables to be improved, it is also important at this stage to identify and measure the critical input variables affecting the output. The input variables are classified as either control factors or noise factors. Control factors are input variables that can be affected and controlled in the short term, and noise factors are outside the direct control of the improvement team. The control factors typically have an immediate impact on the special cause variation in the output variables; this is the natural starting point for improvement. Another important issue in the measure phase is to define what constitutes unacceptable performance or a defect. Finally, enough data need to be collected to assess the current performance of the process and provide the foundation for improving it.
The analyze phase uses the preliminary data gathered in the measure phase to document the current performance and create a baseline against which to gauge the improvement efforts. The analysis typically involves calculations of means, standard deviations, and defects per million opportunities for the targeted characteristics and control factors. Moreover, control charts are often used to assess whether the process can be considered to be in statistical control. To better assess the relative performance and set appropriate improvement goals, it is also common to benchmark against other similar processes or products internally or externally.
Based on the analyzed data, the improve phase focuses on how to achieve the necessary improvements in predictability, dispersion, and centering. A core activity is to identify and eliminate root causes for nonrandom variability by going for the simplest improvement opportunities first. The 7QC tools are used extensively for these purposes. Advanced statistical tools including experimental design are applied when no special cause variation can be detected easily from the gathered data. At this point, if no special causes can be identified the project focus shifts to improving the design of the process or product and thereby reducing the random variation.
After the desired improvements have been achieved, the control phase is initialized to verify and institutionalize the change. Important activities include process monitoring using control charts, and documentation of changes that are made using, for example, flowcharts and formalized reporting of estimated cost savings. The experiences and results from the improvement project also need to be made available to the rest of the organization. An important lesson from Six Sigma companies is that projects breed projects, and sharing experiences has the twofold effect of transferring knowledge and spurring interest in the program.
2.2.5 CONCLUDING REMARKS: KEY REASONS FOR THE SUCCESS OF SIX SIGMA
To conclude our discussion on Six Sigma, we will summarize some of the acknowledged reasons for its ongoing success.
The bottom line focus and big dollar impact encourages and maintains top management commitment and support, which is a necessity for the program to succeed in the long term.
The emphasis and consistent use of a unified and quantitative approach to process improvement facilitates communication and real results. The disciplined application of the DMAIC methodology creates a common language through which people from different business units can share experiences and learn from each other’s successes and failures with regards to process improvement efforts. It also creates awareness throughout the organization that successful process improvement must be based on factual data and not guesswork. Vague statements such as “We believe that the cycle time has been significantly reduced” are no longer acceptable. The standard answer to this is “Show me the data.”
The emphasis placed on understanding and satisfying customer needs assures that the process improvements focus not only on the efficiency aspects (to do things right), but also on the effectiveness issues (to do the right things). This assures that the Six Sigma revenue rationale is fully leveraged. The focus on quantitative metrics forces Six Sigma companies to quantify and document customer needs and the current ability to satisfy them. Anecdotal information is replaced by reliable factual data gathered through formal customer interactions and evaluations.
The combination of the right projects, the right people, and the right tools is probably the most notable strength of the Six Sigma approach. By carefully selecting important projects and training the most talented people to apply the appropriate statistical tools on these projects, Six Sigma companies have achieved remarkable synergies. In the past, tools-oriented approaches have had mixed results because of the inherent risk of focusing on finding applications for the tools rather than finding appropriate tools for the most important problems. The tools used in Six Sigma are not new; the novelty is in the way the Six Sigma approach manages to integrate them into the improvement process. A key success factor is the rigorous Six Sigma training program and its focus on hands-on application of the course material to real projects.
2.3 Business Process Reengineering
Reengineering, or business process reengineering (BPR) as it is commonly known, became a buzzword in the 1990s, spurring a tremendous interest in process design. The essence of the reengineering philosophy is to achieve drastic improvements by completely redesigning core business processes; that is, by rethinking the way business is conducted. To relate this to the distinction between process design and implementation, reengineering advocates radical design changes and fast revolutionary implementation to achieve drastic improvements. Numerous articles and books addressing this topic have been written since the publication of Michael Hammer’s seminal manuscript “Reengineering Work: Don’t Automate, Obliterate” (1990) and the contemporaneous work by Thomas Davenport and James Short, “The New Industrial Engineering” (1990). The popular press also actively reported on success stories as well as implementation failures of BPR. Some of the success stories are familiar, as reported in a BPR tutorial article by Grover and Malhotra (1997).
- “Ford cuts accounts payable headcount by 75 percent”
- “Mutual Benefit Life (MBL) improves insurance underwriting efficiency by 40 percent”
- “Xerox redesigns its order-fulfillment process and improves service levels by 75 percent to 97 percent and cycle times by 70 percent with inventory savings of $500 million”
- “Detroit Edison reduces payment cycles for work orders by 80 percent”
On the other side of the coin, estimates suggest that approximately 50 percent to 70 percent of reengineering projects have failed to achieve the dramatic results anticipated in their objectives (Hammer and Champy, 1993). Moreover, even the so-called successful projects, such as the reengineering of Ford Motor Company’s accounts payable process, sometimes have taken 5 years or longer to implement and yield positive results (Petrozzo and Stepper, 1994). Several issues have been cited as reasons for these failures and long delays.
- Lack of top-management support and leadership (a champion) for the project.
- Poor understanding of the organization and infrastructure needed to support the new design.
- Inability to deliver the necessary advances in technology.
- Lack of expert guidance and motivation.
Hammer and Champy’s reasons for failure are more detailed and include a number of observations gathered during business process reengineering efforts in which they have participated.
- Attempting to fix a process instead of changing it.
- Lack of focus on business processes.
- Neglecting people values and beliefs.
- Willingness to settle for minor results.
- Quitting too early.
- Placing prior constraints on the definition of the problem and the scope of the redesign effort.
- Allowing existing corporate cultures and management attitudes to prevent the reengineering effort from getting started.
- Trying to make business process design changes happen from the bottom up.
- Selecting a project leader who does not understand the key issues associated with reengineering business processes.
- Skimping on the resources devoted to the reengineering effort.
- Burying reengineering efforts in the middle of the corporate agenda.
- Dissipating energy across too many reengineering projects.
- Attempting to change core business processes when the chief executive officer is 2 years from retirement.
- Failing to distinguish process reengineering from other business improvement programs.
- Concentrating exclusively on design (and hence ignoring everything except process redesign).
- Trying to change business processes without making anybody unhappy.
- Pulling back when people resist making design changes.
- Dragging out the effort.
Hammer and Champy believe that the common thread that runs through all of these pitfalls can be traced to the role of senior management. It is interesting to note that for many years, W. Edwards Deming advocated the same notion in reference to failures when implementing total quality programs (Gabor, 1990). Furthermore, it falls in line with the focus on top management commitment in Six Sigma discussed in Section 2.2. Although the frequency of failure is considerable, organizations that approach the design of business processes with understanding, commitment, and strong executive leadership are likely to reap large benefits. This implies that companies must be absolutely clear about what they are trying to accomplish when designing effective business processes and how they will go about doing it. Many experts believe that a considerable number of failures associated with the reengineering of business processes can be attributed directly to misunderstanding the underlying philosophy behind BPR.
Just as the experts have identified reasons for failure, they also point to several reasons for the success of projects that change processes with the goal of radically improving their efficiency. For example, Cross et al. (1994) mention that some common themes appear in many highly successful reengineering efforts. The following similarities can be found in successful implementations.
- Companies use process design to grow the business rather than retrench.
- Companies place emphasis on serving the customer and on aggressively competing with quantity and quality of products and services.
- Companies emphasize getting more customers, more work, and more revenues, and not simply concentrating on cutting back through cost reductions and downsizing.
2.3.1 REENGINEERING AND ITS RELATIONSHIP WITH OTHER EARLIER PROGRAMS
In order to better understand the basis for the reengineering movement and its importance for business process design, we must trace its origins and links to earlier process improvement programs. The term reengineering has been used loosely to describe almost every sort of management improvement program (Manganelli and Klein, 1994). Therefore, it is not surprising that ill-named programs fail to deliver on the advertised promise of reengineering. The following definitions of reengineering help sort out what this program is and what it is not.
- Reengineering is the fundamental rethinking and radical change of business processes to achieve dramatic improvements in critical, contemporary measures of performance, such as cost, quality, service, and speed (Hammer and Champy, 1993).
- Reengineering is the rapid and radical redesign and change of strategic, value-added business processes—and the systems, policies, and organizational structures that support them—to optimize the work flows and productivity in an organization (Manganelli and Klein, 1994).
- Reengineering is the fundamental rethinking and redesign of operating processes and organizational structure; it focuses on the organization’s core competencies to achieve dramatic improvements in organizational performance (Lowenthal, 1994).
These definitions have common themes, which point out the characteristics of this program. In particular, the definitions explain that reengineering focuses on core competencies or value-added business processes. They also indicate that the goal is to achieve dramatic improvement by rapid and radical redesign and change. Given these definitions, it becomes clear why projects that yield only marginal improvements in measures such as cost, service, and speed are generally considered failures. The element of rapid change also indicates that reengineering efforts that drag out might be labeled failures.
In addition to examining the descriptive elements embedded in these definitions, it is useful to compare the attributes of reengineering with those of other change programs. Table 2.1 provides a summary of key dimensions used to differentiate among several change programs. Bear in mind that Table 2.1 tends in some cases to oversimplify the differences among programs.
Rightsizing and restructuring typically refer to adjustments in staffing requirements and changes in formal structural relationships, respectively. Neither approach focuses on business processes. Automation refers to typical application of technologies (including information technology, or IT), where the application focuses mainly on automating existing procedures without questioning their appropriateness or legitimacy. That is, automation does not question whether the procedures should be changed or some activities should be eliminated; it simply adds technology with the hope of improving the current process efficiency.
Total quality management (TQM) and reengineering focus on processes. However, TQM emphasizes continuous improvement and bottom-up participation, usually within each business function, as well as continuous evaluation of current practices resulting in incremental changes in work design. Reengineering, on the other hand, typically is initiated from the top down, focuses on broad cross-functional processes, questions the logic of existing designs, and is usually a one-shot attempt at achieving quantum improvements. IT, which is only incidental to TQM, is often a key enabler of process reengineering. Six Sigma, which is not included in Table 2.1 because it emerged in parallel with BPR, can in many respects be construed as an extension of TQM complemented with elements of BPR. As we have seen, Six Sigma focuses on important processes and how they deliver customer value. Moreover, the objectives of drastic bottom line impact are achieved through a combination of aggressive and recurring improvement projects to get breakthrough results, and continuous improvement and process control for institutionalizing the change through incremental improvements.
TABLE 2.1 Reengineering and Other Change Programs

The relationship between radical or discontinuous improvement (typical of successful process reengineering projects) and incremental improvement (typical of TQM programs) can be seen in Figure 2.12.
TQM and Six Sigma provide the performance measurement and problem-solving data to alert management when it is time to completely change a process. A key element in this determination is given by the inability of marginal improvements to provide the change necessary to remain competitive. Incremental improvement usually results in diminishing returns, whereby it becomes economically impractical to implement additional minor changes to a process.
In Figure 2.12, we assume that a successful process reengineering project results in a radical improvement, where the theoretical capability might not be reached immediately. A powerful approach to use to monitor the performance of the process according to the measures established during the design effort is statistical process control1 (SPC) with process control charts (or Shewhart charts) as one of its main tools. SPC is also instrumental during the continuous improvement phase, which has the goal of making the process reach its theoretical capability. W. Edwards Deming referred to the cycle of continuous/radical/continuous improvement as continual improvement.

FIGURE 2.12 Radical Versus Incremental Improvement
2.3.2 A BRIEF HISTORY OF REENGINEERING
Most publications in reengineering give Michael Hammer credit for laying much of the foundation for this approach. However, the history of this process improvement methodology involves much more than Hammer’s seminal work. The article by Grover and Malhotra (1997) is one of the few published materials that attempts to provide an answer to the question of how everything got started. They note that their answer is based on speculating about the effect of a number of converging occurrences on the mobilization and subsequent popularity of reengineering as a program for radical change. The following is an adaptation from Grover and Malhotra (1997).
The origins of the movement can be traced to projects undertaken by management consulting firms. Around the mid-1980s, the idea of redesigning business processes was being advanced by large consulting units such as Peat Marwick and McKinsey & Co. Index Group and Michael Hammer directed programs on a cross-functional system in which several firms were studied (including Mutual Benefit Life and Ford). These firms used many of the components of reengineering, particularly the notion of applying information technology, to make radical changes in cross-functional processes.
For a number of years, even before the birth of reengineering, TQM brought the notion of a process focus onto the management agenda. The idea of improving business processes also was discussed at high management levels. At the core of these discussions was the concept of process performance as it relates to quality, service, and time-based competition. The TQM movement attempted to increase process performance by concentrating its efforts on continuous improvement (i.e., the Japanese kaizen) and employing tools such as statistical process control. It became evident later that reengineering followed a different path.
Another factor that influenced the reengineering movement was the economy. The recession through the late 1980s and early 1990s stimulated managers to think of new ways to increase process efficiency. Global competition further squeezed profits and led to reactive approaches and cost cutting/downsizing programs. The increasingly loose middle-management levels that focus on white-collar processes came under particular pressure in these programs, which also were aimed at increasing a company’s ability to be flexible and responsive.
The general belief is that investments in technology should result in productivity improvement. Yet this was not happening for many firms, leading to the phenomenon generally referred to as the productivity paradox. Stephen Roach coined this term to refer to the fact that despite the powerful market and service innovations created by computers in the 1980s, no evidence was showing that investment in IT had any effect on overall productivity. U.S. firms invested $100 billion in IT in the 1980s, and productivity essentially remained the same.
One explanation for this phenomenon is that the organizations were not taking advantage of the capabilities the new technologies offered. Rather, companies were simply using technology to speed up and automate existing practices. Clearly, if an activity or a set of activities is not effective to begin with, performing it faster and with less human intervention does not automatically make it effective.
For instance, one major financial institution reported that more than 90 steps were required for an office worker to get office supplies. These steps mostly involved filling out forms and getting the required signatures. Given the capabilities of information technology, it is certainly true that these steps could be automated and speeded up. For example, a computer system could be developed to generate all the forms automatically and then automatically e-mail them to the appropriate person for authorization. However, is automating all these steps the best solution? Clearly, some consideration must be given to eliminating some or most of these forms of control. Hammer later coined the phrase “paving cow paths” to describe organizations that simply adopt a new technology without considering the capabilities it offers to perform work in entirely new and better ways (Shafer and Meredith, 1998).
In response to the attention generated by the productivity paradox, companies that had spent (and were spending) vast amounts of money on newer and more powerful information technologies attempted to leverage these investments by tying them to programs focused on process changes.
Although the reengineering movement was gaining momentum, there were still some doubts concerning its legitimacy. The articles by Davenport and Short (1990) and Hammer (1990) helped legitimize the movement, mainly because they appeared in journals with audiences that include academics and practitioners. The books by Hammer and Champy (1993) and Davenport (1993) followed these articles. Both of these books gained immediate popularity and spurred a lot of reengineering activity in practice and academia.
Some of the early aggressive adopters of reengineering like Cigna, MBL, Xerox, and IBM were highly publicized in the popular press. Consulting firms and vendors (with their own vested interests) began to repackage their products and market proprietary solutions for reengineering. The rhetoric of reengineering transcended the original concept and was often used to describe any change or system initiative. This practice eventually gave reengineering a bad name, and many companies that are currently engaging in process change do not label such efforts as reengineering projects. Regardless of the label, the foundations and tools used in designing or redesigning business processes are solid and remain relevant.
It can be said that the notion of reengineering came to the right place at the right time when it was first introduced. Pushed by consultants at a time when businesses were looking for answers on how to compete effectively in the changing marketplace, the concept was embraced. However, since its original conception, various realities of accomplishing radical change and minimizing the pain have set in.
2.3.3 WHEN SHOULD A PROCESS BE REENGINEERED?
To provide an answer to the question of when processes should be reengineered, it is important to first discuss the three forces that Hammer and Champy (1993) believe “are driving today’s companies deeper and deeper into a territory that most of their executives and managers find frighteningly unfamiliar.”They call these forces the three C’s: customers, competition, and change.
Customers have increasingly become more educated (in the broadest sense of the word) and therefore more demanding. Customers do not settle for high quality in products and services, because they take that attribute as a given. Customer expectations have soared and now include the ability to select products and services that uniquely fit their needs. As Hammer and Champy put it: “The mass market has broken into pieces, some as small as a single customer.” Some Pizza Hut stores, for example, keep track of the orders placed by their customers and mail discount coupons with offerings customized to individual tastes. Some call centers record the name of the customer representative to whom the customer spoke last time and automatically route a new call to the same representative to create the sense of a personal relationship. Customers are likely to get used to this superior level of service and will not be easily satisfied with less.
The competition has also changed, in the sense that there is more of it, and it sometimes comes from unexpected sources. Each market segment where goods and services are sold establishes the basis for competition. The same product, for example, may be sold in different markets by emphasizing price in one, quality in another, functionality (attributes) at yet another, and reliability or service elsewhere. Free trade agreements among countries, such as the North Atlantic Free Trade Agreement (NAFTA), or within the European Union (EU) compound the complexity and the intensity of competition because governments are less willing to implement policies designed to protect the local industry. The good news for consumers is that this intense competition tends to drive quality up and prices down. The challenge for companies is that the level of efficiency in their operations must increase (to various degrees, depending on the status quo), because companies must be able to compete with the world’s best.
The conventional wisdom that if it ain’t broke, don’t fix it no longer applies to a rapidly changing business environment. Change is forced upon companies in many different ways, including the need to develop new products and services constantly. This need induces change in processes and organizational structures. For example, it is not enough for a company to introduce a new product that customers are going to love; the company must be sure that its order-fulfillment process is not going to irritate retailers that will in turn make decisions about shelf space and promotions. Changes in technology also have forced companies to be more adaptive and responsive, because customers expect to be able to utilize technological advances to their full potential. For example, suppose the owner of a bed and breakfast in a secluded, attractive part of the world decides to advertise its business on the World Wide Web. If the Web page does a good job of selling this vacation spot but fails to provide an electronic reservation system, potential guests might be lost.
With the three C’s in mind, consider the following questions that Cross et al. (1994) have found useful in determining when to redesign and reengineer a process.
- Are your customers demanding more for less?
- Are your competitors likely to provide more for less?
- Can you hand-carry work through the process five times faster than your normal cycle time?
- Have your incremental quality-improvement efforts been stalled or been a disappointment?
- Have investments in technology not panned out?
- Are you planning to introduce radically new products and services or serve newmarkets?
- Are you in danger of becoming unprofitable?
- Have your downsizing and cost-cutting efforts failed to turn the ship around?
- Are you merging or consolidating operations?
- Are your core business processes fragmented and disintegrated?
Consider the third question and the IBM Credit example in Section 1.1.2. Two senior managers walked a request through this process, asking personnel in each step to put aside whatever they were doing and to process the request as they normally would. They learned from this experiment that performing the actual work took in total only 90 minutes. The rest of the time (up to an average of 6 days) was attributed to non-value-adding activities such as waiting and rework. Clearly, the two senior managers were able to hand-carry a financing request more than five times faster than the average cycle time. In fact, assuming working days of 8 hours, they were able to hand-carry the request 32 times faster than the average cycle time!
One of the main reasons for launching a process redesign effort is the realization that continuous improvement activities have stopped yielding results. As depicted in Figure 2.12, the continuous improvement programs exhibit a profile of diminishing returns, making additional contributions to higher performance levels increasingly more expensive. This is due to the theoretical capability of the process. We use the term capability loosely to describe the ability of a process to achieve a desired level of performance; performance in this case can be measured by quality, service; speed, or cost. Once continuous improvement efforts lead a process to operate at or near its theoretical capability, the only way to significantly increase the level of performance is to change the process by completely redesigning it.
2.3.4 WHAT SHOULD BE REENGINEERED?
Processes, not organizations, are redesigned and reengineered. The confusion between organizational units and processes as objects of reengineering projects arises because departments, divisions, and groups are entities that are familiar to people in business but processes are not. Organizational lines are visible and can be plainly drawn in organizational charts, but processes are not visible. Organizational units have names; processes often do not.
Roberts (1994) makes the distinction between formal and informal business processes. Formal processes are typically guided by a set of written policies and procedures; informal processes are not. Formal processes are often prime candidates for reengineering for the following reasons.
- Formal processes typically involve multiple departments and a relatively large number of employees. As a result of their scope and complexity, such processes usually have the most to offer in terms of net benefits realized from improvement.
- Because formal processes operate under a set of rigid policies and procedures, they are more likely to be bound by assumptions and realities that are no longer valid. Informal processes also can become slaves of tradition, but such processes are more likely to be improved as the need for improvement becomes apparent–especially if the organization supports change and does not discourage risk taking.
- Informal processes tend to be contained within a unit in the organizational structure (e.g., a department or division). Therefore, issues of process ownership, control, and information sharing tend to be minimal.
Because it is not possible or even desirable to radically reengineer every formal business process at the same time, careful thought should be given to a starting point. Provided the executive management level is truly committed to the reengineering philosophy, Roberts (1994) suggests the following sequential screening criteria for choosing which process to reengineer first.
- A process that has a high likelihood of being reengineered successfully.
- A process for which the reengineering effort can produce rapid results.
- A process that, when reengineered, will result in significant benefits to the customer and the organization.
Note the similarity among the criteria used in Six Sigma for prioritizing improvement projects and the ones suggested by Hammer and Champy (1993) and Roberts.
- Dysfunction: Which processes are in deepest trouble?
- Importance: Which processes have the greatest impact on the company’s customers?
- Feasibility: Which of the company’s processes are currently most susceptible to successful reengineering?
Let us now examine each of these characteristics in more detail.
Dysfunction. As a general rule, dysfunctional or broken processes are hard to miss, because people inside the company are clear about their inefficiencies. Consider a process that uses the World Wide Web to create sales leads. Prospective customers enter information in an electronic form that sends an e-mail message to a central location. A clerk in the central location prints the e-mail messages and types the information into another electronic form that feeds a database that sales representatives can access. This process is broken, because data move from electronic form to paper and back to an electronic file. Clearly, a direct link should be provided to avoid retyping data.
Many educational institutions ask instructors to hand in final grades using forms that are machine-readable. Typically, these forms (also known as “bubble sheets”) consist of small circles arranged in rows where instructors can code the correct grade for each student by filling in the right combination of circles using a pencil. The forms are processed mechanically to create an electronic file of the grades. The electronic file is used to update the records of each student in the appropriate database of the institution. This process was appropriate when instructors kept records of the performance of each student in grade books. Today, however, grade books are replaced with electronic workbooks or spreadsheets, and the process is forcing grades to be moved from electronic media to paper so that a mechanical device can transform them back to an electronic form. This process is broken, because it adds unnecessary steps and increases the probability of introducing errors when the grades are coded in the bubble sheets using a printout of the instructor’s records. The process could be simplified considerably if a direct link between the instructors’ files and the institution databases is established with the proper level of security.
Hammer and Champy compiled a list of symptoms that help identify broken processes. Each symptom is associated with a disease, as summarized in Table 2.2.
Be aware that symptoms do not always show up where the disease resides. In other words, in some situations symptoms might be terribly misleading. An organization that Hammer and Champy studied had an order-fulfillment process that was “badly flawed,” but the customers didn’t think that was the case. In fact, the customers were satisfied because they received exactly what they ordered when they wanted it. As a result, superficially the process appeared healthy. However, the company’s sales were lagging. Was the sales process broken? No, the order-fulfillment process was in such bad condition that customers received their products on time only because salespeople went to the warehouse, picked up the orders, and delivered them themselves. That pleased the customers, but salespeople were making deliveries instead of selling; as a result, sales suffered.
TABLE 2.2 Symptoms and Diseases of Broken Processes


Importance. Companies cannot ask their customers which processes are most important to them. However, as depicted in Figure 2.13, companies can deTermine what issues their customers care strongly about and can correlate those issues with the processes that most influence them. For example, if customers care about product cost, the company might consider the product development and design process as being of high importance, given that a large percentage of the product cost is committed in the design stage.
Customers of a Web-based, computer-part supplier care about accuracy and the speed of delivery of ordered parts. These customers depend on receiving the right parts (e.g., memory chips of desired capacity) on time. The supplier should consider the order-fulfillment process the core of the business.
Feasibility. The feasibility of reengineering a process is linked to the scale of the associated project: The larger a process is, the broader its scope is. A greater payoff is possible when a large process is reengineered, but the likelihood of project success decreases. Also, a project that requires a large investment will encounter more hurdles than one that does not. Hence, the forces that play a role in determining the feasibility of a process as a prospect for reengineering are, as depicted in Figure 2.14: process scope, project cost, process owner commitment, and the strength of the team in charge of reengineering the selected process.
Mutual Benefit reduced the time to issue a policy from 3 weeks to 3 hours. Then it fell into insolvency and was taken by regulators a few months after Hammer’s 1990 article was published. This is an example of the process paradox, which refers to the decline and failure of businesses that have achieved dramatic improvements through process reforms. To avoid the process paradox, companies must not only get a “process right” but get the “right process right.”
FIGURE 2.14 Forces affecting Process Feasibility

It should be noted that neither Roberts nor Hammer and Champy suggest that the method to select a process to redesign and reengineer is a formal one. That is, determining what to redesign is not a purely analytical exercise, whereby with a given number of inputs the output is fully determined. In fact, many aspects of process design–and if we include the implementation phase, reengineering–are closer to art than to science. In the chapters ahead, we will look at a number of principles and tools that can be used to guide and assist the process design effort with the goal of exploiting the best aspects of art and science.
2.3.5 SUGGESTED REENGINEERING FRAMEWORKS
As we have discussed, the principles of reengineering have emerged from experiences at many different companies, and no one manual or distinct framework exists for how to go about a reengineering project. This differs from a program such as Six Sigma, which has its origins in one company (Motorola) and is anchored in a well-defined methodology. As a result of the heterogeneity of the reengineering concept, a variety of suggested frameworks have been proposed by practitioners and researchers. In the next few pages, we will look closer at three such frameworks suggested by Roberts (1994), Lowenthal (1994), and Cross et al. (1994). The purpose is to illustrate the fact that the reengineering concept, although it has some distinctive trademarks, is not one uniquely defined program but rather a family of approaches with some common traits and an explicit focus on radical design and rapid, revolutionary implementation.
Roberts (1994) offers the reengineering framework depicted in Figure 2.15 that starts with a gap analysis and ends with a transition to continuous improvement. The gap analysis technique attempts to determine three kinds of information: (1) the way things should be, (2) the way things are, and (3) how best to reconcile the difference between the two. An interesting feature of his framework is a feedback loop that goes from a pilot test to the process design stage. This indicates that some design modifications might be needed following a risk and impact analysis and the pilot test.
The model by Lowenthal (1994), on the other hand, consists of four phases: (1) preparing for change, (2) planning for change, (3) designing for change, and (4) evaluating change. See Figure 2.16. The first phase sets the foundation for future activity by achieving the following goals.
- Building understanding and support in management and increasing management awareness of the need for change.
- Preparing for a cultural shift and buy-in by the organization’s employees (including informing the employees of their role in the upcoming reengineering project).
The second phase operates under the assumption that organizations need to plan their future due to the constantly changing marketplace. The first two phases are performed in parallel, because neither one of them should be viewed as a prerequisite of the other.
The third phase provides a method to identify, assess, map, and ultimately design business processes. It offers the necessary framework for translating insights about the process being explored into quantum leaps of change.
The fourth phase provides a means to evaluate the improvement during a predetermined time frame, usually a year, and to develop priorities for the coming years. Specifically, this phase helps determine whether the reengineering effort has been successful and where future efforts should be concentrated.

The framework suggested by Cross et al. (1994) in a sense shows the building blocks of process reengineering. The approach is divided into three phases, as depicted in Figure 2.17.
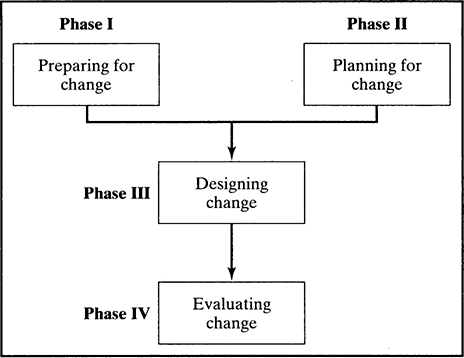
FIGURE 2.16 Lowenthal’s Framework for process reengineering

In the first phase, an in-depth understanding of the markets and customer requirements is developed. Also, research is directed toward a detailed understanding of how the work currently is being done. This is compared with the performance levels required to meet and beat the competition. In some cases, it is useful at this stage to benchmark best industry practices. Chapter 11 discusses how data envelopment analysis (DEA) can be used for this purpose.
During the analysis phase, some immediate opportunities for improvement might become apparent. For example, at one company, a simple review of the process convinced management to eliminate numerous approval and sign-off steps. This eliminated nearly 30 percent of the cycle time and 10 percent of the effort to get the work through the process. It took only 1 week from reviewing the process and discussing the findings to make the changes.
The design phase relies on design principles that fall into six categories: (1) service quality, (2) workflow, (3) workspace, (4) continuous improvement, (5) workforce, and (6) information technology. Service quality principles provide guidance regarding the design of processes as they relate to customer contacts. Workflow principles relate to the basic nature of managing the flow of work through a series of steps.
Workspace principles address the ergonomic factors and layout options. Continuous improvement principles help ensure that a process can be self-sustaining by incorporating continuous improvement and learning. Workforce principles are based on the premise that any workflow requires people and people are an integral part of the process design and implementation, and not an afterthought.
The design phase also includes the development of detailed maps, procedures, and operating policies and the design of supporting infrastructure (e.g., performance measures, job and organizational design, and compensation systems). The design is confirmed by validation through interviews and business models at the same time as key performance measures are defined. The design phase concludes with a pilot test, whose results may trigger changes to the blueprinted design.
Finally, the implementation phase involves the institutionalization of the new design into the day-to-day operations. The planning for implementation typically begins in parallel with the pilot, and in some cases in parallel with the earlier analysis and design work.
2.4 Revolunatery versus Evolutionary change
The traditional definition of reengineering emphasizes radical redesign and rapid implementation leading to revolutionary change. However, in reality constraining factors often arise, such as union concerns, training and IT needs, strong culture, and cemented organizational boundaries that make a rapid implementation at best very costly. In fact, this is one of the main reasons many reengineering projects have taken a lengthy amount of time and thereby have been considered failures. A revolutionary change that turns the whole organization on its head has the potential to achieve vast improvements, but it is also risky, and if it fails it might cause more harm than good.
As a consequence, many companies end up pursuing a successful strategy for breakthrough improvements based on radical redesign combined with a more evolutionary change process, implementing the plans they can, given the current restrictions. See, for example, Cooper and Markus (1995), Stoddard and Jarvenpaa (1995), and Jarvenpaa and Stoddard (1998). The radical redesign constitutes the blueprint for change and provides motivation as well as a clear goal for the organization. As the implementation proceeds, the original design usually has to be revised to accommodate the organizational constraints and the changing market conditions faced by the company. The process design that is finally fully implemented is therefore usually a compromise between the blueprinted “ideal” design and the original process. This implies that the improvements might not be as drastic as advocated by the reengineering movement, but at the same time the risk of failure is considerably lower.
In the following section, we will clarify what characterizes the concepts of evolutionary and revolutionary change, discuss their pros and cons, and note when it might make more sense to pursue one or the other to implement a new process design.
The evolutionary change model is based on the assumption that the people directly affected by and involved in a change process also must take an active part in the design and implementation of that change. See, for example, Jick (1993), Cooper and Markus (1995), Jarvenpaa and Stoddard (1998), and references therein. In other words, the evolutionary change theory advocates that change should come from within the organization itself, managed by the current leadership and carried out by the current employees. The communication should be broad and open, and the pace of change should be adapted to the available capabilities and resources, meaning that milestones and yardsticks are flexible.
The motivation for change arises from internal feelings of dissatisfaction with the current situation and a desire to do better. Moreover, new processes and procedures are piloted and implemented before they are cemented by the introduction of new IT systems. Inherently, the evolutionary model assumes that real change is best achieved through incremental improvements over time.
The advantages with evolutionary change are that it is less disruptive and risky than the revolutionary counterpart, but also that it tends to increase the organization’s general capacity for change. The disadvantage is that it takes a long time to achieve the desired vision, and it must be kept alive and adjusted over time as market conditions change. It is worth noting that the continuous improvement and empowerment focus in quality management is closely related to the evolutionary change philosophy.
The revolutionary change model is based on the so-called punctuated equilibrium paradigm. See, for example, Gersick (1991), which views radical change as occurring at certain instances in time with long periods of incremental change in between. Revolutionary change unfolds quickly and alters the very structure of the organization, the business practices, and the culture. Together with this type of change comes disorder, uncertainty, and identity crises.
The radical change needs to be top driven, typically by the CEO, and externally imposed on the organization. It requires external resources and an outside viewpoint. The change is driven by senior management, and these individuals need to provide the right vision, create the right culture, and build the necessary political alliances. See, for example, Nadler et al. (1995), Gersick (1991), Jarvenpaa and Stoddard (1998).
Outsiders in terms of consultants or new executives are brought in to lead and participate in the change process because they are not afraid to challenge the status quo. The change team is typically small and secluded from the rest of the organization so that they are not unduly influenced by the current way of doing things. Communication regarding what is about to happen is minimal and on a need-to-know basis.
The motivation for change is a crisis, financial or otherwise, and the milestones are firm to clearly mark that a new order is in place. As part of the change process, every member of the organization needs to be qualified for the new organization; if a person doesn’t measure up, he or she has no place.
Revolutionary change is also characterized by tough decisions including relentless cost cutting and conflict resolution. The advantage with the revolutionary approach is that drastic results can be achieved quickly. However, the enormous strain put on the organization also makes the project risky, and the probability of failure is not to be discarded lightly. The personal involvement required from top management also might divert their attention from the external marketplace, implying increased risk of lost market opportunities and possibly misaligned strategies. Another disadvantage is that the nature of revolutionary change goes against the core values that most organizations want to instill–namely empowerment, bottom-up involvement, and innovation. The secrecy and exclusion of employees from the change process also creates insecurity about their roles, leading them to resist rather than embrace change, not just for the moment but also in the long run. Table 2.3 summarizes some important elements of the evolutionary and revolutionary change models.
Clearly, the descriptions of the evolutionary and revolutionary change models constitute the extreme points on a continuum of different change strategies, and no definite answers clarify when to use a certain approach. However, based on empirical research, Jarvenpaa and Stoddard (1998) conclude that revolutionary implementation tends to be appropriate under special conditions, such as when the following situations are true.
TABLE 2.3 Elements of Evolutionary and Revolutionary Change Theories

- A true performance crisis exists.
- The change concerns a smaller, self-contained unit.
- The organization has deep pockets; for example, in terms of a rich parent company.
- The organization is free from the “not-invented-here” syndrome and can freely import solutions from outside the company or other parts of the company, such as using purchased software packages.
However, if not facing an immediate crisis, which leaves little choice but to pursue a risky revolutionary change tactic or go broke, many companies tend to use a more cautious evolutionary implementation strategy.
The critical element is time. If management is in a reactive mode and must respond to an immediate threat, a revolutionary change tactic might be the only sound choice. On the other hand, if management is in a proactive mode and initiates the change process in anticipation of a future need, there might be time to implement the radical design through an evolutionary approach with less risk. Although the vast improvements advocated in the reengineering movement might not be attained in this case, empirical evidence shows that a well-managed organization can accomplish breakthrough results using a combination of radical redesign and evolutionary implementation. By deploying an evolutionary tactic, the organization also learns how to change. This means it will be in a better position to implement future designs faster.
2.5 Summary
This chapter has looked at the governing principles of successful process management and discussed why it is important to adopt a process view. We also have described the basis for Six Sigma and business process reengineering, two of the most influential improvement programs developed in recent years. Both have a process orientation and to various degrees center on the principles for process management. The importance of distinguishing between process design and implementation, as well as between evolutionary and revolutionary change tactics as means to carry out the implementation, has also been explored.
The importance and power of adopting a process view points directly to the weaknesses of the functional organization in terms of coordination and transparency across functional areas. The lack of coordination and the tendency to focus on internal functional goals, in less-than-perfect alignment with the overall organizational objectives, makes the functional organization prone to suboptimization. As a remedy, the process view, with its focus on horizontal workflows, emphasizes coordination and customer needs. In terms of people management, adopting a process view means that the process structure needs to be made clear to everyone involved. Creating a better understanding of how each individual’s contribution fits into the big picture encourages involvement and participation, which are cornerstones in modern quality management and stepping-stones for successfully empowering the workforce.
The core principles for successful process management can be grouped into the following activities.
- Establishing process ownership.
- Analyzing boundaries and interfaces.
- Defining the process by documenting its workflow.
- Identifying control points and measurements.
- Monitoring the process for control purposes by implementing measures.
- Taking corrective action and providing feedback if deviations indicate that the process is no longer in control.
The road to successful process management of an already-designed process can be divided into three phases comprising the activities previously listed: initialization, definition, and control. In terms of attacking the difficult coordination issues across functional boundaries and interfaces, a useful concept is the customer-producer-supplier (CPS) model. Applying this model to every critical interface in the process is an effective way of aligning internal and external customer needs, and it fosters a view of the process as a chain of customers that need to be satisfied.
In a broad sense, Six Sigma can be described as a companywide strategic initiative for process improvement in manufacturing and service organizations. Its clear objective is to improve bottom-line results by reducing costs and increasing revenues. The goal of the Six Sigma program as it was originally conceived at Motorola is to reduce the variation of the individual processes to render no more than 3.4 defects per million opportunities.
At the core of the Six Sigma approach is a project- and result-oriented, quantitative and disciplined improvement methodology focused on reducing variability but also improving cycle times and yield. The methodology consists of five steps: define, measure, analyze, improve, and control. In many ways, these steps relate to the basic principles of process management. The methodology is embedded in a corporate framework based on top-management commitment, stakeholder involvement, training programs, and measurement systems. Although Six Sigma was originally Motorola’s customized approach to quality management and process improvement, its ongoing success has brought it into the boardrooms of some of the world’s most successful companies. Six Sigma’s success is often attributed to a strong bottom-line focus and big dollar impact; the emphasis and consistent use of a unified and quantitative approach to process improvement; the emphasis placed on understanding and satisfying customer needs; and the combination of the right projects, the right people, and the right tools.
The reengineering philosophy of achieving drastic performance improvements by a complete redesign of core business processes, combined with rapid implementation of the new design, created a tremendous interest in the 1990s. However, quickly achieving revolutionary change is connected with high risks as well as potentially high returns. The large number of failed initiatives caused more harm than good and has given reengineering a mixed reputation. Several reasons for these failures have been cited, including lack of top-management support and project leadership, poor understanding of the current organization and operations, inability to obtain and adapt the necessary technology, neglecting people’s values and beliefs, placing prior constraintson the scope and problem definition of the design effort, and quitting too early when people resist making changes. Most of these issues relate to the rapid implementation of the radically new design and the compressed time perspective that is inherent in the traditional reengineering definition. The soundness of the general principles for business process design advocated by the reengineering movement is unabated, including the principles for deciding when and what to redesign.
The difficulty and high risk of using a revolutionary change tactic for implementation has led some companies to embark on a successful strategy for breakthrough improvements based on radical process design combined with a more evolutionary implementation tactic. The advantages include lower risk of failure and improved longterm organizational ability to accept change. A disadvantage is that the final implementation might not give the order-of-magnitude improvements that a revolutionary change might be capable of. The approach also requires more time; therefore, in order to use this strategy, management must be proactive. If a company is facing an immediate crisis, a revolutionary change tactic might be the only hope.
2.6 References
Cooper, R., and M.L.Markus. 1995. Human reengineering. Sloan Management Review 36 (Summer): 39–50.
Cross, K.F.,J.J.Feather, and R.L.Lynch. 1994. Corporate renaissance: The art of reengineering. Cambridge, MA: Blackwell Business.
Davenport, T. 1993. Process innovation: Reengineering work through information technology. Boston: Harvard Business School Press.
Davenport, T., and J. Short. 1990. The new industrial engineering: Information technology and business process redesign. Sloan Management Review (Summer): 11-27.
Duncan A. J. 1986. Quality control and industrial statistics, 5th edition. Homewood, IL: D. Irwin.
Evans, J. R., and W. M. Lindsay. 2002. The management and control of quality, 5th edition. Cincinnati, OH: South-Western, Thomson Learning.
Foster, T. S. 2001. Managing quality: An integrative approach. Upper Saddle River, NJ: Prentice Hall.
Gabor, A. 1990. The man who discovered quality. New York: Penguin Books.
Gersick, C. J. G. 1991. Revolutionary change theories: A multilevel exploration of the punctuated equilibriumparadigm. Academy of Management Review 16 (January): 10-36.
Goldsborough, R. 1998. PCs and the productivity paradox. ComputorEdge (October 26): 23–24.
Grover, V., and M. J. Malhotra. 1997. Business process reengineering: A tutorial on the concept, evolution, method, technology, and application. Journal of Operations Management 15:193–213.
Hammer, M. 1990. Reengineering work: Don’t automate, obliterate. Harvard Business Review 71(6): 119–131.
Hammer, M., and J. Champy. 1993. Reengineering the corporation: A manifesto for business revolution. New York: Harper Business.
Harbour, J. L. 1994. The process reengineering workbook. New york: Quality resources.
Harrington, H. J. 1991. Business process improvement: The breakthrough strategy for total quality, productivity, and competitiveness. New York: McGraw-Hill.
Harry, M. J. 1998. The vision of Six Sigma , 8 volumes. Pheonix, AZ.Tri Star Publishing.
Harry, M. J., and R. Schroeder. 2000. Six Sigma: The breakthrough management strategy world's top corporations. revolutionizing the world’s top corporations. New York: Doubleday.
Hauser, J., and D. Clausing. 1988. The house of quality. Harvard Business Review (May-June): 63–73.
Hoerl, R. W. 1998. Six Sigma and the future of the quality profession. Quality Progress 31(6).
Jarvenpaa, S. L., and D. B. Stoddard. 1998. Business process redesign: Radical and revolutionary change. Journal of Business Research 41:15-27.
Jick, T. D. 1993. Managing change: Cases and concepts. Burr Ridge, IL: Irwin.
Lowenthal, J. N. 1994. Reengineering the organization: A step-by-step approach to corporate revitalization. Milwaukee, WI: ASQC Quality Press.
Magnusson, K., Korslid, D., and B. Bergman. 2000. Six Sigma: The pragmatic approach. Lund, Sweden:Studentlitteratur.
Manganelli, R. L., and M. M. Klein. 1994. A framework for reengineering. Sloan Management Review (June): 10-16.Melan, E. H. 1993. Process management: Methods for improving products and services. New York: McGraw-Hill.
Mintzberg, H. 1979. The structuring of organizations. Upper Saddle River, NJ: Prentice Hall.
Mizuno S., and Y. Akao. 1994. QFD: The customer-driven approach to quality planning and development. Tokyo,Japan: Asian Productivity Organization.
Munro, R. A. 2000. Linking Six Sigma with QS–9000: Auto industry adds new tools for quality improvement. Quality Progress 33(5).
Nadler, D. A., R. B. Shaw, and A. W. Walton. 1995. Discontinuous change. San Francisco: Jossey-Bass Publishers.
Petrozzo, D. P, and J. C. Stepper. 1994. Successful reengineering. New York: John Wiley and Sons.
Robbins, S. P. 1990. Organization theory: Structure designs and applications; 3rd edition. New Jersey: Prentice-Hall International Inc.
Roberts, L. 1994. Process reengineering: A key to achieving breakthrough success. Milwaukee, WI: ASQC Quality Press.
Shafer, S. M., and J. R. Meredith. 1998. Operations management: A process approach with spreadsheets. New York: John Wiley and Sons.
Stoddard D. B., and S. L. Jarvenpaa. 1995. Business process redesign: Tactics for managing radical change. Journal of Management Information Systems 12 (Summer): 81–107.
Tomkins, R. 1997. GE beats expected 13% rise. Financial Times, October 10, 1997.
2.7 Discussion Questions and Exercises
- What are some of the main advantages and challenges of adopting a process-oriented view of the organization? How are these related to the traditional functional structure?
- What are the purposes of and challenges with each of the six main principles or activities that define successful process management? Does it make sense to group the activities into the three phases initialization, definition, and control? Why or why not?
- How is the Six Sigma improvement methodology related to the basic principles of process management and the three phases of initialization, definition, and control?
- Explain the CPS model and the “chain of customers” concept. How does this help facilitate an effective process orientation?
- Considering the document distribution example in Section 2.1.4:
- What would you say are the main problems with the management of this process?
- Do you agree with Joe’s approach for arriving at a better managed process?
- Is there anything you would do differently?
- Do you see any potential for radical redesign of the entire process? What do you suggest?
- What is the technical definition of Six Sigma quality, and how is this definition related to the measure of 3.4 dpmo?
- How would you define or describe a Six Sigma initiative to a friend who has never heard about this before? What is new with Six Sigma compared to other quality-management programs?
- What are the components of the Six Sigma framework? Are there any similarities with issues emphasized in reengineering and general process management? What is the importance of each individual component for the overall approach? What are the implications if a certain element is not in place?
- Do the Six Sigma cost and revenue rationale and the combined effect of the efficiency and effectiveness loops make sense? How would you interpret this in a situation where Six Sigma is applied at a hospital or an educational institution like a university?
- What is the standard approach in Six Sigma for reducing variability? How does it relate to improvements in cycle time and yield?
- What are the traditional roles in a Six Sigma improvement project, and how are they related to the training scheme? Does this approach make sense to you? Can you see any potential drawbacks, for example, in light of the theories for evolutionary and revolutionary change?
- At the core of Six Sigma programs lies the improvement methodology DMAIC. Discuss how each of its five steps relates to the other components of the Six Sigma framework.
- What are some of the reasons often mentioned for the success of Six Sigma? What are the rationales? Do you think they make sense?
- What are some of the often-cited reasons for reengineering failures? Can you see any connections to the Six Sigma framework or the general principles for process management?
- How would you position Six Sigma in relation to reengineering and TQM?
- What is the meaning of the process paradox? How can it be avoided?
- What are some of the criteria often used to determine when a process should be redesigned? What forces drive the need for process redesign?
- Discuss the principles commonly used in reengineering for deciding which processes to redesign? How do these criteria relate to those used in Six Sigma for prioritizing among improvement projects?
- Discuss the similarities and differences among the reengineering frameworks suggested by Roberts, Lowenthal, and Cross et al., described in Section 2.3.5. Also, what connections can be seen with the Six Sigma framework?
- Explain how total quality management and business process redesign can support one another in the context of the methodology outlined in Figure 2.15.
- How can the general revolutionary change model help explain the many reengineering failures? What is the pragmatic strategy many companies tend to use in order to lower the risk of failure and the cost of change but still leverage the potential of business process design? What are its main advantages and disadvantages? What is the prerequisite for this strategy to be a viable option?
- PCs and the Productivity Paradox (adapted from Goldsborough, 1998)–Despite the riotous instability of stock prices lately, some prognosticators are advising us not to worry. Sure, the stock market has experienced unprecedented growth without significant downslide for 7 straight years. And sure the market has always been cyclical in the past. But we’re in the midst of a revolution, say the pundits, an information revolution. Spurred by personal computers and the Internet, the economy has morphed in a fundamental way. Information technology has ushered in a paradigm-smashing leap in productivity that might have made recession passé.
Not so fast, say those who’ve studied these issues. It’s not even clear that personal computers have affected productivity appreciably, let alone leading to the kind of improvements that would allow us to sail off with our mutual fund investments into a tranquil prosperity. Bureau of Labor Statistics figures show that despite the personal computer “revolution” and the billions invested in technology, productivity gains measured in output per hour have remained at a feeble annual rate of 1 percent for the past 30 years, which pales in comparison to the brawny productivity growth of 3 percent annually experienced during the 1950s and 1960s.
Common sense indicates that personal computers should increase productivity. They let individuals plan and budget far more effectively than a calculator or a table. They make it possible to keep track of people and things far more easily than a roster or a list. They help people communicate far more efficiently than a typewriter or a telephone. They can tap far more research sources than the largest collection of periodicals or books. Even though some studies have shown that PCs have had a positive impact on productivity, and even though some experts contend that such intangibles as convenience and service don’t show up in the statistics, the fact remains that the productivity figures haven’t budged. This anomaly has been called the “productivity paradox,” and if you look at your own habits and those of people around you, you’ll see some of the reasons why.
- Those memos with their fancy fonts and elaborate formatting take longer to create than the simple typewritten memos of the past.
- Likewise with those presentations adorned with graphics, sound effects, and animation.
- E-mail makes it easy to stay in the loop, but wading through scores of nonessential messages each day is definitely a time sink.
- The Web can be an invaluable informational resource, but the temptation is great to jump from one site to another, each in turn less relevant to your work needs. Not to mention using the Web to shop, check out sports scores, and engage in chitchat.
- Then there is the equipment maintenance. Whereas in the past only specialists got silicon under their fingernails, today everybody has to deal with software bugs, hardware conflicts, and system crashes. And when the machine is not cooperating, it lures you to tinker endlessly in pursuit of PC perfection.
- A few years ago, a survey by SBT Accounting Systems of San Rafael, California, showed that the typical computer user in a business setting wastes 5.1 hours each week on PCs.
- Another study by Forrester Research of Cambridge, Massachusetts, showed that 20 percent of employees’ time spent on the Internet at work doesn’t involve their jobs.
This is not to say that you should trade your Pentium III machine for a typewriter or prevent workers from having access to the Internet. It’s not the technology that’s the villain. It’s how we use it. Because the machines are so dumb–all they really do is add and subtract zeros and ones–we have to be smart in managing them.
- What policies can a company establish to remedy some of the causes for the productivity paradox?
- Should the productivity paradox be a factor when considering the application of information technology to business process design?