Channel Models for On-Body Communications
H.G. Sandalidis1 and I. Maglogiannis2, 1Department of Computer Science and Biomedical Informatics, University of Thessaly, Lamia, Greece, 2Department of Digital Systems, University of Piraeus, Piraeus, Greece
The need to find reliable and simultaneously simplistic propagation models in the majority of frequency bands, where wireless body area networks (WBANs) operate in, is the driving force leading to the appearance of many studies on that topic during recent years. Transmission in WBANS is significantly affected by human body tissues and is frequency dependent. Signals are attenuated and delayed to a large extent and reach the receiver as a sum of several components traveling in multiple paths. Shadowing phenomena are likely to appear due to human body movements and the variations in the surroundings of human body parts. Propagation paths can also experience fading due to energy absorption, reflection, and diffraction mechanisms, as well as due to multipath effects of the surrounding environments. All the above phenomena have a different degree of influence on the WBAN behavior according to the frequency band of operation. This chapter briefly summarizes the fundamental channel models for on-body communications launched by either the IEEE or other independent research and standardization efforts. The basic experiment setups are described in detail, while the presented results can be considered as a valuable tool for researchers and designers working in that area, who desire to build their own applications based on WBANs.
Keywords
Wireless body area networks (WBANs); On-body communications; Wearable Systems and Applications; Path loss propagation models; Shadowing; Fading
1 Introduction
The adoption of wearable systems in modern healthcare telemonitoring systems has been considered a medical challenge towards the highest level of quality of life. The current state-of-the-art technologies in wearable computing, wireless telemedical platforms, and wireless sensors allow easy and unobtrusive electronic measurement of several vital signals and health conditions regardless of the time and the place the patient needs condition monitoring. These measurements can be either stored locally on a monitoring wearable device for later transmission or directly transmitted, e.g., over the public phone network, to a medical center. Such architecture is depicted in Figure 1, where the on-body network resides on the body of the monitored person.

Wave propagation in the human body area is considered a complicated process. In wireless body area networks (WBANs), propagation phenomena include, among others, the frequency-dependent electromagnetic transmission, the strong absorption and scattering from human tissues, and high losses for non-line-of-site links, as well as the appearance of frequent shadowing effects [1]. The need to find reliable and simultaneously simplistic models in the majority of frequency bands where WBANs operate is the driving force that has led to the appearance of many studies on the topic in recent years [2].
Channel models may be classified into two main categories: analytical and empirical. Analytical models require a detailed description of the propagation environment and attempt to achieve a precise modeling of the power attenuation at a specific position. Empirical models, on the other hand, attempt to foresee the propagation characteristics based on a given set of measurements. Thus, they are more suitable for complex environments and applications such as body area networking [3].
Transmission in WBANs is significantly affected by human body tissues and is frequency dependent. Signals are attenuated and delayed to a large extent and reach the receiver as a sum of several components traveling in multiple paths. The simplest formula used to empirically capture the key mechanisms of signal attenuation in the body area is the Friis transmission formula, i.e., [4],
(1)
where PL(d)dB is the path loss in decibels at transmission distance d, n is the path loss exponent, and C is a constant.
Shadowing phenomena are likely to appear due to the human body’s movements and the variations in the surroundings of human body parts as well. Moreover, multi-path reflections make the channel response look like a series of pulses. Propagation paths can also experience fading due to energy absorption, reflection, and diffraction mechanisms, as well as due to multi-path effects of the surrounding environments [3,5].
All the above phenomena have a different degree of influence on WBAN behavior according to the frequency band of operation. Usually, WBANs are designed to operate in the bands of 400 MHz, 600 MHz, 900 MHz, 2.4 GHz, and 3.1 to 10.6 GHz. Due to the different channel characteristics for each of the above frequency ranges, proper channel modeling is required in each case.
This chapter aims to summarize the fundamental channel models introduced in the literature concerning wearable WBANs. The basic models were launched by the IEEE 802.15.6 subgroup, which was created to develop standards for BANs [6]. Most of them provide adequate performance and were generated after a number of proper measurements in indoor environments. The group examined different scenarios for channel modeling depending on the location of communication nodes, i.e., implant, on-body, and external.
The chapter particularly focuses on the fundamental channel models for on-body communications launched by either the IEEE or other independent researchers. Basic experimental setups are referred to in detail. Both line-of-sight (LOS) and non-line-of-sight (NLOS) channels, depending on the way the electromagnetic waves propagate between communication nodes, are investigated. In view of the above, this chapter can be a valuable tool for researchers and designers who are working in this area and who desire to build their own WBAN.
2 IEEE 802.15.6 TG6 Standard Models
The IEEE 802.15.6 standard has been under development since 2007. Particularly, the Task Group TG6 has aimed to develop BAN standards optimized for low-power devices for medical and non-medical devices that can be placed inside or on the surface of the human body [6].
Communications in the standard are broadly defined, including narrowband and ultra-wideband (UWB) communications. Narrowband is appropriate for electronic healthcare applications since bio-signals at these frequencies are less attenuated from the human body. However, they have small bandwidth, and symbol interference is likely to be caused due to multi-path effects. Ultra wideband (UWB) in IEEE 802.15.6 requires large bandwidth, about 499 MHz. Table 1 shows the carrier frequency bands and channel bandwidths proposed for WBAN by the IEEE group [7].
Table 1
Frequency Bands and Bandwidths
| Narrowband Communications | Ultra-Wideband Communications | ||
| Frequency Range | Bandwidth | Frequency Range | Bandwidth |
| 402–405 MHz | 300 KHz | 3.2–4.7 GHz | 499 MHz |
| 420–450 MHz | 300 KHz | 6.2–10.2 GHz | 499 MHz |
| 863–870 MHz | 400 KHz | ||
| 902–928 MHz | 500 KHz | ||
| 950–956 MHz | 400 KHz | ||
| 2360–2400 MHz | 1 MHz | ||
| 2400–2483.5 MHz | 1 MHz | ||

A significant number of documents were submitted to the channel modeling subgroup or presented and discussed at the IEEE 802.15.6 meetings [8]. The most representative propagation models for on-body communications are presented in the following subsections.
2.1 Aoyagi et al. Model
One of the fundamental channel models of the IEEE 802.15.6 subgroup was provided by Aoyagi et al. It is based on the simple Friis formula, where an additional term was added in order to describe shadowing [9]. This additional term N is a Gaussian distributed function with a mean value 0 dB and standard deviation σN dB, which can be determined based on statistical fitting [4]. Particularly, the path loss observed at a receiving node located at distance d from a transmitter is expressed as
(2)
where α and b are coefficients of linear fitting.
Based on that model, the authors provided a set of measurements considering several frequency bands suitable for WBAN operation. More details on the measurement setup, derivation, and data analysis are given in [9]. Experiments took place in different environments, i.e., in a hospital room and an anechoic chamber. The anechoic chamber provides ideal transmission conditions since it eliminates any possible reflections from the surroundings.
During the experiment process, several antennas were located on the human body, including the left hand, left upper arm, left ear, head, shoulder, chest, right rib, left waist, thigh, and ankle. The received measurements consisted of a proper set of empirical results that were properly fitted to the linear model of (2) using the least square method. The measurements took possible human body turnarounds into account, i.e., LOS and NLOS situations were considered in the experiment as well.
The propagation distance between a transmitter and receiver was scaled and varied from 100 to 1,000 mm. Different frequency bands were used and the results obtained are depicted in Table 2. Roughly speaking, five submodels were distinguished, namely A, B, C, D, and E, which refer to the five frequency bands where experiments took place, i.e., 400–450 MHz, 608–614 MHz, 950–956 MHz, 2.4–2.5 GHz, and 3.1–10.6 GHz, accordingly. The parameters, A, B, and σN for each sub-model differ from each other and are clearly outlined for the two environments (hospital room and anechoic chamber). It can be shown that the path loss effects caused by the presence of the human body are greater in an anechoic chamber, in comparison to the hospital room, due to the reflections from the walls. This can be verified in [9, Figure 3] where analytical path loss results for all models are illustrated using proper diagrams.
Table 2
| Parameters | Hospital Room | Anechoic Chamber |
| MODEL A: 400–450 MHz | ||
| A | 3 | 22.6 |
| B | 34.6 | −7.85 |
| σN | 4.63 | 5.60 |
| MODEL B: 608–614 MHz | ||
| A | 16.7 | 17.2 |
| B | −0.45 | 1.61 |
| σN | 5.99 | 6.96 |
| MODEL C: 950–956 MHz | ||
| A | 15.5 | 28.8 |
| B | 5.38 | −23.5 |
| σN | 5.35 | 11.7 |
| MODEL D: 2.4–2.5 GHz | ||
| A | 6.6 | 29.3 |
| B | 36.1 | −16.8 |
| σN | 3.80 | 6.89 |
| MODEL E: 3.1–10.6 GHz | ||
| A | 19.2 | 34.1 |
| B | 3.38 | −31.4 |
| σN | 4.40 | 4.85 |

2.2 Dolmans and Fort Model
A more complicated model was suggested by Dolmans and Fort [10]. The measurements took place in an office environment for 915 MHz and 2.45 GHz.
The channel parameters were obtained using measurements from receiving nodes placed in front of and on the back of a human body. The transmitter was worn at approximately shoulder height. Several path-loss models were tested to fit the measurement data. The combined exponential-linear saturation model was found to give the best fit with the measurement data. That happened since the path loss follows an exponential decay around the perimeter of the body and flattens out as distance increases, due to energy received from multi-path reflections of the indoor environment [8].
The path loss according to that model is expressed as
(3)
where P0 is the average loss close to the antenna, m0 is the average decay rate in dB/cm for the surface wave moving around the perimeter of the body, P1 is the mean attenuation of components radiated away from the body and reflected back to the receiver, σP is the log-normal variance in dB around the average representing the variations measured at different body and room locations, and nP is a Gaussian variable of zero mean and unit variance.
The authors also provided a model of the flat small-scale fading observed at the measured data. They examined several distributions such as Rayleigh, lognormal, Nakagami-m, and Rician using maximum-likelihood parameter estimates and found that the Rician distribution reflects the most adequate model. The Rician distribution is characterized by a parameter, K, defined as the ratio of the specular component to the random multi-path component powers [10]. This parameter decreases when the receiver is moved away. The K-factor is expressed in dB as
(4)
where K0 is the fit with measurement data for the K-factor for low path loss, mk is the slope of the linear correlation between path loss and K-factor, PdB is the path loss in dB, σk is the log-normal variance of the measured data between path loss and K-factor, and nk is the Gaussian variable with zero mean and unit variance.
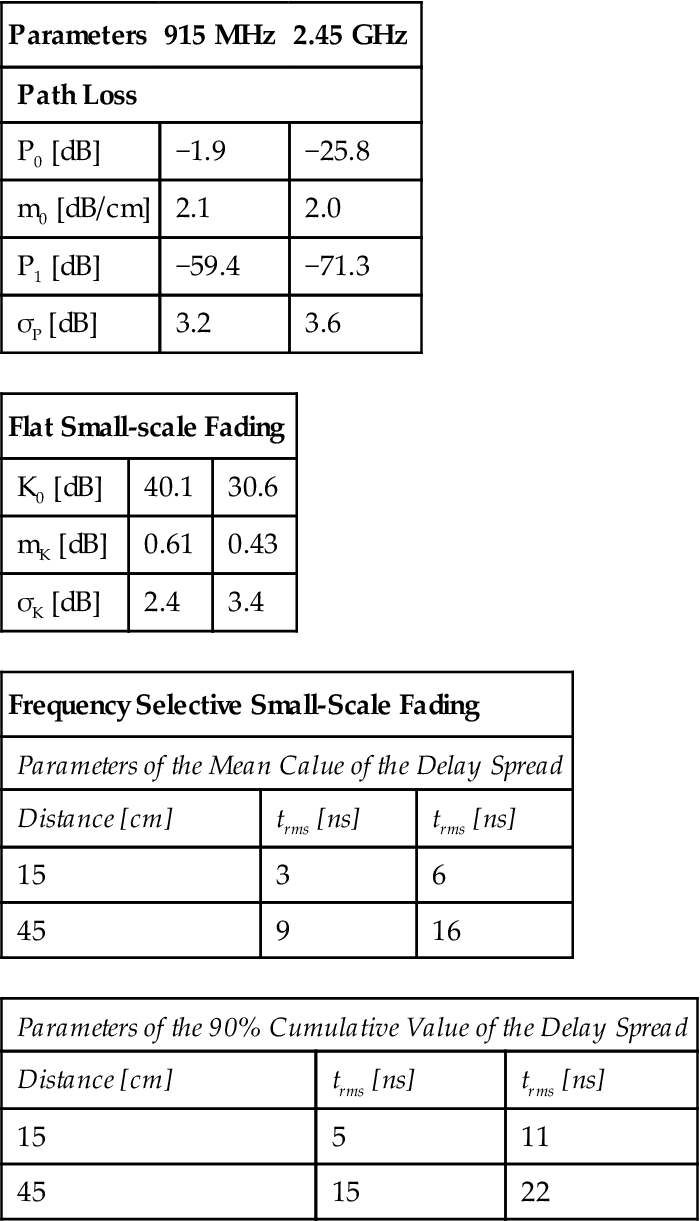
Regarding narrowband systems, where frequency selective fading appears, the authors estimated the delay spread from the cumulative density function for antenna separations of 15 and 45 cm. The delay spread is modeled with a normal distribution. Table 3 summarizes the parameter values for the two frequency bands where the model is valid.
Table 3
| Parameters | 915 MHz | 2.45 GHz |
| Path Loss | ||
| P0 [dB] | −1.9 | −25.8 |
| m0 [dB/cm] | 2.1 | 2.0 |
| P1 [dB] | −59.4 | −71.3 |
| σP [dB] | 3.2 | 3.6 |
| Flat Small-scale Fading | ||
| K0 [dB] | 40.1 | 30.6 |
| mK [dB] | 0.61 | 0.43 |
| σK [dB] | 2.4 | 3.4 |
| Frequency Selective Small-Scale Fading | ||
| Parameters of the Mean Calue of the Delay Spread | ||
| Distance [cm] | trms [ns] | trms [ns] |
| 15 | 3 | 6 |
| 45 | 9 | 16 |
| Parameters of the 90% Cumulative Value of the Delay Spread | ||
| Distance [cm] | trms [ns] | trms [ns] |
| 15 | 5 | 11 |
| 45 | 15 | 22 |
2.3 Miniutti et al. Model
This model deals with measurements of on-body narrowband wireless channels at the frequencies of 820 MHz and 2.36 GHz [11]. The experiments took place in an office environment where several antennas were located on the human body. The aim was to estimate the path loss assuming three different human actions, i.e., standing, walking, and running. As the authors declare, the innovation of their study compared to other ones lies in the examination of continuous movement of the human body on the wireless channel. Table 4 lists the body locations and the separations in cm of transmitters and receivers used.
Table 4
Distance Between Transmitters and Receivers
| Receiver Location | Transmitter Location | |||||
| Chest | Right Wrist | Left Wrist | Right Ankle | Left Ankle | Back | |
| Right hip | 38 | 11 | 30 | 90 | 93 | 45 |
| Chest | 36 | 115 | 25 (50) | |||

The multi-path transmission around the body and the surrounding environment also causes a fading appearance. A significant amount of fading also occurs due to the movement of the human body. The distribution of the normalized received power was described using a probability density function that obtains the best match for all scenarios. The Gamma distribution was proven the best fit to average fade duration. Moreover, the same distribution fitted to a dB scale was the best fit to fade magnitude [8].
An analytical description of the experimental process and the instrumentation equipment is provided in [11]. The path loss at a given time t is obtained as
(5)
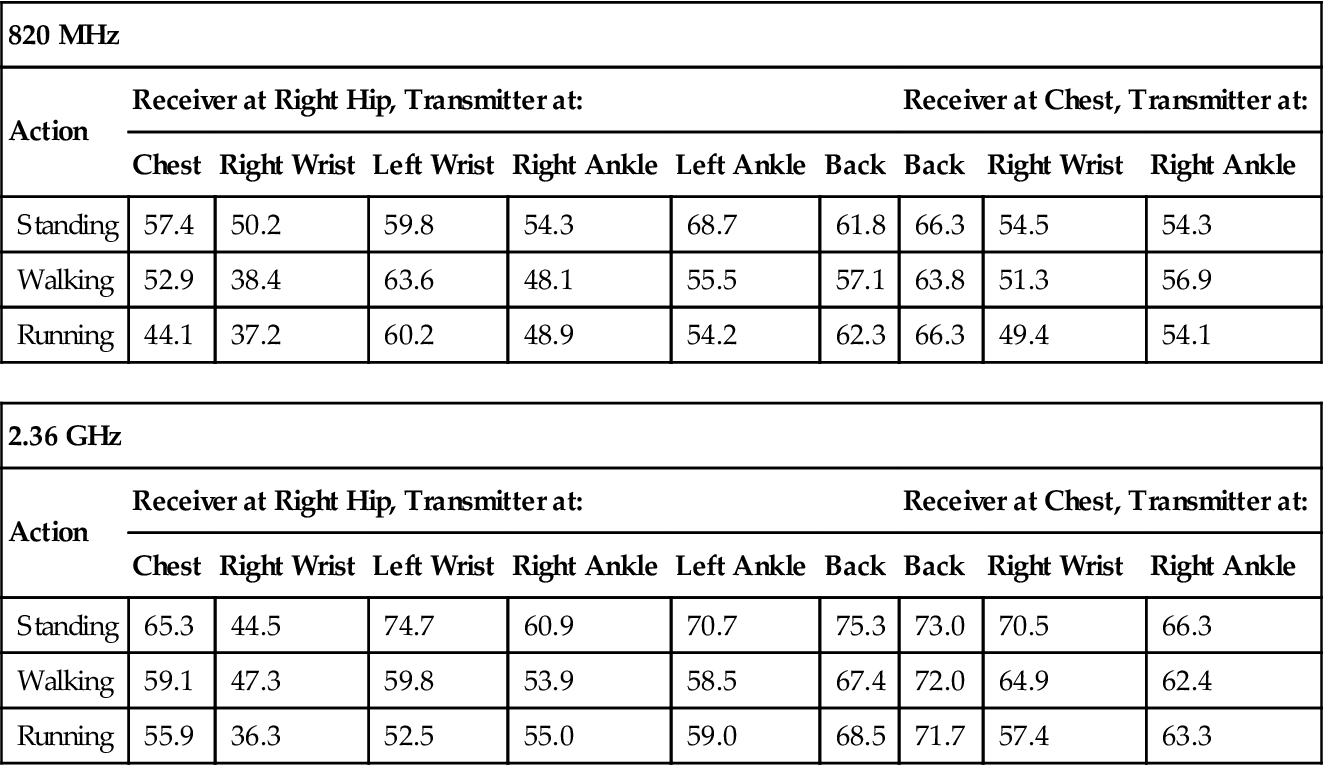
where PtX is the transmitted power, PrX the RMS received power, Gamplifiers the amplifier gain, and Lcable the cable loss. Table 5 shows the average path loss for each action and antenna placement for the two frequency bands. In general, the path loss is greater at 2.36 GHz than at 820 MHz.
Table 5
| 820 MHz | |||||||||
| Action | Receiver at Right Hip, Transmitter at: | Receiver at Chest, Transmitter at: | |||||||
| Chest | Right Wrist | Left Wrist | Right Ankle | Left Ankle | Back | Back | Right Wrist | Right Ankle | |
| Standing | 57.4 | 50.2 | 59.8 | 54.3 | 68.7 | 61.8 | 66.3 | 54.5 | 54.3 |
| Walking | 52.9 | 38.4 | 63.6 | 48.1 | 55.5 | 57.1 | 63.8 | 51.3 | 56.9 |
| Running | 44.1 | 37.2 | 60.2 | 48.9 | 54.2 | 62.3 | 66.3 | 49.4 | 54.1 |
| 2.36 GHz | |||||||||
| Action | Receiver at Right Hip, Transmitter at: | Receiver at Chest, Transmitter at: | |||||||
| Chest | Right Wrist | Left Wrist | Right Ankle | Left Ankle | Back | Back | Right Wrist | Right Ankle | |
| Standing | 65.3 | 44.5 | 74.7 | 60.9 | 70.7 | 75.3 | 73.0 | 70.5 | 66.3 |
| Walking | 59.1 | 47.3 | 59.8 | 53.9 | 58.5 | 67.4 | 72.0 | 64.9 | 62.4 |
| Running | 55.9 | 36.3 | 52.5 | 55.0 | 59.0 | 68.5 | 71.7 | 57.4 | 63.3 |
2.4 Astrin Model
Astrin performed measurements of a body channel taken at 13.56 MHz in order to be used for an IEEE standard [12]. The body channel at that frequency has a link loss similar to free space and can be used for body area network applications. However, due to the small available bandwidth, only low data rates of a few kbps can be transmitted. Therefore, the BANs operating at those frequencies can be used to signal an emergency condition or to transmit reliably a “wake up” signal to a sleeping BAN node [12].
The measurements were taken at specific locations on a live human body and are presented in Table 6. The signals received at various distances are shown in Table 7.
Table 6
| Description | Signal Amplitude Reduction | dB Loss in Relation to Air |
| Through the hand | 3.3% | −0.15 |
| Through the wrist | 2.8% | −0.12 |
| Torso, front to back | 3.4% | −0.15 |
| Through the thigh | 1.9% | −0.08 |
| Through the ankle | 2.8% | −0.12 |
| Left ear to right ear | 2.0% | −0.09 |
| Left ear to right ear, wearing metal glasses | 1.5% | −0.07 |

2.5 Aoyagi et al., Power Delay Profile Model
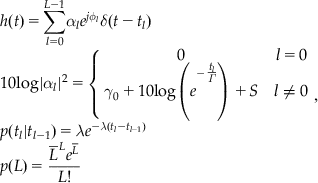
A power delay profile (PDP) model for the range 3.1 to 10.6 GHz was proposed by Aoyagi et al. [9]. The power delay profile of a channel represents the average power of the received signal in terms of the delay with respect to the first arrival path in multi-path transmission. Since signals in WBANs are usually transmitted following multiple paths, the channel response seems like a series of pulses. This mainly appears at these specific bands where highly frequency-selective channels are observed [9].
The PDP model is characterized by the following equations:
(6)
 (6)
(6)
where φl is the phase for the l-th path and follows a uniform distribution over (0,2π), αl is the path amplitude for the l-th path, tl is the path arrival time, L is the number of the arrival paths, δ(t) is the Dirac function, Γ is an exponential decay with a Rician factor γ0, S is a normal distribution with zero mean and standard deviation of σs, λ is the path arrival rate, and ![]() is the average number of the L. The corresponding parameters are given in Table 8.
is the average number of the L. The corresponding parameters are given in Table 8.

2.6 Dolmans and Fort Wideband Model
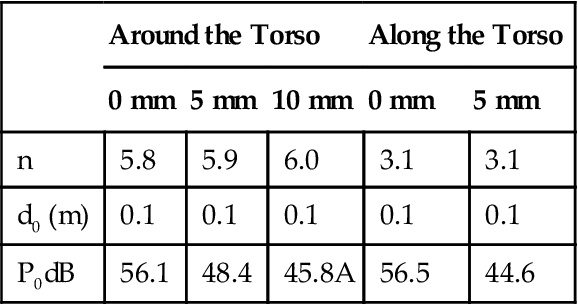
Dolmans and Fort proposed an ultra wideband (UWB) model in the range 3 to 10 GHz that satisfies the requirements for IEEE standards [10]. Wideband models are more complex than narrowband ones since there are more reflections in the channel. In the UWB range the propagation though the body is negligible and signal transmission is achieved through diffraction around the body and reflections from the surrounding environment.
The authors performed experiments in an anechoic chamber. A set of antennas was placed on a human body. The measurements were performed in six planes separated by 7 cm along the vertical axis of the torso. The reader is referred to [10] for more details.
The empirical power decay model was used and found to fit the numerical results obtained in an adequate manner, i.e.,
(7)
Table 9 shows the corresponding parameters. It is clearly seen that a much lower exponent is measured when the propagation is along the front (n≈3) rather than around the torso (n≈6).
2.7 Kang et al. Model
Kang et al. proposed a UWB body surface model at the frequency bands of 3.1 to 5.1 GHz, and 7.25 to 8.5 GHz, respectively [13]. At first the body posture effects were taken into account. The transmitter antenna was located in the left waist and receiver antennas were placed in various positions. Measurements were carried out in an anechoic chamber and office environments. The results are shown in Tables 10 and 11. All values are in dB scale.
Table 10
Body Posture Results at 3.1–5.1 GHz
| Action | Left Ear | Right Ear | Left Wrist | Right Wrist | Right Waist | Left Ankle | Right Ankle | |
| Anechoic Chamber | Standing | 62.2 | 61.6 | 64.9 | 67.5 | 64.2 | 72.8 | 69.1 |
| Sitting | 71.9 | 65.7 | 55.6 | 69.9 | 65.9 | 76.3 | 73.9 | |
| Office | Standing | 73.8 | 70.4 | 61.4 | 70.9 | 74.3 | 76.4 | 68.3 |
| Sitting | 62.3 | 72.1 | 65.6 | 76.3 | 74.7 | 79.8 | 75.7 |

Table 11
Body Posture Results at 7.25–8.5 GHz
| Action | Left Ear | Right Ear | Left Wrist | Right Wrist | Right Waist | Left Ankle | Right Ankle | |
| Anechoic Chamber | Standing | 81.7 | 83.9 | 69.3 | 63.9 | 76.1 | 76.8 | 77.1 |
| Sitting | 84.4 | 85.2 | 73.6 | 75.5 | 82.38 | 79.8 | 95.2 | |
| Office | Standing | 75.5 | 75.6 | 80.6 | 66.4 | 71.9 | 74.4 | 75.8 |
| Sitting | 67.1 | 84.5 | 67.0 | 67.1 | 67.5 | 70.6 | 83.4 |

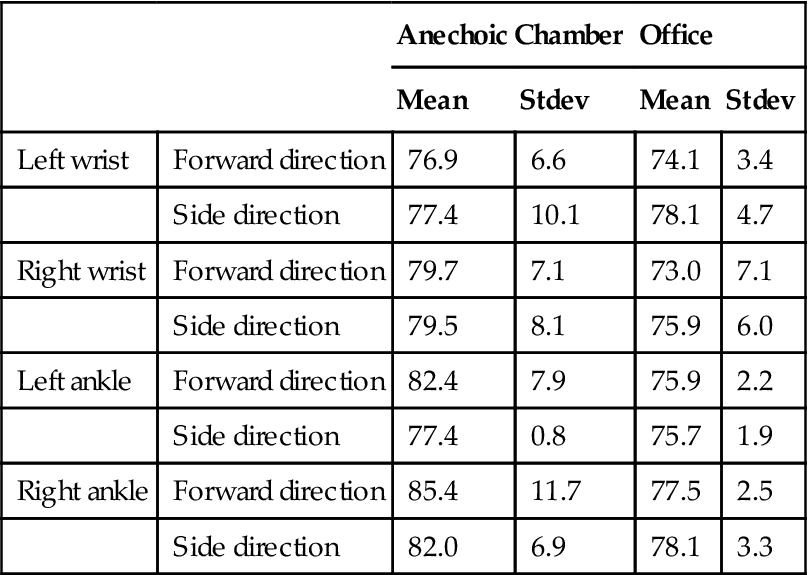
Then the effect of body movement was examined, i.e., an arm and a leg were moved in a forward or side direction during measurements. Tables 12 and 13 summarize the experimental results.
Table 12
Body Movement Results at 3.1–5.1 GHz
| Anechoic Chamber | Office | ||||
| Mean | Stdev | Mean | Stdev | ||
| Left wrist | Forward direction | 65.7 | 4.3 | 71.7 | 5.8 |
| Side direction | 70.9 | 6.0 | 76.6 | 7.7 | |
| Right wrist | Forward direction | 72.9 | 4.4 | 73.6 | 2.3 |
| Side direction | 71.8 | 5.9 | 75.1 | 3.1 | |
| Left ankle | Forward direction | 74.6 | 2.5 | 76.4 | 0.1 |
| Side direction | 67.9 | 6.8 | 70.4 | 8.4 | |
| Right ankle | Forward direction | 70.8 | 2.5 | 69.9 | 2.3 |
| Side direction | 72.8 | 5.3 | 69.6 | 1.9 | |

Table 13
Body Movement Results at 7.25–8.5 GHz
| Anechoic Chamber | Office | ||||
| Mean | Stdev | Mean | Stdev | ||
| Left wrist | Forward direction | 76.9 | 6.6 | 74.1 | 3.4 |
| Side direction | 77.4 | 10.1 | 78.1 | 4.7 | |
| Right wrist | Forward direction | 79.7 | 7.1 | 73.0 | 7.1 |
| Side direction | 79.5 | 8.1 | 75.9 | 6.0 | |
| Left ankle | Forward direction | 82.4 | 7.9 | 75.9 | 2.2 |
| Side direction | 77.4 | 0.8 | 75.7 | 1.9 | |
| Right ankle | Forward direction | 85.4 | 11.7 | 77.5 | 2.5 |
| Side direction | 82.0 | 6.9 | 78.1 | 3.3 | |
2.8 Kim et al. Model
Kim et al. proposed a dynamic statistical channel model for the IEEE 802.15.6 [14]. The measurements were performed in a radio anechoic chamber using a real-time channel sounding system at 4.5 GHz and bandwidth of 120 MHz. Measurements focused on capturing the fading effect that appears due to the movement of the human body. The transmitter was fixed on or around the navel and the measurements were conducted one by one at 10 receiver positions placed at the specific locations shown in Table 14.
Table 14
Distances Between the Transmitter and Receivers
| Position | Distance d [mm] |
| Right wrist | 440~525 |
| Right upper arm | 360 |
| Left ear | 710 |
| Head | 650 |
| Shoulder | 310 |
| Chest | 230 |
| Right rib | 183 |
| Left waist | 140 |
| Thigh | 340 |
| Ankle | 815~940 |
The authors tried to fit the measurement results by using some well-known probability density functions such as normal, log-normal, and Weibull distributions, and found the best match of them. In general, it was observed that the normal distribution provides a best fit of the still postures, the log-normal distribution shows a good match in cases of still postures and small movements, whereas the Weibull distribution can represent much better large movement behaviors. Table 15 summarizes the findings.
Table 15
| Position | Still | Walking | Up-Down |
| Right wrist | Normal | Weibull | Weibull |
| Right upper arm | Log-normal | Weibull | Weibull |
| Head | Weibull | Log-normal | Log-normal |
| Right ear | Normal | Log-normal | Weibull |
| Shoulder | Log-normal | Weibull | Weibull |
| Chest | Log-normal | Log-normal | Weibull |
| Right rib | Log-normal | Log-normal | Weibull |
| Left waist | Normal | Log-normal | Weibull |
| Right thigh | Log-normal | Log-normal | Weibull |
| Right ankle | Log-normal | Weibull | Weibull |

Tables 16, 17, and 18 present the various parameters for the three distributions. The values of the log-normal distribution in Table 16 are in decibels. The values in parentheses are negative log-likelihood values by which the best fit distribution were obtained (less means better fit).
Table 16
Fitting Results for Normal Distribution ![]()
| Position | Still μ/s [dB] (−LogL) | Walking μ/s [dB] (−LogL) | Up–down μ/s [dB] (−LogL) |
| Right wrist | 1.0000/0.1279 (−6303) | −3.0875/4.4063 (28972) | 8.9461/5.1576 (30220) |
| Right upper arm | 1.0000/0.1500 (−4735) | 3.2443/1.7012 (19332) | 7.3374/6.1415 (32061) |
| Head | 1.0000/0.0666 (−12706) | 0.4477/0.2445 (4535) | 0.9058/1.2629 (16207) |
| Right ear | 1.0000/0.1349 (−5826) | 0.7303/0.3014 (101) | 0.8205/0.8232 (12148) |
| Shoulder | 1.0000/0.0335 (−19782) | 2.6849/1.4627 (2153) | 1.5437/1.3265 (17519) |
| Chest | 1.0000/0.3481 (3600) | 3.6360/2.4688 (17849) | 7.1082/9.2594 (36609) |
| Right rib | 1.0000/0.1654 (−3812) | 0.8572/0.2744 (1256) | 4.7043/2.9597 (24784) |
| Left waist | 1.0000/0.0399 (−17978) | 0.7264/0.1609 (−4018) | 0.5458/0.3105 (2456) |
| Right thigh | 1.0000/0.0964 (−9254) | 0.6500/0.4388 (5831) | 1.1357/0.6949 (10272) |
| Right ankle | 1.0000/0.0787 (−11025) | 1.6070/0.9968 (14248) | 1.2489/1.2220 (16122) |
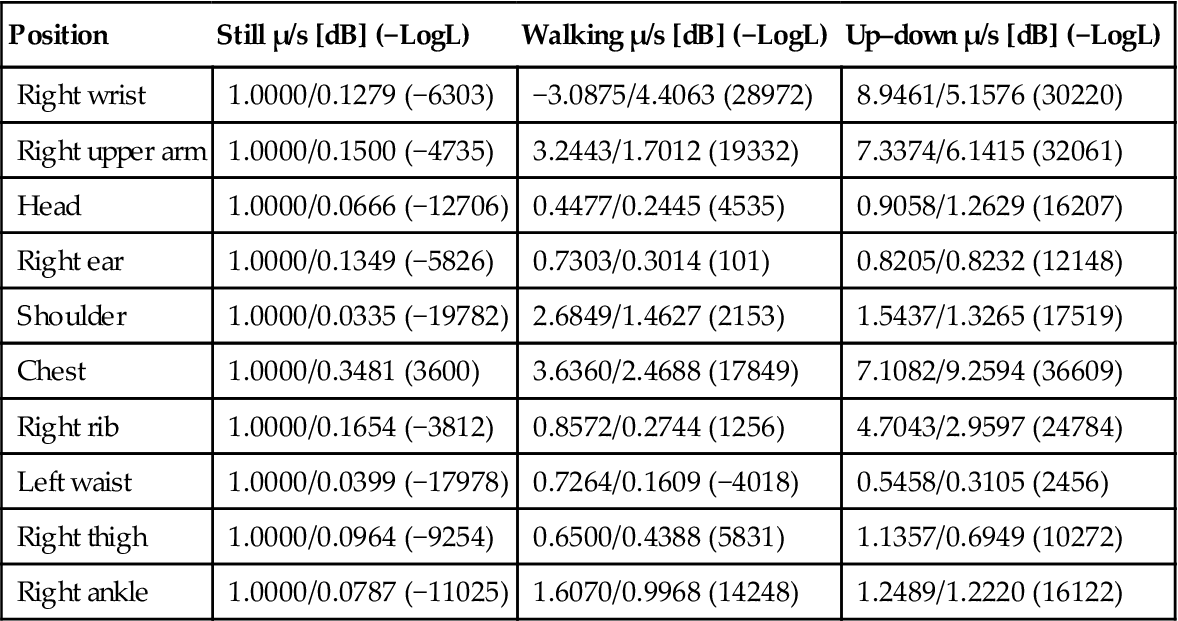
Table 17
Fitting Results for lognormal Distribution ![]()
| Position | Still μ/s [dB] (−LogL) | Walking μ/s [dB] (−LogL) | Up–down μ/s [dB] (−LogL) |
| Right wrist | −0.0652/0.9531 (−1114.1) | −3.9908/11.7727 (14948) | 8.4456/3.4836 (31047) |
| Right upper arm | −0.0491/0.6544 (−4800.9) | 4.4491/2.4972 (18735) | 6.3009/5.6692 (31093) |
| Head | −0.0100/0.2969 (−12476) | −3.5392/3.2052 (2983.8) | −3.6932/5.3385 (7601) |
| Right ear | −0.0400/0.5921 (−5815.6) | −4.1465/2.4654 (−1005.5) | −3.3130/5.2458 (8384.1) |
| Shoulder | −0.0024/0.1453 (−19806) | −1.8011/2.0549 (2507.8) | 0.2165/4.1023 (14537) |
| Chest | −0.2359/1.4019 (2315) | 3.6360/2.4688 (16779) | 5.0788/6.4077 (29907) |
| Right rib | −0.0470/0.6043 (−5657.3) | −0.8883/1.3994 (818.79) | 5.7033/3.2101 (24051) |
| Left waist | −0.0035/0.1742 (−17942) | −1.4965/0.9770 (−4109.5) | −3.5588/3.3466 (3337.8) |
| Right thigh | −0.0191/ 0.4017 (−9717) | −2.6924/2.6453 (2970.7) | −0.5995/3.7712 (11098) |
| Right ankle | −0.0131/0.3352 (−11251) | 0.9424/3.7030 (14861) | −1.1303/4.7167 (12357) |
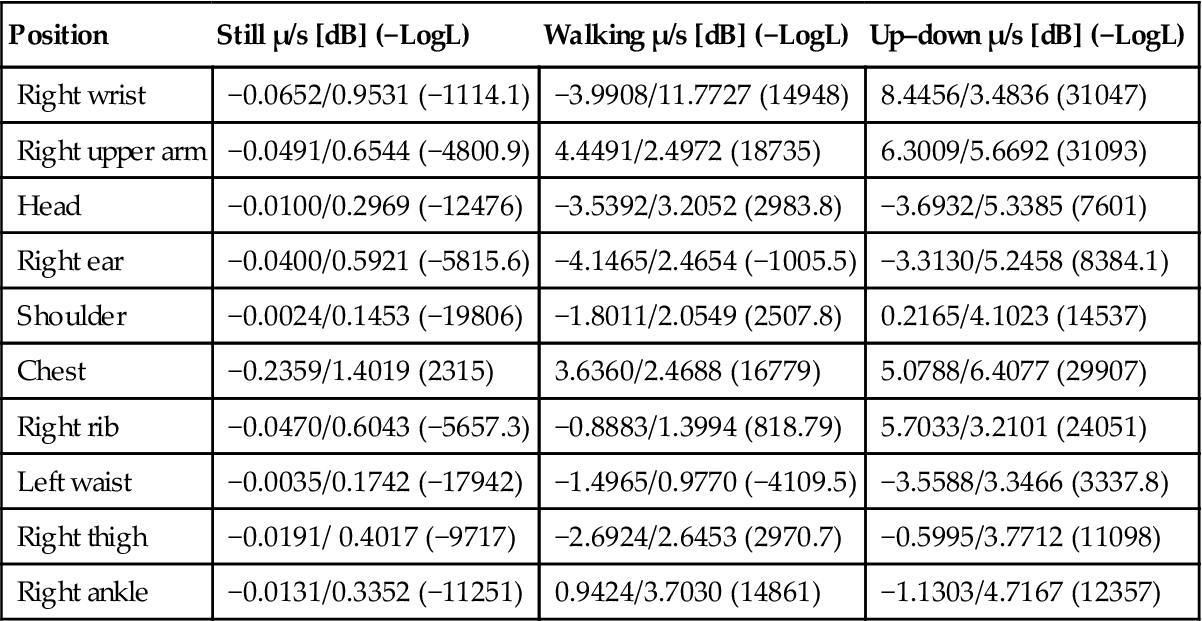
Table 18
Fitting Results for Weibull Distribution ![]()
| Position | Still a/b (−LogL) | Walking a/b (−LogL) | Up–down a/b (−LogL) |
| Right wrist | 1.0478/7.7411 (−5770.3) | 1.4690/0.4510 (14629) | 10.0006/1.7319(29786) |
| Right upper arm | 1.0655/7.3618 (−4529.3) | 3.6759/2.0325 (18625) | 7.5368/1.0787 (29631) |
| Head | 1.0297/17.9473 (−13029) | 0.6360/1.5519 (3061.7) | 0.8015/0.8228 (8458.3) |
| Right ear | 1.0594/7.7870 (−5394.6) | 0.5071/1.9516 (−840.12) | 0.8224/1.0055 (7959.7) |
| Shoulder | 1.0165/29.8877 (−18940) | 0.8237/2.6536 (1913.3) | 1.6534/1.2203 (14452) |
| Chest | 1.1203/2.9913 (3487.2) | 3.0419/1.9575 (16909) | 6.3808/0.8247 (29393) |
| Right rib | 1.0742/4.9107 (−1979.2) | 0.9539/3.2009 (1357.2) | 5.2709/1.6440 (23654) |
| Left waist | 1.0190/28.9055 (−17946) | 0.7915/4.9572 (−3903.2) | 0.6117/1.7907 (1823.7) |
| Right thigh | 1.0464/9.6410 (−7951.2) | 0.7325/1.6297 (3867.9) | 1.2626/1.6251 (9539.3) |
| Right ankle | 1.0379/11.8572 (−9813.1) | 1.7880/1.6227 (13323) | 1.2867/1.0759 (12124) |

3 Independent Studies
Since the subject of body area networking is an appealing research topic, a large number of independent studies have appeared in the technical literature in recent years. Accurate propagation models for body surface communication have been derived by research groups around the world, and these models can be applied to either general or specific-purpose WBAN architectures. It is obvious that a full presentation of these works cannot be properly done here, therefore, only some indicative studies are discussed in the following subsections.
3.1 CWC Oulu University Model
The Centre of Wireless Communications (CWC) at Oulu University of Finland performed extensive measurements at the Oulu University Hospital, focusing on the UWB band [15]. The aim of the work was to generate realistic WBAN channel models to be used in designing WBAN applications for hospital use. The results obtained were compared with the ones provided by the IEEE group.
The measurements took place at an anechoic chamber, classroom, and different hospital rooms. Three hospital cases were examined, i.e., a surgery room, a conventional ward room, and a corridor. The last two environments took into account the specific propagation characteristics that are valid, whereas the anechoic chamber was used to validate the measurement system performance. The frequency range lies between 3.1 GHz and 10 GHz, and 100 consecutive frequency responses were taken using a proper vector network analyzer [15]. Table 19 presents the parameters used during the experimental process.
Table 19
| Parameter | Value |
| Frequency band | UWB |
| Bandwidth | 6.9 GHz |
| IF Bandwidth of VNA | 3 KHz |
| Number of points over the band | 1601 |
| Max detectable delay | 231 ns |
| Sweep time | 800 ms |
| Average noise floor | −120 dBm |
| Transmit power | 0 dBm |
| Tx and Rx cable loss | 7.96 dB |
Two situations where a patient was either lying down or standing were considered. For more information about the experimental process and the measurements setup scenarios the reader is referred to [16] and the references therein. Roughly speaking, two cases were examined, A1 and A2, referred to as on-on-links and on-off-links. In A1 cases, the antenna positions were changed to cover more links.
The channel model was deduced from the measurement data yielding to the double-cluster model. The fast decaying first cluster corresponds to the effect of a human body and the second cluster occurs from the surrounding reflections [17]. The path amplitude decay is given as
(8)
 (8)
(8)
where γ01, γ02m are the Rician factors and Γ1, Γ2m the exponential decaying factors for the two clusters. M is the number of sub-clusters within the second cluster and l1 and l2 are the number of multi-path components in the first and second cluster, respectively. The amplitude variations are modeled with a log-normal distribution having zero-mean and standard deviation, σ. The time difference between the consecutive arriving paths follows the exponential distribution, i.e.,
(9)
where t is the arrival time following a Poisson distribution and λ is the rate of path arrival in a cluster. Finally, the number of arrival paths L also follows a Poisson distribution as
(10)
where μL is the average of L. Table 20 shows values for these parameters found using the least square method.
Table 20
| Conventional ward | Corridor | |||||
| Standing | Laying down | Standing | ||||
| A1 | A2 | A1 | A2 | A1 | A2 | |
| γ01 (dB) | −61 | −74 | −64 | −65 | −47 | −27 |
| γ02 (dB) | −91, −82, 19, −87, −6, −99 | −83 | −85 | −84 | −82 | −82 |
| Γ1 | 1.11 | 6.67 | 3.12 | 4.14 | 0.77 | 1.47 |
| Γ2 | 30.30, 31.25, 2.44, 29.41, 4.55, 108.7 | 31.25 | 32.26 | 29.41 | 24.39 | 24.39 |
| σχ1 (dB) | 2.45 | 4.41 | 6.31 | 4.86 | 3.75 | 1.96 |
| σχ2 (dB) | 2.07, 2.21, 1.62, 1.44, 1.2, 0.91 | 2.8 | 3.5 | 2.79 | 4.04 | 2.46 |
| 1/λ1 | 3.717 | 8 | 4.764 | 6.024 | 6.024 | 6.024 |
| 1/λ2 | 6.125 | 5.43 | 6.369 | 8 | 1.667 | 1.667 |
| μL | 324 | 323 | 324 | 323 | 324 | 324 |

3.2 Wang et al. Model
Wang et al. derived a channel model in the UWB band for on-body communications. The model takes into account the statistical variations of several body postures and movements [18]. It was derived based on a realistic human body model, and numerical electromagnetic field analysis techniques were used. Specifically, a dipole transmitter was placed on the left chest and five receivers were located on the right chest, the left and right waists, and the two ears. Nine postures were used for standing, ten for walking and running, and six for sitting. To characterize the UWB model the authors applied a proper modification of the Saleh-Valenzuela model [19]. A detailed analysis can be found in [2,18].
At first, the path loss for the five links was estimated based on a simple path loss formula; the results are shown in Table 21.
Table 21
| Receiver | Distance (m) | Path Loss (dB) |
| Right ear | 0.31 | 61.7 |
| Left ear | 0.26 | 58.8 |
| Right chest | 0.16 | 50.8 |
| Right waist | 0.56 | 71.4 |
| Left waist | 0.53 | 70.5 |
Then, the average power delay profile was shown to decay exponentially whereas the log-normal distribution was found to provide the best fit to the power distribution in the multi-paths. The authors found that the inter-path delay that is related to the temporal delay between two successive paths follows the inverse Gaussian distribution, i.e.,
(11)
The parameters of the model are depicted in Table 22, where γ is the time constant for power decay, σ is the standard deviation of power distribution, τ0 is a constant representing the mean arrival time of first path, τk-τk−1 represents the inter-path delay following the inverse Gaussian distribution, and Ω0 is the mean power gain of the first path.
Table 22
| Parameters | Right Ear | Left Ear | Right Chest | Left Waist | Right Waist |
| γ (ns) | 0.38 | 0.26 | 0.21 | 0.30 | 0.47 |
| σ (dB) | 7.5 | 12.56 | 15.6 | 8.46 | 7.87 |
| τ0 (ns) | 1.46 | 0.92 | 0.68 | 1.89 | 2.01 |
| τk-τk−1 (ns) μτ | 0.30 | 0.56 | 0.37 | 0.38 | 0.33 |
| τk-τk−1 (ns) λτ | 1.08 | 0.45 | 1.43 | 0.75 | 0.85 |
| Ω0 (dB) | −60.7 | −62.1 | −53.3 | −71.5 | −69.9 |

A discrete time impulse response function applied to the five transmission links with the corresponding parameter values is then implemented based on the modified Saleh-Valenzuela model:
(12)
where αk is the multi-path power gain and tK is the delay of the kth multi-path component corresponding to the arrival time of the first path. The model implementation is thoroughly discussed in [18].
3.3 Reusens et al. Model
Reusens et al. investigated the propagation channel between two half-wavelength dipoles at 2.45 GHz, placed near a human body [20]. Propagation measurements for different parts of a body were performed on real humans in a multi-path environment. Path loss was also numerically investigated with simulations. The channel parameters were extracted from the measurement and simulation data.
For the measurements along the arm, the transmitter was located on the wrist and the receiver at various positions towards the shoulder. The measurements for the back and the torso were performed by placing the transmitter at different positions at the shoulder height and the moving receiver below the transmitter. For the leg the transmitter was located at the ankle and the receiver was moved toward the knee. Moreover, an average path loss model for the whole human body was obtained through fitting of all measurement data. Eq. (7) was used to estimate the path loss between the transmitting and the receiving antennas as a function of the distance. Table 23 presents the parameter values of the fitted path-loss models.
Table 23
| Parameter | Arm | Leg | Back | Torso | Whole Body |
| d0 (cm) | 10 | 10 | 10 | 10 | 10 |
| P0,dB (dB) | 32.2 | 32.5 | 36.8 | 41.2 | 35.2 |
| N | 3.35 | 3.45 | 2.18 | 3.23 | 3.11 |
| σ (dB) | 4.1 | 5.3 | 5.6 | 6.1 | 6.1 |

Simulations with a realistic human body phantom were also performed and were in agreement with the measurements. The cumulative distribution functions of the deviation of measured path loss and models were found to follow the lognormal distribution.
3.4 Queen’s University of Belfast Models
The wireless communications research group at the Queen’s University of Belfast is quite active on channel modeling for on-body communications. Over the years, the group has performed extensive research in order to examine the propagation aspects of wearable communications systems for a range of environments [21]. Much of the research focus for WBAN applications has been centered on the unlicensed industrial, scientific, and medical (ISM) bands at 868 MHz and 2.45 GHz.
In [22], stationary and mobile user scenarios for on-body communications at 868 MHz were investigated. Twelve on-body propagation paths, located on the upper torso and limbs, were considered. Measurements were taken in an anechoic chamber, open office area, and hallway environments. The authors focused on the fading effect appearance. They identified that two-thirds of the paths were Nakagami distributed while the remaining were Rician. The majority of the Nakagami paths occurred when the user was stationary. The performance of three diversity combination schemes for two-branch spatial on-body diversity systems was investigated in [23].
In [24], fading characteristics or a WBAN operating in an outdoor environment at 2.45 GHz were presented. Both stationary and moving users were examined. When the user was stationary, a small amount of fading was observed for stationary users. When the user was moving, small-scale fading significantly increased, characterized by the Nakagami distribution.
Several other studies have also been performed. Interested readers are directed to the group website [25] for more information.
3.5 University of Birmingham and Queen Mary University Models
Experiments on on-body communications were also performed by research teams of the universities of Birmingham and Queen Mary, University of London [3]. One such experiment is discussed in [26] where the propagation path loss of an on-body channel was measured at 2.45 GHz. First, the antennas were attached to the body at a number of positions and orientations, and measurements were taken inside an anechoic chamber. Next, measurements inside of a laboratory were performed that indicated significant differences in path loss. Finally, additional measurements were also taken while walking on the campus of the University of Birmingham. Movements caused variations in the distance between the antennas, which made the channel variability quite severe.
In [27] the path gain and its variations were examined in some realistic scenarios. Short-term and long-term fading statistics were investigated. It was shown that the short-term fading was best described by a Rician distribution with the K-value log-normally distributed and the long-term fading by a gamma distribution.
4 Conclusions
Channel modeling is a necessary and important task to evaluate the performance of a WBAN network. Some of the most significant studies on the topic that have appeared in the literature were presented in this chapter. The majority of them were submitted following the recommendations of the IEEE 802.16.6 subgroup or presented at IEEE BAN meetings. Most of the IEEE as well as other models were derived from a set of experiments using wearable sensors in several body positions and at a specific frequency band. Efforts have been made to make the models as realistic as possible, despite the adversities that often appear due to the complex nature of the human body as a signal transmission medium.
The models presented could help designers predict the performance of a network they wish to design. Some models such as the Aoyagi et al. are quite simple and generic; one has to determine mainly the frequency of operation and the environment in which he wishes to build the network. More detailed information is given by the other models, but the designer should pay attention to the particular environment characteristics, parameters, and network topologies. Of course, several other requirements on the physical and MAC layer briefly presented in [28] should be satisfied; e.g., operation in a power-constrained environment, appropriate data rates, coexistence with other wireless network devices, etc.
The extraction of an adequate channel model is the first step in the performance evaluation of a WBAN network. The clearest view of physical layer performance is obtained by examining suitable metrics such as the bit error rate, the outage probability of point-to-point links following the path losses suggested by the above channel models. In view of the above, such a detailed analysis is more than necessary.
However, the general drawback of the propagation WBAN models discussed in this chapter is that they refer to specific node topologies, different environments, e.g., anechoic chamber, etc., and they were tested to be applicable to specific frequency bands. Therefore, a derivation of a generalized model seems to be a challenging research direction. That model should be obtained by fitting properly a large number of measurements collected by different human body locations. The model deduction process should meet the general guidelines and know-how techniques that are already used in the area of RF communications, e.g., the model should be as simple as possible and contain the minimum necessary parameters such as transmission distance, operating frequency, factors describing the environment, etc. In such a case, it would be quite interesting to regulate rules about the path-loss behavior in terms of frequency increase in discrete steps.
Acknowledgements
The present study has been co-financed by the European Union (European Social Fund – ESF) and Greek national funds through the Operational Program “Education and Lifelong Learning” of the National Strategic Reference Framework (NSRF) - Research Funding Program: ThalesInterdisciplinary Research in Affective Computing for Biological Activity Recognition in Assistive Environments. Investing in knowledge society through the European Social Fund.