
Implementing a Value-Based Cost Management System—Part II: Collecting and Analyzing the Data
Money is like water. When water is moving and flowing, it cleanses, it purifies, it makes things green, it’s beautiful. But when it starts to slow down and sludge, it becomes toxic and stagnant.
Lynne Twist1
At the heart of the value-based cost management system (VCMS) lies the simple fact that money is the lifeblood of the organization. The goal of the VCMS is to ensure that this money flows in the direction valued by customers. Creating a constant cycle of invest-harvest-reinvest, the VCMS is an engine of growth that helps unite the organization in its quest for creating superior value for the customers who determine the ultimate worth of the company’s endeavors. Because it is a top-line-driven growth model, the VCMS requires education to ensure that the benefits are reaped and the data collected is reliable. The VCMS process begins with education of key stakeholders and communication with the firm’s employees to build awareness and knowledge of the VCMS and to help them understand the goals of the VCMS.
Education—A Major Step
Educating the managers of the organization on the goals and structure of the VCMS is a critical and essential major step in the VCMS implementation. This education can be done through a series of meetings offered at various times to assure maximum possible attendance. These meetings provide an opportunity to air concerns and to ensure that there is a sound understanding of the project, its goals, and what will be required from each manager and each work group. In our experience we have learned that when the CEO leads the first meeting, this has a positive impact on the success of the project and a strong influence on the firm’s managers and their acceptance of the project.
Our field work experience has shown that it is best to start the initial meeting with managers by sharing with them a specific example and results from the electronics firm field work presented in Chapter 2. The second major model that has proven useful to explain the concepts underlying the implementation is the VCMS “target” diagram. This introduction places the VCMS project in the right context—a quest to do a better job serving the final customer. It is also important to lay out the customer value profile during this meeting, so managers clearly understand that the model is customer-driven. What issues should be addressed during this meeting?
• The fact that the model is customer-driven should be emphasized.
• Customer value profile data should be presented.
• Clear definitions of value-add, business value-add, and waste should be developed.
• The data collection requirements should be discussed.
• An example of how the data is collected should be walked through.
• Specific mention of the strategic nature of the project should be made.
• Reinforcement of the fact that the project is not concerned with operational control should take place.
• Any linkages to other continuous improvement initiatives, either currently underway or recently completed, should be stressed.
• If process data is to be collected, the process framework should be presented.
• The way the data is to be used should be emphasized.
• The importance of being willing to identify waste in the activity analysis needs to be stressed as the basis for improving performance by redirecting these resources to value-added work.
Ample time needs to be left for questions, as managers are often interested in knowing whether this is a one-time study or a long-term implementation and frequently have many questions about the bullet diagram. Since the data will need to be collected and then updated on a regular basis, it is important that time is provided to make managers comfortable with the data collection instrument and its targeted usage so that they can manage this instrument on their own after the initial data collection is completed.
When the meetings are over, managers should be queried via e-mail to determine if they have any further questions or concerns. This e-mail should also collect information for scheduling the project interview so that the interview team can begin to develop a work plan. It may take follow-up e-mails and phone calls to get all of the managers scheduled. This is one of the major tasks performed by the interview team. It needs to be managed efficiently to ensure that interviews are held to the 30- to 45-minute time allotment that has been found to be needed to complete the data collection interview. If managers have been effectively briefed during the first educational meeting, the interview team’s job is made much simpler and the task can be shortened significantly. It is recommended that the team allows one hour in their schedules to complete each interview because they may end up with questions of their own or need to spend time reviewing the results.
The Interview Team
The section above notes the fact that there is an interview team. This is a subset of the total team that is dedicated to the project on a full time basis. Our work suggests that the interview team needs to consist of managers at roughly the same level as the managers being interviewed to prevent the feeling that management is intruding in the department’s business (see Figure 7.1). If the organization has an internal control group, it is often quite useful to task these individuals as the interview team because managers are more accustomed to answering questions from this group. The same holds true for employees that have been involved in the lean management initiatives. These employees have earned trust in their respective organizations and might be more effective in collecting not only information about value add but also information about activities that might be wasteful.

Figure 7.1. The interview team.
Since the interview team bears the brunt of the data collection, each member should be fully trained on the structure of the data collection instrument. The team members need to be comfortable with the instrument and be able to correct specific calculations if the data instrument becomes compromised during the interview process. The composition of the data collection team, then, needs to include mid-level managers who are respected for their discretion and honesty in the organization. Highly political individuals do not work out well, as their motives can be questioned, leading to false responses by the interviewees or noncompliance with the project in general. Clearly there is no avoiding politics, but the project should aim to be as apolitical as possible in order to be as successful as possible in reaching its objectives.
Completing the Data Collection Instrument
Chapter 6 walked through the various segments of the data collection instrument. The data collection starts by filling in the basic information about the respondent—name, department, and contact number. The next question is the number of full-time equivalent employees that work for the department. While this seems like a straightforward question, the presence of part-time workers, shared workers, and in Easy Air’s case seven days of operation can make this question difficult to answer. Since this number drives a majority of the key calculations, it’s important that this number makes sense to the manager. At Easy Air the decision was made to use staffing on an average day. The department had more people than the daily total because they had to cover seven days of operation. But the data collected focused on an average day of work, so daily numbers were used throughout.
Once the number of individuals, namely full-time equivalents, is agreed upon, attention turns to noting what activities are done by the department. The manager needs to have a sound understanding of the key activities his or her group is expected to complete. Some managers prefer to develop the entire list of activities first, and then go back and assign people time to them. Others work one activity at a time, completing all of the data input for each activity as they go. The team member should accede to the preferences of the responding manager to make the data collection more comfortable for the manager.
It takes the most time to collect the activity data and then assign people time to the various activities. The manager needs to identify how many people are involved in each activity and on average what percentage of these individual’s time is allocated to the activity. If not all employees spend the same amount of time on the activity, then an average needs to be calculated. The team member should carry a simple 10-key calculator for cases such as this.
The sheet automatically tallies the total time being assigned, resulting in a shift from “false” to “true” at the bottom of the section when all of the people time has been accounted for. Getting to “true” often requires several iterations, with the potential of having to “force” one activity’s time to get the total accounted for properly—100% is critical for the accounting aspect of the analysis. Once this step is completed, attention can turn to the value-add and attribute data.
The assignment of value-add is done across the five categories (value-add, business value-add—indirect, business value-add—future, business value-add—administrative, and waste), totaling to 100%. The worksheet shows this total, so it usually only takes a few minutes to complete this section. It is vital for the team member to stress that there is waste in every activity. The responding manager may still hold back in assigning waste to the department’s activities, but the attempt needs to be made to have at least some level of waste noted. This is where it’s important to explain that there’s no room for improvement if there isn’t any waste to be removed.
Only those activities that are designated as having customer value-add map to the next section of the data collection instrument. Now attention turns to assigning the activity’s value to one of the predetermined attributes. In our field work we have found that managers often find this challenging, especially if they included activities as value-add that really aren’t value-adding in the customer’s eyes. This step presents an opportunity to bring the customer value perspective into the organization and share with managers the key data gathered during the customer data collection phase. The attribute data collected needs to sum to 100%. The instrument should automatically keep track of this amount.
The team members need to know the amount of total budget by department. In practice we often observed that if the team member has this information in advance, then a good way to start the meeting is by the manager and team member agreeing that they are both working with the same budget for the department. If an error exists in the budget summary sheet from finance, then the error can get cleared early in the process. In case of discrepancy, the team member needs to use the manager’s estimate, leaving reconciliation with finance as a follow-on task. The number is placed in the preset “budget” box on the lower portion of the instrument. The entire financial picture then automatically fills in, a result which usually pleases the participating manager.
Once the interview is completed and all the data is collected, it is best to share a copy immediately with the responding manager. This step is critical for the visibility of the project—managers have to feel that they own their data and have control over it. In our field work, we’ve experienced occasions where a manager wanted to make changes to the data sheet after the interview. We recommend that this be allowed, as filling out the sheet the first time is a learning experience.
Creating a Master File
All of the managers do not have to be interviewed before the data for all departments is organized in the master file. In this part of the process, the database experts can be very useful. Depending on how the information is going to be used, it may be appropriate to transfer all of the data into a relational database, such as an Access database. Because this is one option for creating the master file, it is critical that every worksheet completed by the interview team be identical. No matter what software is used, it’s still critical that all the worksheets used for data collection remain the same so the analysis and compilation can go smoothly and without additional adjustments or interpretations.
If process data has been collected during the data collection phase, the master file should be sorted by process codes (see Chapter 8 for more details) and summarized. This often presents a learning experience for the company, as the cross-functional nature of the activities that make up the process becomes visible. One of the activities in the process that in our experience receives the greatest amount of time and money in most VCMS studies is management itself. The size of this number often leads to immediate suggestions in a company to cut back on the reporting and meetings requirements for their managers so more time can go to value-adding work. Since management is mostly an administrative task, it seldom results in customer value-add. If an organization is spending inordinate amounts of money simply managing itself, it will find it harder to compete in the global marketplace compared to organizations with a leaner management structure.
The master data file should retain the department information for each activity reported. This information usually needs to be added to the data collection worksheet and can become a column that automatically fills with the departments’ abbreviated name or number. It is data that has usually been added as the master file was put together, but there is no reason why it can’t become part of the master data collection sheet. It just requires a new column and a new pivot cell where the data is entered.
The master data file needs to focus on the bottom segment of the worksheet, where the activities and value attributes have been assigned a monetary value. The top part of the worksheet is to ease data collection—the key analysis using the data will focus on the financial aspects of the organization’s operations. A master folder of all the completed worksheets should be kept so that future data collection is made more efficient, but the master file itself emphasizes the financial analysis contained in the datasheets.
The Informative Cost Summary
Once all of the departments’ data have been collected and a master file of the financial results compiled, attention turns to actually creating the informative cost summary. For this purpose the dollars of value-add, business value-add, and waste are summarized, as is the total dollar amount applied to each value attribute. This analysis needs to be summarized for the organization as a whole. Since the dollars of value-add by value attribute are crucial for the development of the multipliers, this information is a critical output of the informative cost summary.
The results of this analysis make up the first part of the management report. It allows management to see whether, in general, the resources of the firm are being directed toward the activities and outcomes prioritized by the management. When spending on business value-add—future activities is low in the organization, this is clearly visible. In our field work, waste is usually somewhere around 20% in most organizations, although getting managers to identify this level of waste in the early stages of the VCMS implementation is often challenging. If waste is greater than 20%, it signals that the company might need to undertake a lean initiative if it isn’t already doing so.
Value-add should also be somewhere in the 20% range as a benchmark. In firm after firm studied to develop the VCMS, value-add has been very close to 20%. Given that this data is the key to understanding whether a company is pursuing customer requirements in a profitable way, if it is below 20% the firm will likely be struggling with profitability. If the sum is greater than 20%, the firm might be highly customer-focused or operating in a differentiated market and is therefore more likely to have higher profitability.
If customer segment data has been developed (see Figure 7.2), it is important to add this feature to the data collection sheet. This usually requires the insertion of another section that queries how much of an activity goes to a specific customer segment. Once again tallying to 100%, this data is straightforward to collect. It results, though, in two summaries in the financial analysis—one for the company as a whole and one by segment. This is when using a relational database becomes useful, as it becomes fairly complex to maintain all of these data in Excel. If the company treats all customers alike (a generic strategy), customer segment information does not need to be collected. A process-oriented result for Windows, Inc. is presented in Figure 7.3. The results are for the first process—the development of a strategy.

Figure 7.2. Customer segment data.

Figure 7.3. Tracing costs to attributes.
Developing and Interpreting Value Multipliers
Having traced the resource consumption of the firm to specific value attributes, it is now possible to combine the revenue equivalents by value attribute with the value-added cost for that attribute. As you may remember, the value multiplier is calculated by dividing the revenue equivalent by the value-added dollars that are needed to deliver that value attribute. If the company doesn’t pursue a market segmentation strategy, there will be only one set of multipliers. If segments are managed differently, though, then two sets of multipliers will be developed—one for the company in general and one that details results by segment. Finally, if the data collection suggests that there is more than one segment, as was found at Impact, Inc., then multipliers may be needed for each newly identified segment.
An example of the value multipliers by segment for General Telecom (GTI), one of the earliest projects completed in the VCMS analysis is presented in Figure 7.4. The goal is to present the data in such a way that management can have a strategic perspective where they are spending too much or too little to deliver on specific components of the value profile. This is a critical part of the data analysis that needs to be shared with management.
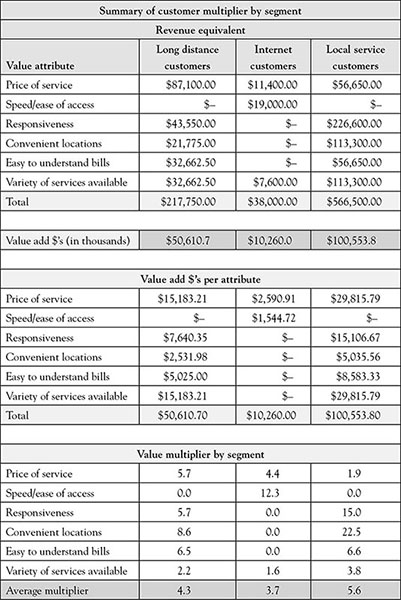
Figure 7.4. Value multipliers by segment.
Looking at the value multipliers for GTI, we observe that the average multipliers are below 5 except for the local service customers, who were relatively happy with the company’s service. The company was perceived as responsive to traditional customers and had convenient bill paying locations, suggesting that the high multipliers on these attributes were competitive strengths. Unfortunately, the local service customers weren’t valued by the firm as they were perceived as being satisfied with a dial tone only. GTI’s managers were actively pursuing the Internet segment, where our analysis shows that most of its spending was wasted (multipliers of zero). In this segment GTI had a high rating on speed and ease of access, suggesting it was doing a good job for this segment, but our analysis shows that the other two segments didn’t value this spending at all. This was significant and valuable information for GTI’s management team.
The VCMS system clearly shows the value of customer segment data to aid the firm in evaluating its strategy. After the field work was completed at GTI, more attention was paid to the local customer, who was identified as the cash cow for the company. Spending on the Internet segment was disciplined so that the activities that were valued by the Internet customer segment received the greatest attention while spending was cut back on other attributes not valued as strongly by this segment. Finally, effort was reduced in terms of providing options to long-distance customers as this low multiplier suggested the firm was overspending on this activity.
The value multipliers are the ultimate objective of the VCMS system. They provide the strategic evaluations so critically needed by firms seeking to maximize the value they create for customers. Finding out exactly what customers value, and by how much, can help the firm focus its internal activities into areas that provide the best pay-offs. As was determined at GTI, a one-size-fits-all operating structure could result in some very dissatisfied customers.
For the local service customer, at the time of this study, Internet access just didn’t matter. This result would probably be different if the study was done again, as most homes now have Internet access and many different providers are competing on an ongoing basis for this business. This fact underscores the need to revisit the VCMS analysis and update the data regularly. If the information is used to support continuous improvement activities, the internal data needs to be collected monthly or quarterly. And, a customer-centered firm needs to be in continuous contact with its customers to learn how and if customers value specific attributes. It is also important to see if the level of competition in the market is changing and to find out how well the company is doing in meeting changing customer expectations. Once the VCMS data collection instrument has been mastered it is relatively easy to keep the data current and monitor how well the organization is doing in meeting its goals.
Reporting Back Out
Once the data analysis has been completed, it is very important to share results with the managers who were part of the project. The results of the VCMS study need to be shared with everyone in the organization who participated in the data collection process or might in some way be connected to the project. In order for the VCMS to have an organization-wide impact, everyone needs to see the results of the data collection and the final analysis.
When everyone is informed about how well, or poorly, the company is doing in meeting customer requirements, more time and attention can be paid by individual managers and departments to ensuring that spending is directed toward those activities customers value. Change initiatives that are driven by what is now a well-defined strategy are the result of a successful VCMS initiative. Communicating the strategic objectives is now given new shape and direction—the VCMS makes the strategy of the firm visible and actionable. Serving as a new communication tool that unites the entire organization in the goal of meeting and exceeding the delivery of customer value and meeting customer expectations is one of the strongest justifications for implementing the VCMS. Strategy and activities are placed within a common framework and measures are used to reinforce the goals of the customer-centered organization.
So, reporting back out means more than holding a top management briefing meeting. Clearly this needs to take place, but the results of the study need to be made part of the monthly reporting package that all managers receive. In doing so, the VCMS becomes part of the structure of the firm, keeping everyone’s eyes focused on serving the customer.
Building VCMS In to the Management System
As the previous discussion suggests, it is important to build the VCMS into the management structure of the firm. Since the multipliers and value-added information provide key indicators of how successful the firm is in directing its spending and activities to those areas valued by customers, it is important that the VCMS not be a one-off study, but rather part of the daily lexicon of the organization.
There are several ways that the VCMS can be built into the management system. These include the following:
• Monthly reports by department of the value-added results.
• Monthly reports of the overall results of the company against its customer segments.
• Inclusion of the VCMS results by month in the monthly management briefings.
• Tying of the VCMS to other continuous improvement projects underway, such as lean process management.
• Linking of the VCMS to the strategic language of the firm.
• Movement to homogenize the language of the firm regarding its customers to reflect the VCMS structure.
• Building the VCMS structure into the budgeting system of the organization
• Using some aspects of improvement on the VCMS metrics as part of the formal evaluation system.
The goal is to make the VCMS part of the regular reporting routine, improving, and evaluating the performance of the organization. Strategic in nature, the VCMS provides a signal to everyone in the organization about those activities which are more likely to create customer value. It has also been found that by including business value-add indirect, employees can identify which activities touch the customer in some way. Every time a customer is put first in a decision, the company overall makes choices focused on the correct objective. Putting the customer first in every activity is the ultimate objective. It is an ongoing project, not a one-time study.
Summary
In this chapter we continued the discussion of the implementation of the VCMS, emphasizing how the data is collected by a subteam of the implementation team. Focus was also placed on how the VCMS data is analyzed, including the development of segmented data that can help the company focus its attention away from a one-size-fits-all strategy to one where the individual segment needs of the customer population are served.
The key in any implementation is good communication. When the data from the VCMS study is analyzed, its results need to be distributed among all the participating managers if the study is to achieve its ultimate objective—creating a new language for communicating the alignment of strategic objectives with operational actions. In developing a VCMS, the input of managers and individuals across the organization is needed. It is only logical that after the analysis is done these same individuals are given the results to help them refocus their group’s efforts.
The VCMS, then, is an externally driven but internally sourced basis for strategic analysis and direction-giving. As we saw with GTI, the value multipliers can be very different between segments, suggesting that a firm has to be aware of how its actions are interpreted across the various customer segments rather than relying on a generic strategy for all customers. Having walked through the basic characteristics of the VCMS and how it can be used in organizations, attention is now going to turn to specific uses of the data reports that are created. The VCMS provides a basis for incremental analysis, strategic analysis, and operational analysis that can be used in a common framework to improve organizational performance. The result is one language, one set of meanings that can be used to focus attention on a myriad number of problems and situations. That is the beauty of the VCMS—elegant information, consistently delivered for use across the organization.
Some succeed because they are destined to; most succeed because they are determined to.
Anatole France2