
Knowledge is the only instrument of production that is not subject to diminishing returns.
John Maurice Clark1
What makes the value-based cost management system (VCMS) different from traditional accounting models is that it allows for the fact that value grows within an organization. Traditional accounting only supports linear transformations in the accounting equation—add, subtract, multiply, and divide. There is no room for value creation in this equation, not unless it adheres to very strict mathematical rules of development. In developing a VCMS, the focus turns to those actions a company performs that create profitable growth. In addition, a VCMS is strategic in nature—current information is used to create a focus on those activities and outcomes that help grow the top line of the business.
In this chapter we focus on the multiplicative relationship between the revenues earned by customer value-added efforts and the resources consumed in the company to deliver this level of value-add—the revenue multiplier. The resulting value-add revenue to value-add costs ratio reflects the fact that a high growth curve can be created by investing resources in activities that customers value. The goal is to better understand the dynamics of the VCMS that separates it from traditional accounting. It is a marketing view on the accounts of the company, one that allows for the growth of value creation through careful investments in the areas customers value.
Comparing Revenues to Value-Add
One of the first things the VCMS does is to capture data on the value-added components of a company’s value profile. Based on customer data, the VCMS starts where product development and marketing start—by understanding exactly what a customer wants and expects from the products and services a firm provides. VCMS then uses the fact that revenues represent the sum total of the firm’s value proposition to create a usable accounting structure for the firm. Revenues are the key linchpin that makes the VCMS work.
What is the essence of comparing revenues to value-add? It is transforming the desires of customers away from vague references to concepts such as “prefer” and “prefer highly,” to concrete trade-offs, which are, in reality, at the heart of consumer behavior. Two steps need to be taken, then, to make marketing data-friendly from the accounting perspective. First, the list of value attributes needs to be generated for a product. Depending on the type of the market the firm operates in, this list may consist anywhere from just a few to many attributes that capture the value proposition the customer really considers when making a purchase.
The customer value attribute weightings for a small farm implement manufacturer in Italy provide a good example of the weights making up a set of value attributes (see Figure 5.1). We see here that technical reliability and performance are critical components of customer value (35%). Price as a proxy measure for standard functionality and life cycle costs comes in a close second, noting the fact that there is a 34% commodity component to the value structure of the firm. Getting immediate help to customers who experience a breakdown during planting or harvest accounts for the remaining 31% of the total value delivered by Frangor’s products.
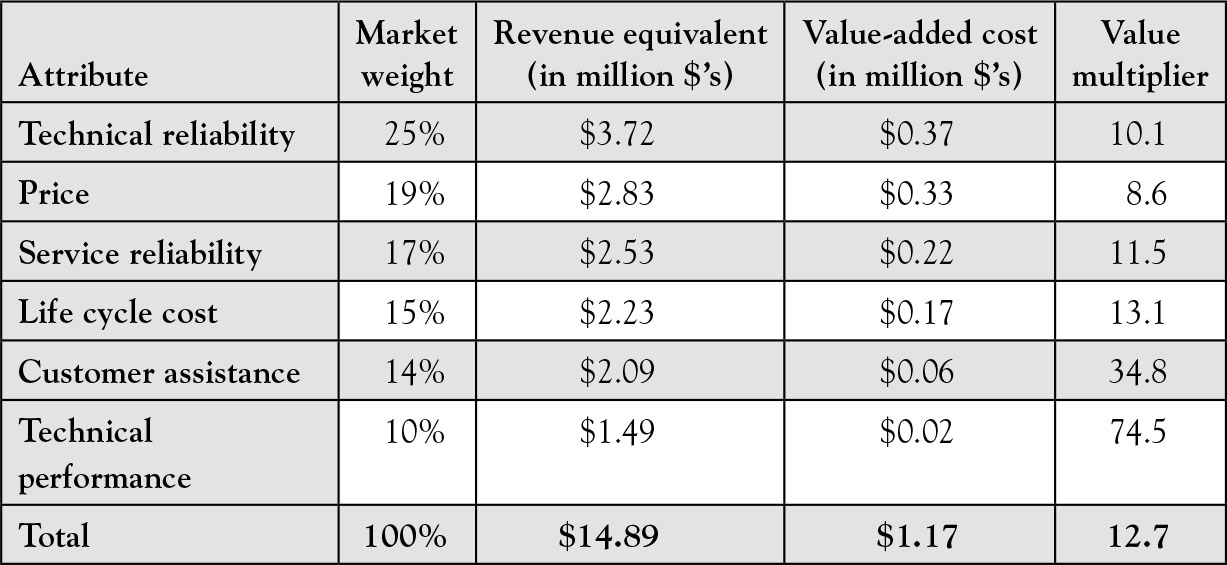
Figure 5.1. Frangor manufacturing.
The value multipliers for this firm are high. At the time of this project, the customer satisfaction data indicated that customers were satisfied with the technical reliability of the product, but customer satisfaction was low on other value attribute dimensions. For example, customers had to wait to get repairs made, causing significant problems for the farmer during critical growing seasons. Providing timely customer service is a critical dimension of customer value in this market. For example, it is so important that Caterpillar, Inc. focuses on timely customer service as the key aspect of its customer service, using a worldwide distribution network that guarantees a customer will be back up and running within 24 hours of the initial call.2
Once the customer data are collected and value attributes and their importance in the customer value profile are established and examined to make sure they add up to 100%, the linkage to revenue can be created. The percentage of total value is translated to the percentage of total revenue earned by the product. Looking at the revenue equivalent line we see the weighted average of the value attribute in general is multiplied by the total revenue that product is predicted to generate. These revenue equivalents provide critical data for the VCMS calculations.
Revenue equivalents are the vital linkage between the accounting and marketing functions in the firm. By providing a baseline number that can be used to analyze the marketing data from a financial perspective, the revenue equivalent provides a common language that everyone can understand and apply to making effective decisions that reflect customer preferences. This is one of the two critical innovations in the VCMS model.
The Role of Value Multipliers
Once the revenue equivalents have been developed, attention turns to the cost data. Using the methods described in earlier chapters, managers are asked to define activities performed by their business unit. Added to the traditional activity analysis that underlies all activity-based approaches to cost management are several key steps:
1. The activity is assessed to determine its percentage of value-add, BVAI, BVAF, BVAA, and waste or nonvalue-add.
2. The budget for the department is then “blown out” across the activities by percentage of value-add, business value-add, and waste.
3. For those activities that are determined to have some percentage of value-add, the manager is asked to assign this dollar amount of value-added activities across the value attributes defined by the customer.
4. Once this percentage assignment has been completed for attributes, the dollars of value-add are weighted by the attribute percentage to get the dollars of value-add by attribute.
As we saw earlier, by ensuring that 100% of an activity goes to value-add, business value-add, or waste, we can take the dollars assigned to the activity and divide them across these categories. Once we have a dollar amount assigned to the value-added activities, we then assign 100% of this amount to one or more of the attributes. This provides us with a value-added cost per attribute by activity. The first step in doing this is to break out the value-add activities (only) on the attributes as can be seen in Figure 5.2 taken from Windows, Inc.
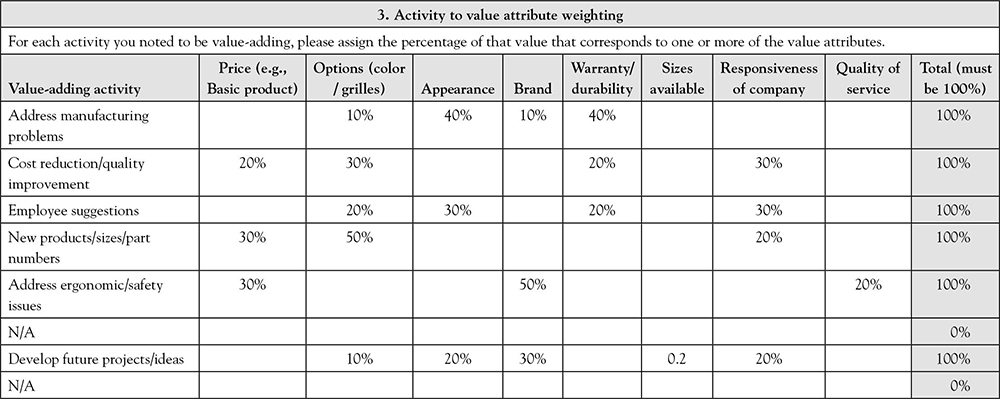
Figure 5.2. Value attribute weightings.
Now that we have the percentage of the value-add activity broken down by attribute, we transform these weightings into dollars. The entire budget has already been subdivided by value-add, business value-add, and waste. What we do now is take only the value-added dollars and apply the weightings in Figure 5.2 to get the value-added dollars by attribute. The results of this analysis are shown in Figure 5.3 in two parts illustrating both the mapping to the value-added versus nonvalue-added categories as well as the mapping to the value attributes themselves.

Figure 5.3. Dollars per value attribute.
This process is completed for every manager or targeted individual within the company. The total for each of the value attributes would then be developed, providing the total dollars per value attribute.
Creating the Value Multipliers
Having collected the revenue equivalent and cost data by value attribute, now the multipliers can be calculated. Basically, when we develop a value multiplier we take the revenue equivalents for a specific value attribute and divide them by the value-added costs that have been assigned to each attribute. For instance, let’s say that the total dollars assigned to the basic product for a window by customers equals $350 million in revenue dollars. The basic costs for this attribute from the surveys collected are $125 million. What is the value multiplier?
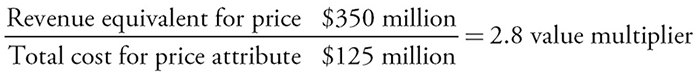
What does this mean? It says that for every $3.50 of revenue earned for selling a basic window, it costs $1.25 in value-adding costs to produce that window in its basic form. The $125 million investment in basic features, then, multiplies to create $350 million in revenue. This means that $0.357 of cost is incurred to earn $1 of revenue, or 35.7% of each revenue dollar earned due to price is used up in value-added costs. Since the price of the basic product reflects the firm’s competitive market structure, one would expect a relatively low value multiplier. Why? It occurs because the market is constantly driving down the price earned on commodity products. Now that we know how to create a value multiplier, how do we interpret them? Let’s turn to a discussion of high versus low multipliers.
High, Low, and In-between Metrics
What we saw with Frangor is that there can be very high multipliers and very poor overall performance for the firm. For convenience purposes, we will deal with high, low, and intermediate revenue/value multipliers, but they actually exist on a continuum from very small to very large. That being said, interpreting the revenue/value multipliers requires integrating value multiplier data with customer satisfaction data and other metrics measuring performance of the firm. This is especially true for high multipliers.
Low revenue/value multipliers (between 0 and 5) are more straightforward to understand. When a firm spends too many resources providing specific components of the value profile relative to customer willingness to pay, its multipliers end up being low. The more commoditized the market, the lower the overall multipliers for a product or service will be, signaling the profit pressure inherent in a cost-based strategy. Low multipliers suggest that even though the value attribute may be important, the firm is spending too much of its revenue meeting the specific category of value.
Using Impact Communications, we now can apply the 20% value-added rule to transform the data that was originally collected into one that reflects the total VCMS approach. This is being done to illustrate how different value multipliers can be found within customer segments even when the firm has a healthy value multiplier of five (see Figure 5.4). Again, this is for illustration purposes only. It is likely the true results at Impact would have been different, especially given the poor performance of the firm at the time of the study.3
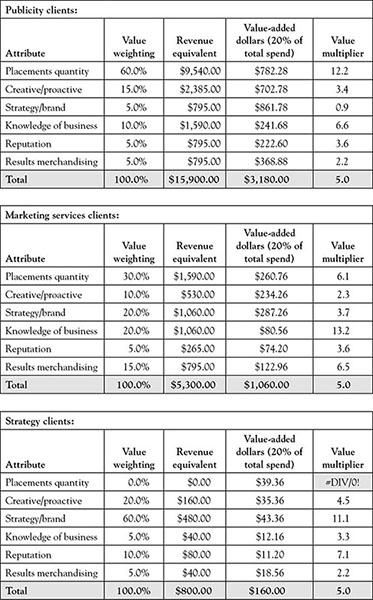
Figure 5.4. Impact communications value multipliers.
In the Impact Communications case we identified three sets of market segments: Publicity, Marketing Service, and Strategy clients. Let’s first look at the Publicity clients. In this segment, all of the value multipliers are less than 5 except for the placements quantity. Here we know, though, that the high multiplier signals a problem, because this category of client only wanted the placements activity—other attributes were not valued highly. So, the high multiplier for placements quantity combined with the satisfaction data signals to us that this might be a competitive weakness for Impact Communications.
When we look at the Marketing Services clients, we see three multipliers higher than 5—placements quantity, knowledge of the business, and results merchandising. Since these clients were happy with Impact across the board, these are competitive strengths in this segment. Impact may need to shift some of its spending on value-add activities to more closely align with the revenue equivalents, which define where value is created, but in general they are doing well with the client.
In the Strategy client segment, data indicates that these clients do not want any placements activity to take place—they have come to the firm for strategy advice. This means every dollar spent on placements is waste within this segment. Since no value is assigned, the multiplier can’t even be calculated. They are happy with the research done, as well as the creativity brought to bear on their problems, accounting for the high multipliers. That being said, we see more effort could be directed toward improving results merchandising as well as knowledge of the business.
Three different segments with very different expectations and results are represented in this example. As can be found in any company that serves different customer segments, a generic approach to serving these very different groups can be deadly. Since the data was forced a bit in this example, we can’t take the results much further than to note that the average value-added for all the segments can be the same while the actual details of how well a specific segment’s needs are being met can be quite different. It is important to calculate the value multipliers by segment to get a true feel for how well the firm is doing. If a segment is performing poorly, the VCMS analysis will help diagnose the underlying causes, providing guidance on how best to redirect resources to meet the segment’s unique requirements.
The Strategic Implications of Revenue/Value Multipliers
Revenue/value multipliers serve as strategic signals of where a company is doing a good job meeting customer value requirements and where there might be weaknesses in the product/service bundle provided to customers. The strategic nature of the value multipliers is what makes them so important for a firm looking to improve its long-term performance. Since customer value requirements change over time as does the degree of competition, it is important for firms to collect and track customer value data on an ongoing basis to ensure that spending and activity within the firm change as preferences or competition changes. The check on the alignment of internal spending with external demands is critical for keeping a firm one step ahead of the competition.
The information on strong value multipliers combined with good metrics on customer satisfaction data provides a signal to marketing that it should emphasize this value attribute when acquiring new customers. If a firm is successful at delivering on a specific value attribute that it is getting high multiples of payback for its effort, it is clear it is a strategic advantage for the firm. On the other hand, if the multiplier is high but satisfaction is low, this might be a valuable signal that the firm has to redirect resources to better serving the customer.
The value of the VCMS, then, lies in its ability to transform the static, historical cost data normally provided in a firm into an action-oriented, strategically focused information source that links together the internal efforts of the firm to create value with the market’s actual assessment of the success of these efforts. When facing a question of where to focus the next dollar of spending to meet customer needs, the value multipliers can provide vital information to make this decision. Putting the money where customers are underserved is a way to increase the competitive strength of the organization, helping to focus its resources on those activities and outcomes that will grow the top line of the business.
If a firm is pursuing a low-cost strategy, it may find out through the VCMS analysis that it actually has differentiated itself in some aspect of customer value creation that could be used to improve the firm’s competitive position in the market. Since managers often have an imperfect or obsolete understanding of customer value, having a tool that helps identify strengths and weaknesses of their products and services from an external perspective is crucial for long-term success. Simple in concept but strong in information, value multipliers are the basis for gaining and maintaining a competitive advantage in the global marketplace.
Summary
In this chapter attention has focused on the concept of a revenue/value multiplier. Derived by comparing the revenue equivalent dollars to the value-added dollars required to deliver that level of value, multipliers provide strategic signals of where a firm is doing well and where it faces competitive risks. Starting with a description of how the value-added dollars are derived, the chapter emphasized the fact that multipliers vary by customer segment—one size does not fit all.
To simplify the discussion we’ve treated revenue/value multipliers as if they fall into one of three categories—low-, mid-, or high-range—even though in reality the multipliers exist on a continuum.4 Mid-range multipliers, which reflect a roughly five-to-one relationship between value-added dollars and revenue equivalents, are on average the norm for a profitable company. Considering the individual attributes, the mid-range multipliers can be perceived to be “about right” in terms of the effort-to-reward relationship for the firm. Low multipliers mean that the firm is overspending to deliver on a specific attribute. The more commodity in nature an attribute or product is, the lower its multiplier is going to be. This is an unavoidable fact of the competitive marketplace. When multipliers are low, a firm should be looking to ways to differentiate itself in the market place. Since profit improvements are closely linked to top-line performance, pursuing a growth strategy is essential to long-run survival of the firm.
High multipliers present a quandary for the VCMS, one that can only be resolved by integrating VCMS analysis with the customer satisfaction data. If a value multiplier is high and customers are very satisfied with the firm’s performance, it signals a competitive advantage for the firm. If the multiplier is high, though, and satisfaction is low, then the firm has a competitive weakness that could lead to long-term challenges in the market. In this regard, then, the VCMS has to not only link marketing and accounting data but also employ other metrics used to measure and assess the external success of the firm.
In order to maintain credibility with the customer, the people from the customer-centric global services business…must be on the side of the customer in the buyer–seller transaction.5