
Value Creation and Process Management
To be what we are, and to become what we are capable of becoming, is the only end of life.
Spinoza1
In this chapter, we turn to the linkage of the value-based cost management system (VCMS) to process management, one of the major innovations being used by organizations to eliminate waste and improve responsiveness to customer requests. Using an example from the U.S. Coast Guard Academy, we trace how the VCMS data collection instrument can also be used to capture process information. We’ve already seen this data represented in the Easy Air data collection instrument, but now we’ll spend some more time trying to understand how this data is both classified as well as how the process framework can be implemented. We’ll begin with what is likely a review of process management itself and then move on to the application of the VCMS in a process framework.
The Basic Concept of Process Management
Process management is concerned with managing the horizontal flow of activities and products, emphasizing the handing off of a task or piece of paper, or project between individuals and departments.2 The goal is to streamline this horizontal workflow, removing all forms of waste that may occur, such as rework and fumbles that occur in the white space between individuals or departments in the flow. A process, then, is the flow of activities in which people work and departments organize. That means that most processes are cross-functional in nature, knitting together the organization into a smooth flow of activities and outputs that serve the needs of the company’s customers.
When companies begin to take a process perspective to their organization’s workflows, attention automatically turns to identifying waste and inefficiencies in the existing processes. Disconnects in the workflow (i.e., nonvalue-added steps, redundancies, bottlenecks, and unnecessary documentation and activities) create breaks in the smooth processing of documents or products. There can also be executional disconnects, including lack of skills, inadequate computer systems, impractical policies, internal politics, incentive conflicts, and an unsupportive culture. Executional disconnects have a simple result—the company may not be the best at performing the work encapsulated by the process.
Identifying the “should” state for a process requires significant effort. Narrowing down the activities and supporting documentation to just the steps required to complete the work can leave some employees feeling that their job might be eliminated. Since the ratio of time required to complete a process as it should flow versus how it currently flows is one to five3 (or 20% of the time is all that should be spent), there are job implications in a process redesign. If 80% of the work being done is unnecessary, it means that some people’s entire workday is spent doing things to correct errors and fill process gaps. This fact makes process improvement projects very challenging but essential if a company is to gain or regain competitive excellence.
As can be seen in Figure 8.1, there are a variety of decisions that have to be made in a process workflow. Each of these decision points can cause delay in the processing of the order. This is not a perfect process workflow, but an example of one that has been documented in a company. A simple process, one where orders are filled from a warehouse, requires that the order itself be handled, going all the way to the end when payment is received from the customer. The “D”-shaped figures all represent delays in the flow that extend the time required to meet customer requests. One of the worst of these is in the initial part of the flow, when orders are batched up for weekly processing. In a well-designed flow, orders would be handled as soon as they are received.

Figure 8.1. Example of a process workflow.
One can easily imagine that there are other delays due to batching or insufficient workforce. If the orders didn’t originate as a batch, it is likely that the credit “sidebar” could take place almost immediately upon entry of the order. If there are credit problems, though, it is logical that these would delay shipment to some extent, but not the batching-based delay that occurs in this example.
In developing an “is” or current state of a process, such as in this example, the goal is to be as realistic as possible. Improvements are usually easy to spot, such as removing the delays that occur in the flow. Some side activities are unavoidable, but they should be streamlined so that the customer knows what the problem is and can quickly address it so that the order can be filled. Once all of the delays and unnecessary decision points have been removed, a “should” or ideal state diagram can be generated. Bridging the gap between the “is” and “should” process flows is the focus of improvement projects.
For instance, the process could be made electronic through the use of a website ordering system. Order entry would be automatic, with order numbers assigned by the underlying software. All of the steps involved in the credit check could be handled with a verification service, which provides almost instantaneous feedback to the customer, who can then propose a different payment approach. The order could then be picked and shipped the same day, using the shipping mode requested by the customer. Payment is automatic in this system also, so all of the waiting in that process can also be eliminated.
If the company can’t convert to being completely electronic, it can at least use order entry software and credit verification software to trim time from the process flow. For example, using PayPal or credit cards can eliminate the payment delay, perhaps even generating a cost savings that can be passed on to the customer to encourage this change in behavior. All of these options have to be made available in the “should” design phase of the process. In the end, then, process management entails examining and improving the flow of work in the organization.
VCMS and Developing a Process Framework
The VCMS approach was originally designed to interface with process management approaches. By including a process code in the data attributes captured by the survey, process management implementation is supported. The process starts, though, with the development of a process framework. The standard for this type of framework is the one developed by the APQC International Benchmarking Clearinghouse.4 This framework consists of 13 major processes, seven of which are used to provide direct service to customers and the remaining six for internal support. What are the 13 processes within this framework?
1. Understand markets and customers
2. Develop vision and strategy
3. Design products and services
4. Market and sell
5. Produce and deliver for manufacturing organizations
6. Produce and deliver for service organizations
7. Invoice and service customers
8. Develop and manage human resources
9. Manage information
10. Manage financial and physical resources
11. Execute environmental management program
12. Manage external relationships
13. Manage improvement and change
Included in the framework is second- and third-tier numbering systems that further break down each of the major processes into significant steps and activities. Serving as one of the most widely used process frameworks, the APQC Process Framework provides a way for companies to compare themselves to other firms using preset definitions and classifications of work.
In each application of the VCMS, the APQC Process Framework has been used as a starting point. Modifications have been made to make the framework fit the unique nature of an industry, such as airlines for Easy Air and education for the U.S. Coast Guard Academy (USCGA). Figure 8.2 lays out the modified framework that was developed for the USCGA. As can be seen, the direct touch processes were increased to 10 from the 7 in the APQC Framework. The support processes were also expanded and modified to fit the unique environment of an educational institution.
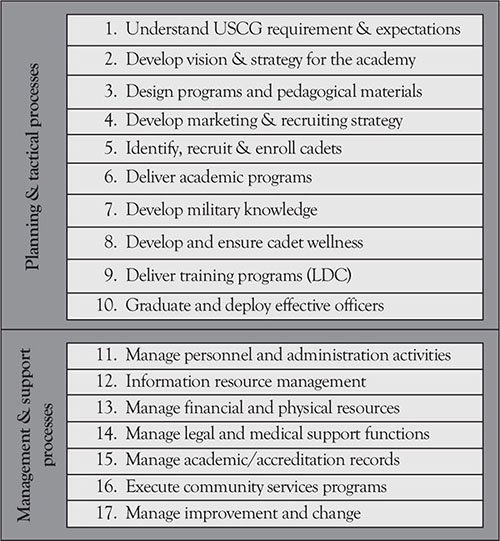
Figure 8.2. Process framework for the U.S. Coast Guard Academy.
The direct processes had two specific “outcome” stopping points. First, the school had to find and enroll cadets that would best fit the unique culture of the USCGA and the demands this environment placed on cadets. Second, the institution had to graduate and deploy effective officers. Both of these output processes have unique activities that are required to be completed. Some of these activities fell under other processes, but there were a long series of activities that were directly driven by both enrolling suitable cadets and graduating them to become U.S. Coast Guard (USCG) officers.
No attempt was made at the academy to take this numbering system any deeper than the major process level. Since this was a learning experience for the entire academy, it was deemed adequate to understand what the major processes consumed in terms of scarce academy resources. All of the activities that were traced to a major process could have been studied to develop a second tier of numerical coding, but since this exercise was just a small part of a much larger project, this work was not completed.
The APQC has developed frameworks for a variety of industries, as seen at www.apqc.org/process-classification-framework. The industry frameworks include aerospace, automotive, banking, education, and pharmaceuticals, just to name a few. In doing benchmarking, the process framework becomes invaluable as it ensures a company is comparing apples with apples when it queries the cost and effectiveness of other companies’ processes.
Tying Activities to Processes
The VCMS uses the process framework information to provide more targeted analysis of where the firm is creating value for its customers and where it is spending its support dollars. Since all of the support functions in the standard process framework are administrative in nature, if too many respondents to the in-house survey perform administrative activities there might be a problem. Since BVAA activities never generate revenue, but instead remove profit or scarce resources from the organization, it is important to keep tabs on how much it costs to run the organization. A good goal is to reduce these costs to between 15% and 20% of total revenue dollars. The goal is to shift excess administrative costs over to value-add or BVAF activities.
Since the goal is to tie the activities reported during the data collection phase to specific processes or process steps, the process framework, modified to fit the organization, needs to be developed before data collection begins. Our field work shows that it is usually best to have a small cross-functional team develop this framework, one that understands how to define the levels in the framework without getting into too much detail. The activities that are collected during the study provide the detailed information, while the framework is there to help classify activities by process. An example of the application of the process framework for the USCGA study is shown in Figure 8.3.
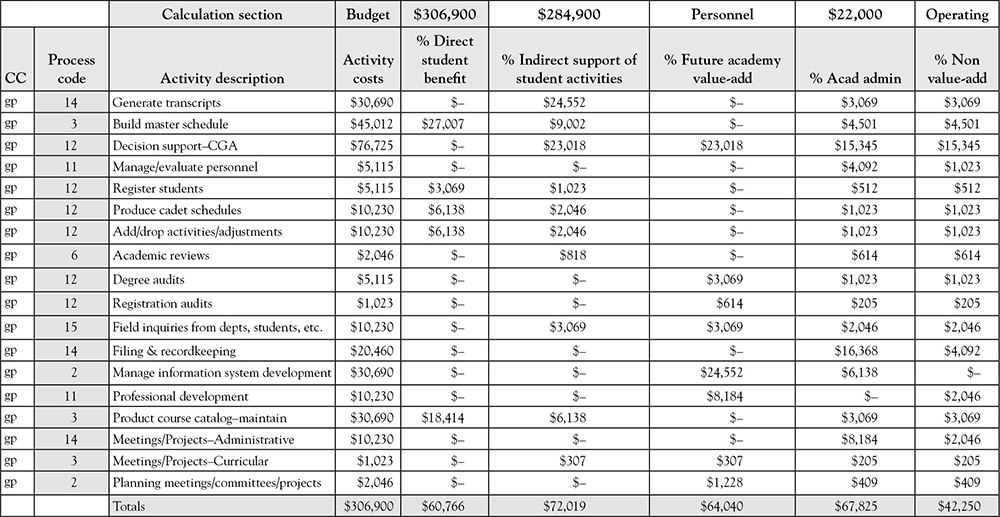
Figure 8.3. Process classification by activity.
Once the framework has been developed, an additional step is added to the data collection phase. Specifically, the respondent needs to help classify each of the activities identified against the process framework. We suggest that the team allocate approximately 45 minutes for the interview activity in a process-based VCMS study. The next question to be answered is the timing of the process data collection. Our field work indicates that it is best to complete the value-add and attribute data collection of the instrument first, and then add the process classification data to the top of the worksheet. This information will then automatically be filled into the other sections of the data collection instrument. Clearly, the more detailed the process framework is, the longer it can take during the interview process to gather the corresponding data.
Notice in Figure 8.3 that the data collection instrument has also been expanded to include the workgroup as part of the activity data tags. The reason for this is simple. When the data is summarized by process step, it’s important to know where the activity takes place. This makes the development of a process team to implement process management easier because the affected parts of the organization are already identified. It is sometimes quite surprising to see what parts of an organization are involved in making a process function.
Summarizing the Data by Process
Once the data has been collected, it has to be summarized by process step. If the data is in a relational database, a simple report is created. If, on the other hand, the data is entered into a program such as Excel, the data showing the financials (the last part of the data collection instrument) has to be copied into a master data sheet. This master data sheet can then be sorted by process code. In either case, a summary report that looks something like Figure 8.4 can then be generated.
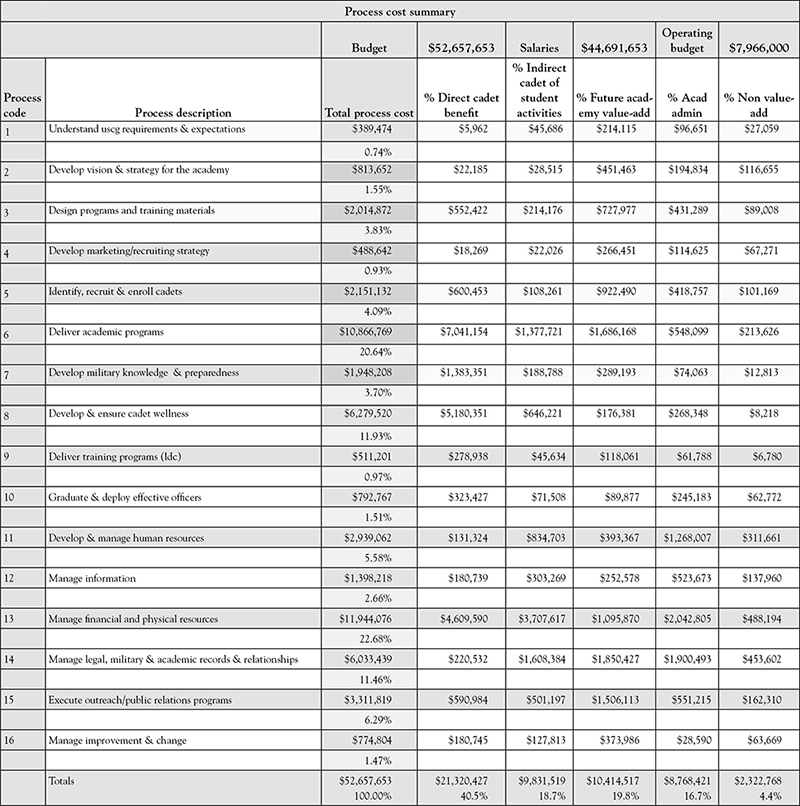
Figure 8.4. Process summary report.
Looking at this example of a process report, we notice that significant funds are used to manage financial and physical resources. The USCGA has a large physical plant, which accounts for some of this challenge. It also has to comply with federal budgeting requirements, which is a time-consuming job that affects every department at the academy. Academic records also consume significant amounts of time and resources, a problem that all academic institutions face. The academy was reviewing different types of software to improve this process at the time of the study. A more efficient and effective software program was identified and implemented, cutting back the time required to maintain academic records. In total, though, at the time of this study it took 50.14% of the academy’s resources to manage the educational and institutional processes. This result led to the drive to trim support services and redirect the funds into teaching.
What is interesting when the process approach is added to the data collection is that a process analysis can take place using the information gathered. Specifically, all of the activities that are coded to specific processes or process steps can be separated into reports that lay out all the activities performed for that process (see Figure 8.5). This data can then be directly used to analyze the process to identify gaps and redundancies in the process flow. As noted above, the data also makes it easier to identify and include all the individuals affected by a process flow in any ensuing study, ensuring that all current stakeholders are included in the process redesign effort.
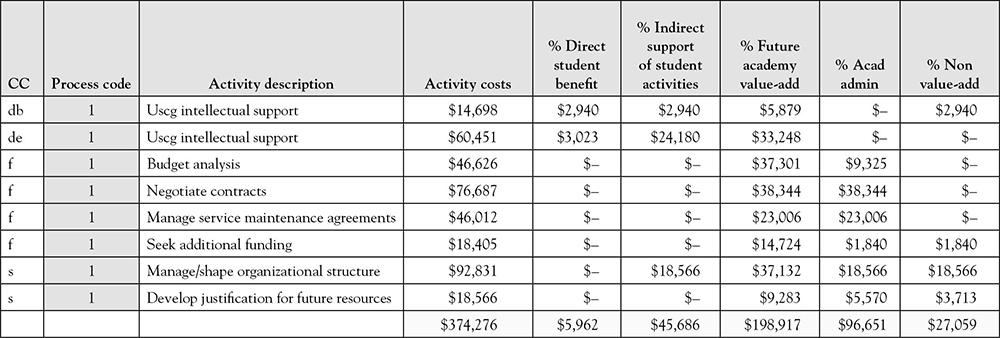
Figure 8.5. Process classification detail.
When the process is the focus of the analysis, the summary sheets need to include all of the activities, sorted by process code. It is usually best to put together one report per process so that the data can be analyzed. Once again, this report can easily be generated if a relational database has been created. It can be more time-consuming if a program such as Excel is used. The more complex the organization, the more important it is to use relational structures to make the data usable for process analysis and follow-up activities.
Using VCMS Data to Support Process Improvement
As has been noted above, the VCMS can directly support process improvement projects by presenting the data with process codes and affected workgroups attached. This provides the input to the process improvement team. There is more data that can be made available to the improvement team, though. Specifically, the VCMS data also includes the amount of value-add, business value-add, and waste that was identified by participants in the study.
While the waste factor is normally understated in the initial data collection, it at least provides a starting point for setting targets for the improvement team. Since process improvement targets waste and BVAA tasks that make processes more costly than they need to be, it is useful to have this information available so the improvement team can prioritize the processes they are going to try to improve. Usually one or two processes really stand out, as did the “manage physical and financial resources” process at the USCGA. Clearly, this is the most costly area for the academy, and one that only indirectly affects a portion of the quality of education—maintaining and improving the classrooms. The money spent to comply with federal regulations does not benefit the students at all—it is truly wasted resources when the student perspective is taken.
Summary
This chapter has emphasized the linkage of the VCMS to the process management initiative in an organization. Building from the process framework, such as the one suggested by the APQC Process Framework, the VCMS can collect process data while undertaking the data collection effort. It is important to have the framework complete before VCMS data collection begins. The resulting information should include the workgroup for each activity so that downstream sorting can be completed effectively.
So how can VCMS data support process improvement efforts? The various ways that this can happen include the following:
• Prioritizing process improvement efforts.
• Identifying those work groups or departments that participate in a process.
• Setting improvement targets based on the amount of BVAA and waste reported.
• Identifying gaps and redundancies in the process flows.
• Gaining an understanding of how much the organization is spending to simply maintain its own internal records.
• Identifying areas where automation and new software may be needed.
• Providing a basic process structure to support improvement efforts.
• Tying process steps to the value attributes that customers care about.
• Separating total costs of a process into value-add, business value-add, and waste.
The VCMS is a constructive way to provide financial support to the process improvement effort. These are complementary efforts, both being focused on maximizing the amount of value created for customers with an organization’s limited resources. When used together, the information for both systems tends to improve over time as people become more comfortable with exactly how the data is going to be used. Putting value attributes into the process improvement effort ensures that a more precise picture of how and where customer value is created results.
Everything is connected…no one thing can change by itself.
Paul Hawken5