
Turning Data into Business Intelligence
“If you can’t explain it simply, you don’t understand it well enough.”
—ALBERT EINSTEIN
People are either the largest or the second largest expense of an organization. This is increasingly true as technology has shifted work from muscle to brain. Individual understanding and discretionary decision making depend on accurate, timely, and predictive information. Human capital analysis and predictive measurement can provide this information and are, therefore, critical for business success in this global marketplace.
There are many reasons for human capital analysis and measurement to be so important today:
1.If you don’t measure it, you don’t know what is actually happening. Anecdotal reports and personal observations are full of errors and lead to misinterpretation.
2.If you don’t understand it, you can’t control it. How can you control a situation that has been viewed subjectively, vaguely, and inconsistently?
3.If you can’t control it, you can’t improve it. Management is about dealing with and promoting positive change. This demands standardized benchmarks.
Your business decisions should be based on empirical data. Analytics promotes accuracy, consistency, and a broader view of the effects of HR services. Analytics are bias free and credible. The numbers require little translation; they speak for themselves.
Just What Are Metrics?
The term metrics evolved from the work we started in the 1970s. It wasn’t called metrics then—just “measurement.” Over time, the term metrics started to be used, and by the late 1980s, many people claimed that they were doing metrics, albeit at the most basic level. By now, the term has been loosely applied to any application of numbers. So, just what are metrics?
Metrics are numbers that indicate how well a unit or an organization is performing in a specific function. The numbers provide a context around which performance can be analyzed more precisely than through anecdotal commentaries. Metrics can be expressed as percentages, ratios, complex formulas, or incremental differences. They can be individual or aggregated, and can be tracked over time to show trends.
Performance objectives should always have some quantitative aspect to them to promote a common basis for judgment. Qualitative data such as employee or customer satisfaction levels or quality judgments can be used to augment cost, time, and quantity numbers. Lastly, each metric or set of metrics should have an owner—that is, someone who is accountable for the quality, timeliness, and relevance of the data. Running numbers for the sake of having data in case anyone asks is a paranoiac waste of time. Metrics that are not used quickly become a burden on those who have to collect and publish them. In short, data for their own sake are an expense and efforts to collect them should be minimized. Data that can be turned into intelligence for decision making, however, can be valuable.
There is no shortage of data in corporate management systems. The numbers can be drawn from two sources: internal and external. Internal data sources are payroll, HR functions, employee surveys, ERP systems, production, financial statements, and marketing and sales data. External data sources are industry benchmarks, labor market trends, government databases and reports, competitor actions, survey research, and the Internet.
Avoiding Common Metrics Mistakes
Quantitative and qualitative data can generate value or create confusion and miscommunication. Simply collecting a mass of data not only has no value, it can lead to frustration and poor decisions. Some of the common mistakes made concerning metrics include:
1.Confusing Data with Information. We can bury ourselves in data, with the erroneous assumption that we know something. Uninterrupted data collection is a worthless, make-work, dust-gathering expense. The basic question is: What will you do with the data once you have it?
2.Valuing Inside Versus Outside Data. Basically, no one in the organization cares what is happening with the human resources function. All they want to know is what value HR is generating for the company. This is an extension of the activity versus impact mistake. Report on human capital, the employee activity, rather than on human resources, the department activity.
3.Generating Irrelevant Data. Presenting metrics on topics of no importance is useless. It simply clouds the issue, showing that you don’t know what you are supposed to be contributing. Metrics must answer relevant business questions rather than just be a data dump. More data are not necessarily useful data. Focus on collecting and reporting only important business data.
4.Measuring Activity Versus Impact. A common tendency is to report costs, time cycles, and quantities without describing their effects. I call them intermediate metrics. My basic test question is: What difference does it make? What is the result? If the data do not show some positive or negative effect, why report them?
5.Relying on Gross Numbers. Averages mask effects. If you reduce a large number of outcomes to an average, you have no profile of the phenomenon. What are the mean, the median, the mode, and the percentiles? Are all data points bunched around the middle, or are they spread across a wide range? Average cost and average turnover are meaningless.
6.Not Telling the Story. We can gather a mass of data and display it in colorful charts, graphs, and tables, but in the end, does it tell the story of what happened, why, when, where, how, and to whom? Data are not intelligence. Data are expense. Intelligence is value. Don’t report something if it does not tell a story.
7.Analysis Stagnation. What are you going to do with the data now that you have it? What are the implications of the data? How can you use it to spur action on the part of management or employee groups? Is the story compelling to someone who has a line responsibility? Does it guide the line person in solving problems or exploiting opportunities?
Second-Generation Metrics: Benchmarking
Benchmarking emerged from basic metrics in the mid-1980s, when we published the first national human resources financial report (HRFR) under the sponsorship of the Society for Human Resource Management. Benchmarks are comparisons between companies on various dimensions: industry, location, size, or growth rate. They help managers evaluate their work to some degree. The shortcoming of benchmarks is that the comparisons are sometimes invalid. During stable times, in small markets benchmarks can be useful. However, as markets have grown, fragmented, and globalized, benchmarks are often irrelevant. Even two small companies in the same area may be so different as to make most benchmarks misleading.
Benchmarks can yield views of broad trends across industries or regions, however. They can show that costs generally are moving up or down, time cycles are either growing or shrinking, labor availability is shifting in some way, or other basic factors of business are changing. Although they describe change, they do not reveal the reasons for the change unless you begin to apply analytic tools. In summary, benchmarks are better than focusing only on internal trends, but they must be used with caution. To obtain value from benchmarks, you need to know a lot about the companies used in the comparison. Just because they are in your industry, that does not make their numbers comparable. Let’s look at an example.
Assume you want to know how you compare on the amount of money invested in L&D. In order to draw intelligence from benchmark figures, you need to know many things, such as:
![]() What costs are included: centralized and/or decentralized expenses, self-directed and classroom, conferences, executive education, mentoring, and so on?
What costs are included: centralized and/or decentralized expenses, self-directed and classroom, conferences, executive education, mentoring, and so on?
![]() What percentage of the total workforce is contract, seasonal, or temporary?
What percentage of the total workforce is contract, seasonal, or temporary?
![]() How is the total expenditure allocated across sales, production, technology, management, and leadership programs?
How is the total expenditure allocated across sales, production, technology, management, and leadership programs?
![]() What are the organizations’ hiring and turnover rates?
What are the organizations’ hiring and turnover rates?
You can see how benchmarking is a complex matter, not to be entered into lightly. Misunderstanding or noncomparable data can cause more problems than they solve.
Third-Generation Metrics: Predictive Analytics That Yield Business Intelligence
To learn why some situation is changing, you need to move up from metrics and benchmarking to statistical analysis, which then ultimately leads to prediction and optimization. Figure 6.1 shows this progression from basic metric reporting through analytics to predictability and optimization.
Figure 6.1. Degrees of analysis and business intelligence.

Data or metrics alone do not help management make effective decisions. For that, you need to upgrade to analytics and eventually to business intelligence. This is where the value of HCM:21 comes through. Analytics requires building data warehouses by collecting information from ERPs and HR transactional systems, financial, sales, and production systems. Data integration emerges through querying and reporting, with its limitation being only that it tells what has happened in the past—it is a rearview mirror. But moving through analytics helps you understand outcomes and forecast opportunities. The more competitive and global business becomes, the more you need forecasting, predictability, and advanced modeling. Slowly, organizations are beginning to embrace the need for and see the value of these more sophisticated applications. But let’s first see what is entailed with analytics.
Understanding Predictive Analytics
Data terms as used in the general marketplace are often incorrect or misleading. It is worth the time to review just what the terms truly mean. Here are two:1
![]() Correlation. When two events move in the same direction concurrently, they are viewed as correlated. This does not mean that they are necessarily related. It certainly does not mean that one causes the other. In a famous example by Bontis, age and obesity are shown to be correlated with heart attacks. He states that “age is an antecedent to obesity which is the direct driver of heart attacks. The path from age and heart attack is not statistically significant even though it is correlated.”
Correlation. When two events move in the same direction concurrently, they are viewed as correlated. This does not mean that they are necessarily related. It certainly does not mean that one causes the other. In a famous example by Bontis, age and obesity are shown to be correlated with heart attacks. He states that “age is an antecedent to obesity which is the direct driver of heart attacks. The path from age and heart attack is not statistically significant even though it is correlated.”
![]() Causation. In a more complex example, diet, fitness, and genetic predisposition are added to the mix. All of these also correlate to the propensity for heart attacks. Studies show that the influence of genetics is significant, but nothing can be done about that. So, Bontis moves to the next most significant variable, which is fitness. Each time a new variable is added, the interrelationships of all variables becomes more evident.
Causation. In a more complex example, diet, fitness, and genetic predisposition are added to the mix. All of these also correlate to the propensity for heart attacks. Studies show that the influence of genetics is significant, but nothing can be done about that. So, Bontis moves to the next most significant variable, which is fitness. Each time a new variable is added, the interrelationships of all variables becomes more evident.
Now, apply that to a human resources service such as staffing, as was discussed in Chapter Four. There are multiple inputs to that process, including many applicant sources, various selection methods, the use of onboarding or not—all of which might be causally related to various outcomes. How do you know which variables have an effect on the outcomes? To make the problem more complex—which it is—the outcomes go beyond simply the immediate quality of the hire. They can also include ratings of potential, length of service with the organization, performance, flexibility, salary progression, and so forth. Causal modeling that we call process optimization reveals in any given situation which are the driving or causal factors. In addition, it shows which combinations of variables make for the most effective outcome. The small example of process optimization was seen in Chapter Five, Figure 5.2.
The Need for Integrative Measurement
Step back and think about human resources services, and ask yourself how they affect your oganization’s operations and strategic key performance indicators. How does it matter if you can hire the best talent on the market, when you need them, pay them at market levels, build their skills to suit your needs, and then retain that talent? Can you see the difference this makes in any function in your organization? Would it be useful to truly know what is likely to happen when you make investment decisions? Everyone would say yes. So, why aren’t you applying the best process logic and analytic technology to fulfill this critical requirement?
Failure to have top talent in place impairs operational outcomes. Shortfalls in production, sales, accounting, and information technology naturally impede accomplishment of strategic KPIs. The logic is unassailable. The reason we have not come to this realization and built an integrated measurement system with a future focus is twofold:
1.We are siloed. How often do we hold meaningful conversations at the operating level among sales, finance, operations, IT, and human resources? My experience is that at the C-level, there is often a lot of finger-pointing when it comes to discussing failure to fulfill a KPI. At the operating level, the conversation rarely exists. Ask yourself: When was the last time I really talked across mid-level groups about how they were affecting each other’s operations and how they could do it better? And then set up some metrics to monitor progress toward improved operations?
2.We are obsessed with the past. Almost all our data look backward. They report what happened yesterday. There are few, if any, data systems that have the capability to predict the future. Those that do, such as employee surveys, engagement scores, and readiness tables, are viewed as reports of past or current status. Their implications for future success are not recognized or vigorously pursued. And what is more important and useful—reporting on the past or predicting what is likely to happen in the future? HCM:21 leads us to understand not only today but also what we can do to optimize for tomorrow.
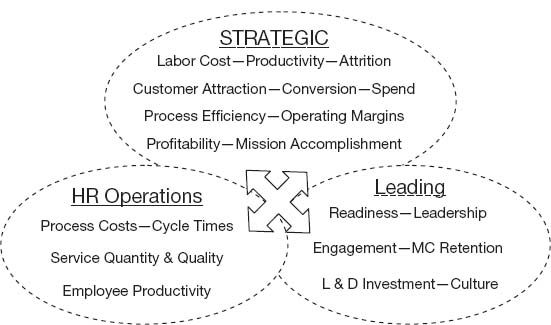
Figure 6.2 shows the links among strategic, operational, and leading indicators.
Connecting the Three Levels of Metrics
The following are some common metrics for each of the three levels. Do you see connections where one variable might affect another at the same or different level?
Strategic Level
Revenue per FTE
Total labor cost (payroll, contingent and contract worker pay, benefits excluding consultants) as percentage of revenue
Total labor cost as a percentage of operating expense
Benefits to revenue expense percentage (total benefits cost as a percentage of revenue)
Benefits to operating expense percentage (total benefits cost as a percentage of operating cost)
Figure 6.2. Three-point integrated measurement system.

Mission-critical turnover rates: manager and professional (can be broken out, voluntary and involuntary)
Diversity representation at executive, manager, exempt, and nonexempt levels (percentage of executives, managers, exempt, and nonexempt employees by diversity group)
Diversity turnover at executive, manager, exempt, and nonexempt levels (turnover among diverse groups by executive, manager, exempt, and nonexempt levels)
HR Operations
HR operating expense percentage (HR expense as a percentage of operating expense)
Human resources expense per employee
HR employee ratio (HR headcount divided by total headcount)
Total training and development investment
Training and development cost as percentage of payroll
Time to fill nonexempt positions
Time to fill exempt positions
New hire quality (performance rating by supervisor ninety days after hire)
Any other HR process metrics
Leading Indicators
Leadership survey score
Engagement survey score
Readiness rate (percentage of mission-critical positions with at least one Hi-Po person ready to step in) (executive, managerial, key professional)
Learning and development investment per employee Learning and development investment as a percentage of payroll or revenue
Commitment level (percentage of employees reporting intent to stay at least three years via survey)
General turnover rate (exempt and nonexempt; can be broken out, voluntary and involuntary)
Great place to work (percentage of employees rating company as good or great place to work)
Do you see how changes in the leading indicators might affect the operational or strategic level? Figure 6.3 adds examples of variables in the three levels, with arrows indicating that analytics, and eventually algorithms, can point to the relationships among the variables.
Figure 6.3. Connections between variables.
Business Intelligence: The Ultimate Goal
When data are aggregated from various sources, they begin to take on meaning beyond just the raw numbers. And this is where business intelligence (BI) begins. BI allows organizations to collect, organize, integrate, and deliver reports that uncover hidden connections in the data. Predictive analytics reveal the return on HR services and investments in programs for human capital improvement. It not only predicts the likely outcome but also checks the validity of the results. It is where metrics, benchmarking, and analytics take us.
Human capital management today is fundamentally about risk. Evaluating risk requires a view over the horizon. Just as insurers and banks need to look at risk, so does the human capital manager. The effects of bad hires, incentives that don’t produce, and late delivery and ineffective development programs can have a deleterious effect on a business. Predictive analytics leading to business intelligence can help avoid such shortcomings.
BI built upon predictive analytics provides visibility and insight into organizational and market activity that supports human capital management decision making and resource allocation. BI supports management through various tools, including comparative analyses, event management, data integration, and displays such as dashboards and scorecards.
At the End of the Day
The only way to do something is to do it well. That means to finish the job. My wife says that men operate on the 80 percent rule when asked to perform a household task. For us men, good enough usually is good enough. But in business, good enough leaves you in the pack. And as some wag once pointed out, if you are not the lead dog on the sled team, you spend your time looking at some other dog’s rear end.
Although an organization is an open system, affected by external events as well as internal policies and practices, it is helpful to also focus on the interactions within. In this case, I mean the three arenas of strategic, operational, and leading. To omit any one of these is a serious mistake. In particular, to ignore that operational performance has an effect on future events (leading indicators) is obviously absurd, and no one would admit to it. Yet, it happens.
We make decisions today without regard to the future because of the pressures of the moment. Routinely we bastardize quarterly data to suit a financial report, praying that we will somehow make it up in the ensuing quarter. That is probably not going to stop as long as we must pander to the financial analysts who drive stock prices. Unquestionably, this system reeks, but it is our system and we have to live with it for the foreseeable future. So, where does all this leave you? It depends on whether you want to be the lead dog. If you don’t care about your market position, then do whatever suits you. On the other hand, if you aspire to lead, then you have to pay the price. America was based on the principle that a person can be anything he or she wants to be if he or she is willing to work for it. In the war for talent, if you want to be the market leader, you have to do what is necessary. My business experience, now in its fifth decade, has taught me to address all issues: strategic goals, daily operations, and future signs. And look at them within one integrated model.
Note
1.Nick Bontis, “What’s Measured Counts: Human Capital Management Using Causal Models,” Genera Insight, 2008.
HOW TO INTERPRET THE DATA
Data analysis does not always require complex statistical procedures. If the sample population is small enough you can usually see the point. Simple averaging also records a lot. Means, medians, and modes can tell you how a population is distributed. But, if you want to be predictive, you will need statistics. The following three essays are examples of how to apply metrics and analytics to make a difference.
PREDICTIVE ANALYTICS FOR HUMAN CAPITAL MANAGEMENT
Nico Peruzzi
Prediction: It’s the brass ring reached for by so many, yet grabbed by so few. What will happen next? How can I better plan for the future? These are questions often asked but rarely accurately answered. Data abound in the modern corporation, yet most of this potential information just sits on the shelf. That which is accessed is given only a cursory look, with people extracting very little of its potential value. In this essay, I discuss how the data can be better used—how it can be used for more of its worth. To achieve this goal, I describe using statistical methods for the purpose of predicting outcomes that will be helpful in the field of human capital management.
Understanding the Variables of Predictive Analytics
For the sake of those less familiar with statistics, let’s start with the basics. A company has loads of data, so how can you break it into manageable pieces? One of those ways is by viewing it in terms of variables.
Variables can be thought of as “fields” of data, or individual pieces of data; typically, they are the columns on a spreadsheet. All of those columns—age; gender; years of service; education; performance score A, B, or C; and so on—are the variables. Why call them variables? Because they are not constants—the data for each of these variables vary for each case (think of a case as a person). Breaking the mass of data down into variables is a first step in getting a handle on the information that likely sits before you.
Categorical Versus Continuous Variables and Levels of Variables
Variables come in different types. The simplest way to break them down is to determine whether they are categorical or continuous. As the name implies, categorical variables are made up of types, classes, or categories. Think about the variable “gender.” It has two categories—male and female. Continuous variables, on the other hand, are numbers or numerical. Anything you would report as a number is a continuous variable. Years of service could be one continuous variable; numeric age would be another.
Another word to keep in mind when talking about categorical variables is level. The concept of levels doesn’t make much sense for the variable gender, but something like performance might be measured in categories of “high,” “medium,” and “low” or “past,” “present,” and “future.” Each of these categories is considered a level of the variable called “performance” or “period.”
How Variables Relate to Each Other
Well, that’s the central question. If you can figure out how variables relate to each other, you can gain greater understanding of the way things in the system under examination work. There are two major ways to think about how variables relate to each other: interdependently and dependently.
Interdependence Techniques
These techniques are used to see how things relate to each other (or group together) when there is no direction to one’s hypothesis or assumption. I say “things” here because this class of techniques allows one to look either at the relationship among variables or at the relationship among cases. The two most common interdependence techniques that you will come across are factor analysis and cluster analysis.
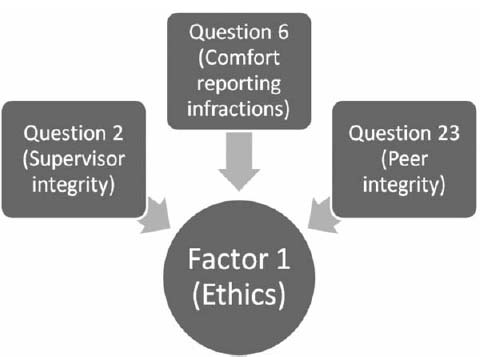
Factor analysis deals with variables and tries to answer this question: Are there groups of variables that hold together (i.e., are highly correlated with each other), such that they reveal an underlying theme? For example, say that there is a scale measuring the culture of a workplace. The scale is made up of twenty-five questions, and employees rate each question on a scale of 1 to 5 as to how much it applies to the workplace. Factor analysis allows you to see if certain types of questions hold together. For example, perhaps there are a few questions that highly correlate with each other, and all appear to have to do with company ethics. As opposed to declaring that there are subscales of the survey based solely on one’s content expertise, factor analysis helps you determine if the world really does stack up that way in this specific company. Figure 6.4 shows this relationship.
Beyond the benefit of revealing underlying themes in a series of questions, factor analysis also serves the important role of data reduction. As the term implies, you can take a large number of variables and reduce them to a more manageable and coherent set of factors (think: composite variables that capture the essence of all the variables that make them up). Less is often more in regard to data; you want to simplify and look for parsimony. Factor analysis has various statistical flavors. Most commonly, continuous data are used; however, there are techniques that deal with categorical data.
Cluster analysis works with cases instead of variables. Recall that cases are people—the rows in your database. Cluster analysis looks for groups of people that have similar data across a range of variables. The people in a group (called a cluster) have characteristics similar to each other, and they are different from the people in other clusters. We’re not just talking about cross-tabs here (such as “men look like this and women like that”). And we’re beyond multilevel cross-tabs, such as slicing by gender and department to look for differences. Cluster analysis is a multivariate technique that takes into account lots of variables at the same time to find those that best group like people and discriminate them from other groups.
Figure 6.4. How questions come together to make a factor.
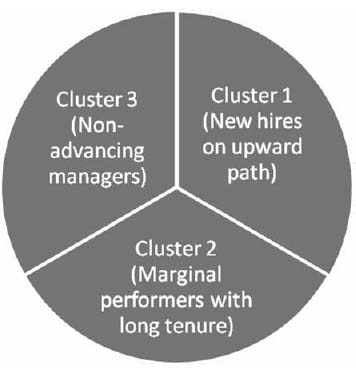
An example of cluster analysis is as follows: You have distributed a comprehensive performance survey and you want to understand whether there are certain types of people who have similar characteristics, as measured by all the items (variables) in your survey. Cluster analysis might reveal a variety of employee types, thus helping you better understand your employees. We give descriptive names to clusters that help us sum up the essence of the group. In this example, you might end up with “new hires who are on an upward path,” “marginal performers with long tenure,” and “nonadvancing managers.” Figure 6.5 shows the named clusters. Cluster analysis can work with either continuous or categorical variables. Again, the specific statistical technique will differ; however, either type is workable.
Dependence Techniques
Dependence techniques are used when you try to predict some outcome based on some number of predictors. To begin, consider the differences between predictors and outcomes. Remember that predictors and outcomes are just variables. When conceptualizing predictors and outcomes, it’s easiest to think directionally for a moment, as shown in the equation in Figure 6.6.
Predictors fall on the left side of the equation and outcomes on the right. One imagines that the combination of some number of predictors “leads to” the outcome. Perhaps, for example, years of service and job satisfaction relate to productivity. Note that, although you are imaging directionally, you need to remember that these techniques are based on correlations, and the old caveat still holds that “correlation does not equal causation.” You might talk about years of service and job satisfaction as leading to productivity, but you are simply saying that they are related.
Figure 6.6. How predictors conceptually lead to outcomes.

The most common dependence techniques you’ll run into are multiple regression and discriminate function analysis. Here is where the fun really starts.
The key aspect of multiple regression is that your outcome is a continuous variable (numeric). If, in the example, productivity was rated on a numeric scale from 1 to 10, you could use multiple regression to determine which predictors were most influential in increased productivity, as shown in Figure 6.7.
Discriminant function analysis, on the other hand, is used when the outcome variable is categorical. Imagine that productivity is simply rated high, medium, or low. You can still determine which predictors are most influential; however, your outcome scale is simply more crude than a numeric scale. See Figure 6.8.
DISCRIM, as it is known in stats circles, has a “cousin” technique called MANOVA (Multiple Analysis of Variance). MANOVA is sort of DISCRIM in reverse. Instead of thinking about which variables are the strongest predictors of a certain category, MANOVA asks: What are the differences between these groups? For example, you might want to know the main differences between people in two different departments. DISCRIM doesn’t make sense, as you are predicting which department people are in; instead you are asking about the differences between people in the departments.
Figure 6.7. The concept of multiple regression.

Figure 6.8. The concept of discriminant function analysis.

Decision Trees
A family of techniques that use visual branching diagrams, decision trees, show how certain predictor variables lead to a specified outcome variable (often called a target variable). Both categorical and continuous variables can be used as both predictors and outcome. Examples of techniques include Chi-square Automatic Interaction Detector (CHAID) and Classification and Regression Trees (CART). These techniques are conceptually similar to the dependence techniques mentioned; however, the statistical algorithms driving the outcome are unique.
To put this into practice, you might use CHAID to see which variables best predict that people fall into the highest category of employee performance. Imagine that performance has been broken down into “high,” “medium,” and “low.” CHAID could help you identify the categories from certain categorical variables and/or the number of certain continuous variables that are most predictive of someone’s ending up in the “high” category. This relationship is shown in Figure 6.9.
Figure 6.9. An example of a decision tree analysis.

Going from Ideas to Variables
I have described different types of variables and ways to determine how they are related. This information is important so that you can take one of the most important steps in the predictive analytics process: connecting your questions (hypotheses) to the variables.
The process of moving from a research question to a concrete plan for measuring and analyzing data is called operationalization (to make measurable). In this phase, you ask yourself how you have or would measure your concept. For example, suppose you want to study productivity. Great—but what does productivity mean? Do you have some data in hand that measures it? If so, you have a starting point. What does the data look like? Can you conceptualize (organize) it as variables? Are the variables continuous or categorical?
If you don’t have any data, you need to collect some. Perhaps you can run a survey. As you write your questions, keep in mind how the data will come in. For instance, take the survey yourself and put your data in a spreadsheet. What are your variables and are they categorical or continuous? If you know concretely what the variables look like, and you have a hypothesis as to how they might relate to each other, you are ready to collect that data and run some stats.
Caveats for Variables and Data
Here are some important precautions to keep in mind when you look at your variables and the data they contain. First, make sure your variables are relevant to your hypothesis. Don’t collect extra data to fill out an unclear objective. Keep the project simple, relevant, and focused.
Also, missing data can be a pain and potentially weakens your end product. Try your best to collect complete data from each case (person). Don’t have too many, rather than too few, levels in your categorical variables. If you are extremely specific, or granular, you might end up with very few people in a category. However, you can always “collapse” the category with another one later (e.g., take “junior manager” and “senior manager” and collapse them into “manager”). You cannot, however, “break apart” a previously identified variable (e.g., take “manager” and turn it into “junior manager” and “senior manager”).
Continuous variables provide more opportunity to find differences than do categorical variables. Statistics are driven by “variance” (variability in cases). Continuous variables provide a more granular rating and, therefore, more opportunity to spot differences. That being said, it is often impractical to collect continuous (numeric) data; the desire for continuous data needs to be balanced with practicalities of measurement.
The more data, the merrier—usually. Two caveats here. First, if you have to collect fresh data, there will likely be practical constraints in the amount of data you can collect. Second, having more data makes finding statistically significant differences easier, which is a double-edged sword. It’s nice to pick up fine differences; however, tiny differences that raise the statistically significant red flag may have no practical value.
Checklist for Using Predictive Analytics
![]() Start with your objective(s): What do you want to find out in a strategic sense? What is your hypothesis? Keep it as simple, specific, and actionable as possible. Many studies have been ruined by lack of specificity and practicality.
Start with your objective(s): What do you want to find out in a strategic sense? What is your hypothesis? Keep it as simple, specific, and actionable as possible. Many studies have been ruined by lack of specificity and practicality.
![]() Operationalize your hypothesis: How will you act on the information that you pull in? Translate the theoretical/strategic words into variables. Determine whether you have the data or need to get them. Are those variables you just operationalized available?
Operationalize your hypothesis: How will you act on the information that you pull in? Translate the theoretical/strategic words into variables. Determine whether you have the data or need to get them. Are those variables you just operationalized available?
![]() Understand your variables: Which are continuous and which are categorical? What are the levels of the categorical (classes) variables and the scales of the continuous variables?
Understand your variables: Which are continuous and which are categorical? What are the levels of the categorical (classes) variables and the scales of the continuous variables?
![]() Determine the technique that fits your hypothesis: Call in your local statistician for help. Explain your goal and let the statistician find the best way to obtain a valid and actionable result.
Determine the technique that fits your hypothesis: Call in your local statistician for help. Explain your goal and let the statistician find the best way to obtain a valid and actionable result.
![]() Collect your data and run your stats: A discussion of data-collection methods and details of analyses are beyond the scope of this essay.
Collect your data and run your stats: A discussion of data-collection methods and details of analyses are beyond the scope of this essay.
![]() Balance statistical with practical significance: Especially with large sample sizes, statistical significance may appear. Always ask yourself if the difference is large enough to matter.
Balance statistical with practical significance: Especially with large sample sizes, statistical significance may appear. Always ask yourself if the difference is large enough to matter.
![]() Tie the findings back to your original questions: Okay—what now? Given that each question was a practical one in the first place, now is the time to take some action based on the findings.
Tie the findings back to your original questions: Okay—what now? Given that each question was a practical one in the first place, now is the time to take some action based on the findings.
USING HUMAN CAPITAL DATA FOR PERFORMANCE MANAGEMENT DURING ECONOMIC UNCERTAINTY
Kent Barnett and Jeffrey Berk
It’s no surprise that our world is enveloped in uncertainty. Economic uncertainty has reached levels not seen since the Great Depression. It is during these times that informed decision making is most urgently needed. Today’s decisions create tomorrow’s consequences. This essay focuses on how data are needed to make informed decisions about human capital and how the data should drive a process whereby human capital performance is managed by data, not by emotion or subjectivity. Here, we summarize the economy’s current state, articulate the business case for measurement as a catalyst for performance management, present practical ways to gather and use data in decision making, and offer case examples of how organizations are driving decisions with data today.
An Economic Overview
As we write, the economic front is staggeringly different from how it was at the turn of the century. The economy has ground to a halt and evidence suggests that the current recession may be like a long, cold winter: bitter and unpleasant. The S&P 500 has dropped by over 40 percent, an unprecedented $700 billion bailout was passed by Congress, industries from financial services to the automakers are lining up for government aid, and unemployment is rising at a fast rate.
However, if we are observant, we may find that investments in human capital are not being banished, by any means. Smart organizational leaders are urging others to use this time to recruit and develop the right people needed for future success. For example, in a November 10, 2008, advertisement in the London Times, a full-page ad written as an open letter to UK employers read, “Now is the Time to Invest in Skills.” It was authored by executives such as the chairmen of British Telecom and Marks and Spencer. It used compelling data to prove its point: Firms that don’t invest heavily in training are 2.5 times more likely to fail than firms that do invest heavily.
History shows that in the last sixteen years, the international community has seen the ratio of intangible to tangible assets grow from 0.6 to 1 in 1992 to 4 to 1 in 2008. This intangible value is not on the books of organizations, but it proves that the “right” people, if managed properly and if human capital processes are measured properly, will grow the firm. Further, during the same period, a 66 percent productivity gain occurred as firms found more efficient and effective ways to create and sustain high-performing workforces.1
Further historic data, published by Bassi Investments Research, show that firms investing heavily in human capital development outperformed the S&P 500 by 5.6 percent between December 1996 and September 2001.2 Of even greater significance is the finding from joint research by KnowledgeAdvisors and Bassi Investments that firms that measured human capital so as to manage it better outperformed the S&P 500 by nearly triple that—15.18 percent between January 2006 and December 2008.
Identifying Human Capital Processes
So, what are the human capital processes that should be measured in today’s grim economy, and, going forward for that matter, as a routine process? There are six core processes that need to be measured and they are recruiting, learning and development, performance, talent, leadership, and engagement. Each has subprocesses that allow for more micro measurement. They are as follows:
Recruiting
Forecasting workforce requirements
Recruitment, selection, and hiring
International assignment
Mobile workforce
Employee turnover
Learning and Development
Onboarding
L&D
Coaching
Knowledge management
Performance Management
Performance appraisal
Talent
Competencies assessment
Leadership
Succession planning
Leadership development
Engagement
Compensation and benefits
Employee satisfaction
Work-life balance
Workforce diversity
Measuring Human Capital Makes a Difference
Merely identifying and managing human capital is important, but it is not sufficient. We know that we manage only what we measure. So how can measurement make a difference? Here are some brief examples:
![]() On average, learning and development programs improve work-force performance by 4.8 percent, which translates to $2,820 per employee in improved workforce outcomes (based on 600,000 evaluations taken two months after training over a three-year period).
On average, learning and development programs improve work-force performance by 4.8 percent, which translates to $2,820 per employee in improved workforce outcomes (based on 600,000 evaluations taken two months after training over a three-year period).
![]() A major health-care insurer retained 93 percent of its top talent, people who were flight risks, after their participation in a leadership development initiative.
A major health-care insurer retained 93 percent of its top talent, people who were flight risks, after their participation in a leadership development initiative.
![]() A telecom equipment company attributed a 12 percent reduction in call-center support calls and a 10 percent reduction in errors owing to a skills-based program to ensure engineers who purchased their equipment could self-diagnose network problems.
A telecom equipment company attributed a 12 percent reduction in call-center support calls and a 10 percent reduction in errors owing to a skills-based program to ensure engineers who purchased their equipment could self-diagnose network problems.
![]() A major tele-floral company saved 15,000 hours of lost productivity with technology training of tele-floral agents, resulting in a $276,000 cost savings to bottom-line profits.
A major tele-floral company saved 15,000 hours of lost productivity with technology training of tele-floral agents, resulting in a $276,000 cost savings to bottom-line profits.
![]() A leading ERP company returned 18.2 percent in productivity gains by training end-users in its software and how to better use it.
A leading ERP company returned 18.2 percent in productivity gains by training end-users in its software and how to better use it.
![]() A consumer packaged-goods company attributed $74,000 in increased sales per person directly to a sales force effectiveness investment of $5,000 per person.
A consumer packaged-goods company attributed $74,000 in increased sales per person directly to a sales force effectiveness investment of $5,000 per person.
Based on over 500 million data points, KnowledgeAdvisors’ benchmark database indicates that approximately 55 percent of learning does not significantly impact job performance. This is referred to as “scrap” learning, or unrealized value. According to ASTD, the average spent on training and development is 2 to 3 percent of revenues. Conservatively, even if training expenditures across an organization with $10 billion in revenue were 0.5 percent, that would equal an annual investment of more than $50 million, revealing waste of approximately $27.5 million of unrealized value. A rigorous measurement program can conservatively reduce 10 percent of the waste, or a $2.75 million reduction in cost.
But human capital measurement isn’t just about outcome gains. It is also about efficiencies. For instance:
![]() A health-care organization used measurement technology to gauge a leadership program. It reduced the administrative burden of measurement (collecting, storing, processing, and reporting data) by 70 percent to 80 percent over prior measurement efforts.
A health-care organization used measurement technology to gauge a leadership program. It reduced the administrative burden of measurement (collecting, storing, processing, and reporting data) by 70 percent to 80 percent over prior measurement efforts.
![]() A payroll outsource provider measured learning effectiveness with reports generated from scalable learning evaluation technology that take fifteen seconds to generate, whereas the prior process required fifteen hours of manual work to produce the same analysis.
A payroll outsource provider measured learning effectiveness with reports generated from scalable learning evaluation technology that take fifteen seconds to generate, whereas the prior process required fifteen hours of manual work to produce the same analysis.
![]() A major accounting firm outsourced complex conferences with over 200 sessions in each to effectively measure all sessions and the overall conference in less than seven days’ lead time.
A major accounting firm outsourced complex conferences with over 200 sessions in each to effectively measure all sessions and the overall conference in less than seven days’ lead time.
![]() Corporate universities typically collect over 30,000 evaluations per month automatically with learning measurement tools and run over 5,000 unique reports on the data per month, using automated technology designed for L&D professionals to analyze learning data.
Corporate universities typically collect over 30,000 evaluations per month automatically with learning measurement tools and run over 5,000 unique reports on the data per month, using automated technology designed for L&D professionals to analyze learning data.
![]() A professional services firm leveraged smart-sheet evaluation questions consistently across the operation for two years, and a recent statistical analysis concluded that the smart-sheet scalable process offers more timely and consistently correlated conclusions on the data than onetime impact analysis. The company will forgo the onetime analysis and gain $400,000 in cost efficiencies by doing so.
A professional services firm leveraged smart-sheet evaluation questions consistently across the operation for two years, and a recent statistical analysis concluded that the smart-sheet scalable process offers more timely and consistently correlated conclusions on the data than onetime impact analysis. The company will forgo the onetime analysis and gain $400,000 in cost efficiencies by doing so.
Performance Management Is the Outcome of Measurement
Measurement of human capital doesn’t matter if it is not part of a process. Like any metric, it must be used to stimulate change and drive people to take action. The best practices that ensure human capital metrics are used to inform decision making, and they start with reasonable metrics and transform them into useful catalysts of change.
“Roughly reasonable data” means that the information isn’t perfect, but it has face validity; it looks right. Take a crawl-walk-run approach. Leverage the power and ease of evaluation. In every process previously mentioned, the organization evaluates its employees, gathers real-time feedback, and forecasts change—not just analyzes history. For example, an L&D evaluation can predict impact and management support immediately, without having to wait months or years and without having to spend time and money engaging in highly precise quantitative methods. Although not precise, the data collected are roughly reasonable and can be used in a timely manner to influence decisions. In the absence of the data, the emotional individual who yells the loudest in the room gets his way. That’s not how stakeholders would like to see decisions made.
Technology can gather evaluation data easily. Tools exist specifically for human capital professionals to allow them to author, administrate, and report. The burden of administration is reduced in collecting, storing, processing, and reporting evaluation results. Further, combining business outcomes with evaluation results gives a measure that can be tracked in articulate and concise ways through scorecards and dashboards. These results give a decision maker a real-time view of the operation and allow him or her to be agile in decision making.
Ultimately, the human capital analyst needs to do the following with data to make them a performance management process that informs decision making:
1.Trend it. Gather data consistently and comparably. Do trend line analysis on key performance indicators. Trended metrics can include productivity (revenue per employee), employee contribution margin (revenue-labor/revenue), general financial trends (revenue, profit, stock performance), realized value from training programs, quality of hire, competency gaps, voluntary turnover, performance review scores, and leadership ratings.
2.Benchmark it. Internal and external benchmarks of both actual results and evaluation data allow an analyst, and others who use the data, to have a point of reference to better interpret the information being analyzed. For example, a telecom company had a job-impact rating from an L&D program report score of 68 percent, and managers thought it was poor performance, comparing it to a child’s D+ in school. However, the benchmark data from other organizations conducting similar training were 43 percent. Once provided the reference, the managers had a different view of the impact of the program.
3.Set goals against it. Any measure worth managing needs to have goals set against it. The key is to have challenging yet attainable goals. Use historic trends and benchmarks to baseline the data when setting goals. But, use the goals as a worthwhile target. Goals can be inspirational and motivational if set appropriately and legitimately.
4.Dashboard it. A dashboard is a convenient place to store summary data that are visual and concise. Having a dashboard for senior executives with drill-down capabilities is a great way to emphasize the governance associated with metrics, but it is also a communication and change-management vehicle that informs stakeholders of decision making. Dashboards with four to six indicators for each of the six human capital processes referenced previously should be sufficient.
5.Compare it to actual results. Evaluation data are great and can be tapped to review the past and forecast the future. Then, correlate the data with actual results. For example, if you are measuring a Six Sigma program, track the error rates and see if they are trending down. Is that result correlating to the job-impact percentages that participants and managers feel the program obtained? Actual results may not always be available, but we must make every effort to use reasonable assumptions and gather the data to put alongside benchmarks, goals, and trends, and in dashboards.
Summary
In today’s economic uncertainty, human capital measurement is a must-have for informed decision making. Using reasonable approaches and turning data into a performance management process will mean that your measurements are not a one-off but part of existing processes necessary to manage appropriately. Leveraging technology, standards, and benchmarks enriches the process and makes for easier and more meaningful data from which to draw meaningful conclusions.
Notes
1.KnowledgeAdvisors, “Business Case for Measurement in Economic Uncertainty,” 2008.
2.KnowledgeAdvisors, “Human Capital Measurement and Its Impact on Stock Performance,” 2008.
USING HR METRICS TO MAKE A DIFFERENCE
Lee Elliott, Daniel Elliott, and Louis R. Forbringer
By now, everyone who works in human resources is well aware that HR is one component of a mega-system—an organization—that somehow operates to do whatever the organization is intended to do. All work gets done in systems. That is not a point of debate.
What is not so widely known is that the natural state of a system is chaos. Wheeler has eloquently argued that once a system is working effectively, that effectiveness is undermined by adding new employees who don’t know their jobs well, by changes in policy and equipment, by new managers who do not understand how the work is done, and so on. In fact, those attempting to keep systems performing at optimal levels are constantly battling these forces of entropy. If the battle is lost, the place falls apart—the system returns to its natural state of chaos and the organization fails.1
A key way to maintain high levels of performance in the organization is to monitor the subsystems, or processes, that drive the system. Unfortunately, processes are mute. They do not have an inherent way to let someone know that things are not going well until the problems become apparent and the damage is done. Obviously, the best option is to avoid the problems, but how does that happen? How does one “hear” what a process is saying about its condition before damage is done?
Again, Wheeler has provided a most useful answer. It is necessary to provide the process with a “voice.” That is, the process has to be given a way to produce a fairly continuous stream of information about its well-being. The way to communicate with a process is to develop a truly meaningful and useful measurement, or metric, that captures the primary operating characteristics of the process. As the process operates, the metrics provide the needed information and do so with a frequency that will permit careful tracking of the state of the process. As such, once there are early indications that the process is deteriorating, then action can be taken to make the needed corrections so that the process continues to operate at desired levels of performance.2
An early pioneer in developing metrics for HR was Jac Fitz-enz. He was among the first to say that there is a strong need for HR to find a way to communicate with those processes in an organization that drive turnover, effectiveness, and efficiency of recruiting, appropriateness of various costs related to employees, and so on. Others have taken up the effort (e.g., Huselid, Becker, and Beatty3) and have developed even more HR metrics and have recommended ways to optimize organization performance. The questions for those in the HR trenches are: What metrics should we use? And, once we get the metrics: What should we do with them? Unfortunately, the answers are not simple. Moreover, appropriate metrics for one organization may not be appropriate for another.
Choosing the Most Appropriate Metric
To begin the process of selecting HR metrics, consider why the HR department in your organization exists. For most, the two primary reasons for having HR is to bring in enough well-qualified people to replace those who leave and to ensure those who are brought in stay long enough that there is at least the potential for substantial ROI. As such, two metrics that certainly would be useful are job vacancy and turnover.
These two can, in some circumstances, effectively “tell the story” of recruiting and retention. That is, by monitoring these two metrics, HR can have a fairly clear picture of what is happening relative to recruitment and retention. Of course, there is a multitude of additional metrics that could be used and, in some situations, other metrics—such as time to fill—might be better. However, for ease of demonstration, the discussion here focuses on these two metrics.
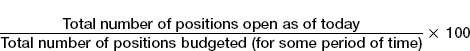
Next, ensure that the metric used is constructed in a manner so that it provides unambiguous information. A common approach to calculating job vacancy is as follows:
![]()
Unfortunately, this calculation is not at all unambiguous. It is something of a mess. Consider a company that has 1,000 positions when all positions that are budgeted are filled. Now, look at how job vacancy, as calculated with this equation, can become very confusing:
Scenario 1: 100 positions open today, job vacancy is 11 percent
Scenario 2: 500 open positions today, job vacancy is 100 percent
Scenario 3: 750 open positions, job vacancy is ?
The problem is that with this calculation, turnover results in both the numerator and the denominator changing—the numerator increases and the denominator decreases; that is, nothing in the equation remains constant. An alternative calculation that would remove the confusion is:
Using this equation, the scenarios noted above would change to:
Scenario 1: job vacancy is 10 percent
Scenario 2: job vacancy is 50 percent
Scenario 3: job vacancy is 75 percent
The latter calculation yields a metric that provides a greater understanding of the state of job vacancy. The lesson to be learned here is that you should not blindly accept that a given equation will yield the needed information to determine the well-being of the processes involved.
Plan for How the Data Will Be Used
Once the metrics to be monitored are chosen, it is important to have a plan in place to provide some detail on how the data will be used. That is, how will HR work with managers to gain an understanding of why the metric is moving as it is? For example, it’s not enough to say to managers, “Turnover is up; what are you going to do about it?” Managers can become quite resentful in these situations. They might have some idea of why turnover is occurring, but often don’t have a complete understanding. If a plan is in place to gain greater understanding of the metric before data are gathered, and both HR and management agree to the plan in advance, it becomes fairly simple to enact the plan once the metric begins to drift in a direction that suggests the process is being impacted by entropy.
Continuing with the example of turnover, HR could conduct an analysis of exit interviews to collect additional information on reasons the turnover is occurring. Unfortunately, the validity of exit interview information is certainly questionable in many situations. It is not uncommon for employees to be hesitant to tell the complete truth, for fear of burning bridges. Others just aren’t willing to spend the time to provide an understanding of why they are leaving. Moreover, the numbers of people who leave in a given area may be too small to provide more than a glimpse of what is happening in the department that is experiencing turnover. In short, exit interviews can provide some useful information, but it would be helpful if there were a better way to gain an understanding of the metric.
Fortunately, there is a better way. Within the realm of research, there are quantitative research designs (e.g., analysis of variance) and there are also qualitative designs (e.g., case studies). The former use statistical analysis to produce conclusions about the data; the latter involve intensive studies of events that may or may not involve data at all. For turnover, a highly effective approach to understanding what is happening in the organization that not only has produced turnover in the past but also provides ample evidence of what turnover is likely to occur in the future is a qualitative research design known as grounded theory.4
Grounded theory does not yield some abstract theory about why turnover is occurring. Rather, a theory of why turnover has occurred and is likely to occur in the future is developed and is “grounded” in information. In general, you begin by searching broadly for what might be causing turnover. As you gather information, the focus narrows dramatically and the effort concludes with testing and verification to ensure that what is believed to be the causes of turnover are accurate. The result is a well-considered explanation of why turnover happened in the past, as well as a basis of understanding turnover that will occur in the future. Of course, knowing what is coming provides the opportunity to do something to prevent it. As Fitz-enz has argued, using HR metrics to predict what is coming for the organization is the next evolution in our use of such metrics.5
Fortunately, with some slight modifications to make the grounded theory process move more quickly than is typically seen in a qualitative research study, this approach can be used to develop a substantial understanding about turnover in an area of the organization.
The steps to take are as follows:
1. Preparation
![]() Describe the process to the managers that will be impacted.
Describe the process to the managers that will be impacted.
![]() Respond fully to any questions they have.
Respond fully to any questions they have.
![]() Assure them that there will be no secrets—and keep the promise.
Assure them that there will be no secrets—and keep the promise.
![]() Provide a list of others who have gone through the process.
Provide a list of others who have gone through the process.
![]() Show the managers the list of questions that will be used to start the study and ask for their input.
Show the managers the list of questions that will be used to start the study and ask for their input.
![]() Modify the questions appropriately.
Modify the questions appropriately.
2. Initiate the study
![]() Select those who will be interviewed in the first group.
Select those who will be interviewed in the first group.
![]() Meet individually with each person selected; ask the planned questions and any additional questions needed for clarification.
Meet individually with each person selected; ask the planned questions and any additional questions needed for clarification.
![]() Carefully document the answers.
Carefully document the answers.
![]() Review the answers and look for patterns.
Review the answers and look for patterns.
![]() Create a second set of questions based on the information that was derived from the first round of interviews.
Create a second set of questions based on the information that was derived from the first round of interviews.
3. Continue the study
![]() Select a second group—choose those most likely to provide the needed information.
Select a second group—choose those most likely to provide the needed information.
![]() Use the second set of questions and any additional questions needed for clarification.
Use the second set of questions and any additional questions needed for clarification.
![]() Carefully document the answers.
Carefully document the answers.
![]() Review the answers and look for patterns.
Review the answers and look for patterns.
![]() Continue this process until all concepts are “saturated” (i.e., there does not appear to be any additional useful information to be obtained).
Continue this process until all concepts are “saturated” (i.e., there does not appear to be any additional useful information to be obtained).
Throughout the process, there are some analytic tools that are helpful to get to the underlying causes of past and future turnover as quickly as possible. Here are some suggested tools:
![]() Use conceptual ordering. Organize the information into discrete categories or concepts (e.g., turnover is occurring due to ineffective conflict). Develop a written description for each concept (e.g., ineffective conflict—leaves participants with substantial residual frustration after the conflict episode is concluded).
Use conceptual ordering. Organize the information into discrete categories or concepts (e.g., turnover is occurring due to ineffective conflict). Develop a written description for each concept (e.g., ineffective conflict—leaves participants with substantial residual frustration after the conflict episode is concluded).
![]() Dig deeper. Watch for words or phrases that strike you as significant. Use “flip-flop” technique (i.e., look for opposites or extremes to make the information more meaningful). Keep the focus—don’t get lost on a tangent. Obtain multiple points of view (e.g., ask people from another area in the organization about turnover in the area of focus). Gather information from multiple sources (e.g., bring in information from exit interviews).
Dig deeper. Watch for words or phrases that strike you as significant. Use “flip-flop” technique (i.e., look for opposites or extremes to make the information more meaningful). Keep the focus—don’t get lost on a tangent. Obtain multiple points of view (e.g., ask people from another area in the organization about turnover in the area of focus). Gather information from multiple sources (e.g., bring in information from exit interviews).
![]() Check the concepts. Ask the participants about what appear to be the causes of turnover; this is done in an effort to check the validity of the concepts with those involved in the study. That is, the people who are providing the information about why turnover is occurring also are those who confirm that apparent causes of turnover are, indeed, the true causes.
Check the concepts. Ask the participants about what appear to be the causes of turnover; this is done in an effort to check the validity of the concepts with those involved in the study. That is, the people who are providing the information about why turnover is occurring also are those who confirm that apparent causes of turnover are, indeed, the true causes.
![]() Break the concepts into subconcepts. When it makes sense, pull apart a potential cause of turnover. Consider “change strain” as a cause of turnover. Make special note of comments such as:
Break the concepts into subconcepts. When it makes sense, pull apart a potential cause of turnover. Consider “change strain” as a cause of turnover. Make special note of comments such as:
“We don’t get a chance to learn new things before something else starts. We never get a sense of mastery.”
“We are changing so much. I don’t know where we’re going. I’m beginning to worry about my future here.”
“Stress here is just too much.”
Upon careful examination, while all of these pertain to change strain, each suggests a slightly different component of change strain is creating turnover.
![]() Insert memos. As analysis of the documentation progresses, insert memos that include a list of the concepts and definitions. Be sure the memos fit together logically. Jot down breakthrough ideas immediately (i.e., once a cause for turnover becomes clear, write it down as a memo within the documentation).
Insert memos. As analysis of the documentation progresses, insert memos that include a list of the concepts and definitions. Be sure the memos fit together logically. Jot down breakthrough ideas immediately (i.e., once a cause for turnover becomes clear, write it down as a memo within the documentation).
![]() Provide ideas for how turnover might be reduced. Once the information gathering and analysis is complete, spend considerable time developing ideas that the managers might use to reduce turnover. Make the list long so the managers have choices—and the ideas in the list might lead to the managers developing other useful ideas. Get others who are knowledgeable to review the ideas.
Provide ideas for how turnover might be reduced. Once the information gathering and analysis is complete, spend considerable time developing ideas that the managers might use to reduce turnover. Make the list long so the managers have choices—and the ideas in the list might lead to the managers developing other useful ideas. Get others who are knowledgeable to review the ideas.
Now the information is gathered, the causes of turnover are understood, and ideas have been generated for reducing turnover. At this point the information needs to be provided to the managers. Here are some suggestions for doing that:
1.Schedule a meeting and prepare the managers by giving some initial information intended to reduce the managers’ anxiety. (It’s common for managers to believe the reasons for turnover all have to do with them.)
2.At the meeting, go over the highlights of the report. Give the managers the report to read during the meeting. Answer all questions. Schedule a second meeting.
3.At the second meeting, address all concerns and the action plan with the managers to implement ways to reduce turnover.
This process ends when the managers do something credible to reduce turnover—and turnover decreases to acceptable levels. Once that happens, it’s often beneficial to have a follow-up meeting with managers to review what was learned and to plan to enhance retention based on what was learned.
For example, what are some common causes of turnover that have been revealed using this approach?
![]() Ineffective conflict
Ineffective conflict
![]() Dramatic increases in the cost of gas
Dramatic increases in the cost of gas
![]() Strain of having to make changes
Strain of having to make changes
![]() Uncontrolled stress
Uncontrolled stress
![]() Cliques at work
Cliques at work
![]() Feelings of rejection by co-workers
Feelings of rejection by co-workers
![]() Manager too busy, not available
Manager too busy, not available
![]() Too much grief (in a hospital setting)
Too much grief (in a hospital setting)
![]() Bullies at work
Bullies at work
![]() Ineffective management
Ineffective management
This simplified version of the qualitative approach to information analysis—grounded theory—has been successful most times it has been used as the way to find why an HR metric is behaving as it is. Do note that this approach is not limited to an investigation of turnover. While it is not appropriate for all HR metrics, it is useful to understand the causes of variations of many of the HR metrics.
Bring It All Together—What Does It All Mean?
Once the HR practitioner has selected the optimal metrics to use to monitor key HR processes, and plans are in place for how to interpret and understand why the metrics are behaving as they are, then it is important to bring it all together. As Heather Cullen, HR performance consultant of The Hartford Company, has argued, it is necessary to use all the metrics together to “tell a story.”6 That is, you need to bring all the HR metrics together in a single document that can be used to understand what is happening to the primary HR processes in an organization.
The introduction of such a document will be an HR scorecard, such as shown in Table 6.1. In this scorecard, the HR metrics are clearly labeled and separated into categories that correspond to HR operations. Each operation can be relatively well understood by looking at the metrics. However, it becomes truly comprehended when this information is supported by intensive studies of any substantive changes in the HR metric that will tell why the changes occurred and what is to be expected in the future. Moreover, providing plans that have been developed—and are supported by managers—to address expected future changes in HR metrics that might adversely impact the organization will certainly take HR to a new level of usefulness to the organization.
| Category | Metric | Frequency |
| Attracting Talent | Job vacancy rate | Monthly |
| Attracting Talent | Number of hires | Monthly |
| Attracting Talent | Time-to-hire | Monthly |
| Attracting Talent | Type of hire—add vs. replace | Monthly |
| Attracting Talent | Source of hire | Biannually |
| Engage | Number of grievances | Annually |
| Engage | Employee referral | Biannually |
| Engage | Employee satisfaction scores on surveys | Biannually |
| Operations | RN FTE per patient | Annually |
| Operations | Salaries, wages, and benefits as a percentage of budget | Annually |
| Operations | Salaries, wages, and benefits per case-mix adjusted admission | Annually |
| Operations | Defects—issues, malpractice suits, etc. | Monthly |
| Operations | Cycle time—actual patient stay vs. planned stay | Monthly |
| Operations | Revenue per employee | Biannually |
| Retention | Total and voluntary turnover | Monthly |
| Retention | 180-day turnover rate | Annually |
| Retention | RN ages—% eligible for retirement in 5 or fewer years | Annually |
| Retention | Top voluntary turnover reasons | Biannually |
| Retention | Retention rate for top performers by dept. or job code | Biannually |
| Workforce Demographics | Headcount vs. budget | Monthly |
| Workforce Demographics | Active FTEs | Monthly |
| Workforce Demographics | Contract employee use by job code | Monthly |
| Workforce Demographics | Count of staff by diversity category | Biannually |
| Workforce Demographics | Count of staff by gender | Biannually |
| Develop | Training type | Biannually |
| Develop | Training spend | Annually |
| Develop | Promotions | Biannually |
Notes
1.D. Wheeler and S. Chambers, Understanding Statistical Process Control, 2nd ed. (Knoxville, Tenn.: PSC Press, 1992).
2.Ibid.
3.M. Huselid, B. Becker, and R. Beatty, The Workforce Scorecard (Boston: Harvard Business School Press, 2005).
4.B. Glaser and A. Strauss, The Discovery of Grounded Theory: Strategies for Qualitative Research (Chicago: Aldine de Gruyter, 1967).
5.J. Fitz-enz, Building an Integrated and Predictive HCM System. Presented to the Talent Summit, sponsored by the International Quality and Productivity Center, October 2007, Tucson, Ariz.
6.Heather Cullen, personal communication, 2009.