CHAPTER FIVE
Collapsing the Silos
“For every failure, there’s an alternative course of action. You just have to find it.”
—MARY KAY ASH
Everything that happens in an organization, from an individual’s decision to act to the outcome of a major initiative, is the result of a single or, more likely, multiple processes. All processes share a fundamental three-part model consisting of inputs, throughputs, and outputs. Human capital management, especially the HCM:21, provides a new view of these processes, and in the bargain collapses the silos that characterize yesterday’s organizational structure. The result is a means for process analysis and process optimization that makes the HR function part of corporate strategy.
Any Process: Input, Output, Throughput
At the individual level, inputs are made up of a person’s background, such as past experience, education, knowledge, and current behavior of his or her family, friends, and the constantly changing phenomena that make up this world. Often ignored in the layman’s analysis of a person’s behavior and decision making is the individual’s value system, personal health, career interests, ambitions, and goals. Other inputs include what a person takes in from his or her environment, which includes both the behavior of others and any observances of the surroundings. Behavioral data include the actions of co-workers, as well as inputs from outsiders such as suppliers, vendors, consultants, competitors, or people whom the individual meets in the course of the day outside of work. Direct data include observations of internal events, the reading of reports, and information from the external world. Externally, the state of the economy, political trends, and even the win-loss record of a favorite team can influence a person’s state of mind, and hence his or her reaction to incoming stimuli. For example, you know that when you are tired, sick, or depressed, you feel stress much more readily than when you are fresh, well, and happy.
Throughputs include the actions and methods in a process. This category covers variables such as policies, procedures, systems, tools, and information applied to the process deliberations, decisions, and actions. Also included is feedback from previous experience concerning related issues. For example, if you input to an ongoing process, what is the result? Usually, someone takes whatever you do and incorporates it into his process. Your output is that person’s input.
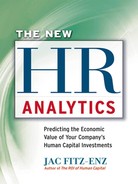
This transfer of energy can make or break relationships, and on a grander scale, it can make or ruin a company. It is what makes organizations efficient, effective, and sustainable or not. Things don’t just happen—people make them happen through processes, as Figure 5.1 shows. Is your contribution to the process well received and appreciated? Or is it ignored or denigrated? Your answer will influence the way you act the next time you deliver your product or service. It also influences your perception of your value, and here is the core of the antipathy toward the traditional human resources department.
The programs and services of HR are inputs to the workload of line managers and employees. Too often, however, we intrude on these managers (in their view), asking them to fill out new forms or take on new processes for which they see little or no value. Their job is to get their work done, to meet their commitments, and to be accountable for certain results. Human resources is a nuisance to them, rather than the business partner HR claims it to be.
Figure 5.1. Staffing process model.
Turn the tables and consider this instead. You are a manager in the midst of a stressful, complex situation, in which you need to produce something quickly and accurately. Along comes someone with a question, a request, or a demand that you stop doing your job to satisfy his needs instead. It doesn’t matter that the individual is offering or requesting something that is important to you or to the organization. He’s still a pest and doesn’t show concern or respect for your needs. To make matters worse, when you have a problem sometimes they quote policy rather than help you solve it. Now, do you understand why people claim to hate HR? If this is the situation at your organization, then you need to consider process analysis.
Process Analysis for Human Resources
Periodic process analysis can greatly increase both efficiency and effectiveness. Process analysis received a great deal of attention in the 1980s, with the quality movement. Then, it was all about how to lower the cost and improve the timeliness and quality of manufacturing processes. It spawned the Six Sigma phenomenon that eventually reached staff functions such as accounting, information technology, and human resources. Shortly after that came reengineering. Again, this movement started in manufacturing and eventually moved to functions such as call centers, where high volume, high cost, and high value were obvious conditions. In the case of human resources management, reengineering could be applied to planning, hiring, paying, developing, and retaining talent.
Human resources does not have the volume of transactions that manufacturing has except perhaps the human resources function in an employee call center, yet the impact of HR processes on internal operations can be significant. Consider the effect that substandard staffing or inadequate training programs can have on an organization’s operations. A more obvious example is payroll processing. Although typically housed elsewhere, this aspect of HR includes processing changes in wages or salaries and forwarding them to an outsourcer or the accounting department. Regardless of its location, payroll processing can be optimized. For example, we have had occasion to run process analytics for payroll and have found vast differences in procedures across companies, with the cost to cut a paycheck ranging from about one dollar per check to ten times that amount.
Chapter Four looked at the process of workforce planning. The inputs were data from external and internal sources; the throughputs were the identification and analysis of human, structural, and relational capital and their interactions. This analysis showed that outputs could be changed from simply filling gaps in the fabric of the workforce to building a capability system. The values added were twofold. One was the change of focus from structure-bound gap analysis to a human capital management that could generate sustainable strategic capability. The second was a change from an annual plan to an ongoing analysis of the cost and productivity of the workforce. These are no small differences. They are an order of magnitude higher and of greater value than the traditional workforce planning model. Such is the importance and value of process analysis.
A New Staffing Process
In large companies, the staffing function is often divided into sourcing and selection. Some staff members spend all their time finding and exploring sources of new applicants. Then, selection teams take those applicants through rejection or offer of employment. In smaller organizations, a staffing person is responsible for the entire process. In either case, though, process analysis is important, for one very good reason.
Over time, or under high-stress conditions, the repetition of an act can become so ingrained that a person stops using his or her best thinking and relies on past experience. The individual claims not to have the time to analyze, plan, or change; yet, he or she always seems to find time to do it over when the established process fails. In line repeatable assembly jobs, the process is fixed by engineers and the workers simply follow the procedure they are taught. In professional service functions, such as staffing, one expects the provider to use skill, experience, and imagination to carry out the process in the most effective manner. This is necessary because in the latter function, there is often significant choice and variance in methods or procedures. These variations can be internally generated by the demands of the hiring manager or externally influenced by the availability of skills in the job market and/or the uniqueness of applicants.
For the most part, career recruiters use not only past experience and developed skills but also an awareness of the demand:supply ratio to do their job well. Nevertheless, anyone who does the same task day after day is susceptible to falling into a routine that is not necessarily the most effective. Process analysis can be helpful in increasing the yield, reducing the cost, or improving the end result (the output).
Applying process analysis to staffing, HR can determine that the inputs are job applicants who come through sources such as advertising, job boards, agencies, and employee referrals. The throughputs are the selection and orientation or induction methods, and can encompass individual and group interviews, testing, assessment, and onboarding. I include onboarding in the throughput because I don’t believe that the new hire is truly on board until he or she has gone through an inductive process. I have seen cases where new hires leave on the first break or at lunch during an onboarding program. So, you really don’t have a new hire until that person reports to the supervisor involved.
Extending the Staffing Process from Hiring to Management
There is a small problem, analytically speaking, when you evaluate some-one’s work history and then report the individual as a good or bad hire. Once the new hire joins the organization, the staffing function’s job is completed. Thereafter, the person’s performance and tenure are influenced by his or her interactions with others in the organization. This is no longer a hiring issue; it is a management issue. Having said that, HR can still apply the HCM:21 process optimization model and obtain valuable insights, not only into the process but also into the management of the ensuing output.
There are firms that offer to run a source analysis for a client, and these have value because they show the client which sources tend to produce the better-quality applicants. They also purport to show which sources produce the better employees. However, here is where I disagree. The output of a staffing process depends on the input and the throughput methodologies, as well as on subsequent internal circumstances. It can be a rash judgment to evaluate new hires strictly on the basis of the source from which they came.
For example, one source might produce a highly qualified candidate, but the selection process may frustrate the candidate before he or she can reach the job offer so, in evaluating the hiring process, you have to add on-site enhancers or barriers. I had such an experience early in my career, when a family friend arranged an interview for me with a successful international company. I could have handled the job in question, but by the time I had met three managers, I was so put off that I passed on the opportunity.
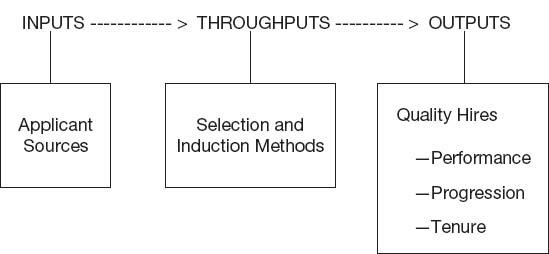
Figure 5.2 is a list of people hypothetically hired two years ago for a given mission-critical job group. We started with mission-critical jobs because they have the greatest effect on the organization. After you study the figure for a minute, can you see which source produced the best results in terms of performance, progress, potential, or tenure?
Figure 5.2. Staffing process analysis.
For the sake of brevity, let’s confine the evaluation of this process to tenure. At first glance, you might say that newspapers are not a good source, since two (Ken and Leo) out of three (Didi) left the organization. Indeed, this is what a source analysis might conclude. However, if you look at the selection methods, you might focus on the correlations between individual and group interviewing, or on who was tested or assessed and the subsequent performance or potential. You could also look at onboarding. Here, you see that Didi went through onboarding and is still here (two versus one). Ken and Leo did not, and they have left, voluntarily or involuntarily. If you push a bit further, you see that everyone who went through onboarding is still with the organization, and everyone who did not get onboarded is gone.
This is a valuable insight, isn’t it? You can continue to look at other sources and methods for additional information. If your sample has a large number of hires, you need to conduct some type of statistical procedure, such as a regression or clustering, to draw out the critical variables. In the end, you will discover which combination of sources and methods were the most effective in terms of each result. Clearly, this knowledge is invaluable when it comes to developing a strategic staffing program. Also, it guides HR in cost management. In the end, you have both cost and performance improvement.
A Broader Future View
To take this further yet, you can build a model that brings into play additional future variables. To do this, you look at factors outside of the past hiring experience. For instance, by studying the environmental scan described in Chapter Three, you can at least hypothesize about the future effects of external market forces beyond the available labor supply. Obviously, if you have determined that the economy is trending strongly upward, this suggests that the demand:supply ratio will change in the near term.
Other forces, such as competitor actions, entering new markets, new laws, or technology changes, will also affect your efforts to fill mission-critical positions. For a long-term view, you could study trends in college graduates and their fields of interest. Are young people majoring in disciplines you need, or not? Through experience you can put the ranges of these effects on the external forces and construct algorithms. Now, HR can truly become predictable.
By way of explanation, an algorithm is simply a formula or an equation that contains a set of variables. These variables are arranged in such a way as to predict certain outcomes for a given interaction of variables. For example, take a look at a possible equation:
O = S × M +/– E × I
The variables are:
O= the predictable outcome
S= source of applicants
M= selection methods
E= various external forces (economy, competition, education trends, technology) that are given weights based on their estimated strengths
I= various internal factors (state of finances, development investment, turnover rate, etc.)
The multiplier and positive versus negative factors suggest the judgment of the person conducting the analysis. In time these will prove accurate or they can be modified until a valid, reliable algorithm is obtained.
When faced with the task of process analysis, some people invariably say they don’t have time to do this. It is clear that they will lag behind those who take the time to learn how to do the job, and this gives the latter a competitive advantage. Remember that America experienced massive losses in market share during the 1960s and 1970s, which spawned the need for quality improvement. It seems that we have to hit bottom sometimes before we can recognize that analysis is essential for continued growth.
Within the human resources function, this decline is already under way. In 2000, the first major HR outsourcing contract was signed. Today, many companies have pushed record keeping and payroll processing outside their buildings. Other HR functions, such as staffing and training, are also being restructured and in some cases outsourced. Remember, there is a truism in economics: The work will always go to the source with the lowest cost and best quality. If HR does not adopt process analysis, it will continue to learn the hard way as its role diminishes.
Other HR Applications for Process Analysis
Process analysis and optimization can be applied to HR functions that go beyond staffing. Training and development and retention programs are also being analyzed by various organizations.
Trainers have maintained for decades that the value of their programs cannot be measured. This idea, however, has been refuted many times in the work of people like Jack Phillips at ROI Institute, as well as in my publications going back as far as 1994.1 In the latter case, I collaborated with a group of trainers from a dozen companies to develop an evaluation model for training. This model was tested in a wide variety of training programs, and in every case the model was able to determine the dollar value of the training event.
In another application of process analysis, Figure 5.3 displays a brief example comparing the impact of training events from different sources on different job skills, looked at before and after performance. It also shows tenure as a possible variable for correlation.
In this example, you can see that all the persons using self-directed materials have stayed with the organization. A secondary analysis of those persons might reveal something unique about them that could be applied to other issues. For example, they may be highly motivated and ambitious. You’d want to look at their backgrounds for tips on possibly fast-tracking them. Those persons using other sources have a mixed record of performance and tenure. Do you see any other tendencies?
Figure 5.3. Learning process analysis.

After thirty years of doing this type of analysis, I still don’t understand how HR managers can claim to manage a function when they have no data on process or results. Exactly what is it they think they are managing? If the sales manager couldn’t tell us how much his people sold and at what margins, would we believe he or she is managing sales? The same goes for production data and results. Yet, HR people shrug their shoulders and still expect to be invited into the conversation.
Turnover Analysis
In 1981, Motorola bought the computer company where I headed the HR function. Bob Galvin, the CEO of Motorola, told me that he considered preventing the loss of a valued employee as a management defect. Twenty years later, Mr. Galvin had retired and Motorola went through the hiring and layoff cycle that cost the company over $1 billion. This event was a symptom of a larger management issue that seemingly has never been resolved. The company has gone through a series of short-tenured CEOs and has continually lost market share. To me, it is a dramatic case of what happens when there is no clear HCM strategy backed by effective execution of the process; the company heads down a slippery slope at ever-increasing speed.
The loss of highly trained and skilled people is truly a management error. Unwanted turnover spawns a loss of the time and money that had been invested in training and mentoring. No matter the state of the organization, turnover should be limited to the uncontrollable and involuntary. I am assuming that you have some type of engagement and retention program under way. The question is: How effective are these initiatives? You can start your analysis by segregating the turnover into controllable and uncontrollable. Sample categorization of each is shown as follows:
| Controllable | Uncontrollable |
| J = better job offer | F = family status change |
| S = better salary offer | R = relocation |
| C = change of career direction | S = return to school |
| T = lack of training opportunities | L = leave of absence |
| D = dissatisfied with supervisor | IP = involuntary: performance |
| W = dissatisfied with co-workers | IB = involuntary: behavior |
There can be many other reasons for turnover, but these are the most common. You can also trace related issues such as tenure, or years of service at time of departure. The state of readiness should be noted, however. In which cases was there a person prepared to step into the vacated spot? Remember, gaps in performance cause customer losses. In the case of each departure, you could follow up with the relevant department in sixty days or so to determine what the immediate impact was of that loss of personnel.
With the data, you can go back to your engagement and retention processes and reassess their effectiveness. For instance, what are the data telling you about your hiring and induction methods, development opportunities, compensation, interpersonal relations, or supervisory leadership? Outcomes can often be the result of interactions between these and other variables. How do you stop the bleeding? What are or were the inputs and throughputs for those activities? If the sample size is large enough, you might be able to run some statistical analysis to show how you can optimize those processes.
The Integration of HR Services
The greatest leverage opportunity for HR managers can be found in how their services are delivered. Almost all HR departments—read over 95 percent—deliver in a fragmented manner. That is, each function, from planning and staffing through compensation and benefits to development and relations, operates in its own silo. Although there is a general HR plan, each function develops and delivers on its own time schedule, with little or no regard for what its sibling functions are doing. If you doubt my claim, ask yourself how often staffing, compensation, and development synchronize their offerings. Development usually knows little of the quality of new hires or the introduction of new pay plans. Likewise, compensation looks only at pay and benefits, neglecting to include development and employee relations investments in a total-rewards system.
Service integration is absolutely essential to high performance. It improves efficiency through synchronized activity of various groups within a functional unit. Proof of the value of an integrated approach comes from Dick Kovacevich, retired CEO of Wells Fargo Bank. In a March 2007 interview by USA Today, Kovacevich was asked how it was that Wells Fargo sold more products and services per customer than any other major bank. His answer was succinct and to the point: “The first thing we’ve got to do is not to have silos. We had to design our culture and systems to focus on the customer, not on the product line. We reward the behavior we want, which is getting all of our customers’ business.”2
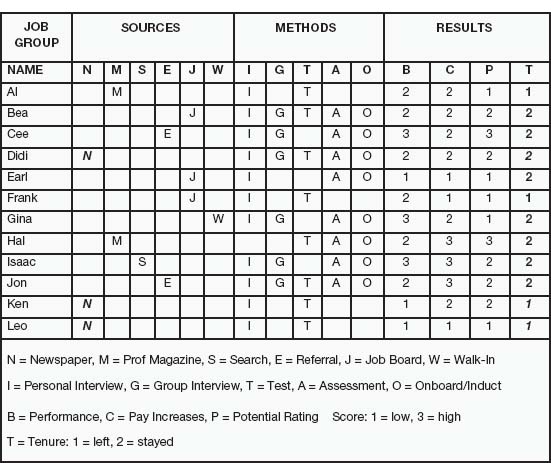
Rather than have the bank’s various departments—that is, commercial loans, branch offices, credit cards, treasury, mortgages, etc.—attacking the customer one after another, Wells Fargo set up a system wherein all departments work together for each customer. The same idea would be much easier for an HR department, where all functions are closely related to each other. Figure 5.4 is an example of an integrated, synchronized delivery system.
Underlying an integrated system is the operating dictum of synchronization. Not only do the various HR units recognize their interdependency, they also realize that their delivery should be timed with each other. This builds a natural harmony that is often missing. The classic example is the orchestra, wherein each section knows when it is to enter and leave the musical line. If the timing is off, so is the rhythm and phrasing. Of course, the conductor is there to cue the entrances and exits so that this doesn’t happen.
Figure 5.4. Integrated delivery system for HR function.
In Figure 5.4, you see that different activities are timed to start at different times. This synchronization of delivery requires an integrated HCM strategy. It ensures that employees are signaled by a service at the right time. Clearly, planning precedes staffing and staffing leads to training and development. What the figure can’t show are the many specifics that need to be synchronized. For example, when the staffing function is taking on a major hiring project, it should talk with whoever handles onboarding, as well as alert L&D to the impending arrival of new people who will need various developmental experiences. Likewise, compensation needs to review its structure, processes, and pay systems to support the mass hiring effort. By integrating around a common goal and synchronizing service delivery, the organization presents a united front that produces the optimum result.
The secret to integrated, synchronized delivery is leadership on the part of the CHRO. Functional heads are not asked to give up their autonomy. There should be no loss of discretion or power with little personal value in return. The CHRO, with CEO support, must lead by showing how integrated and synchronized delivery is best for the managers, employees, and customers. As Peter Drucker has said, the purpose of a company is to create a customer. And by doing what is best for customers, employees at all levels ensure that they are most likely to keep their jobs.
Notes
1.Jac Fitz-enz, “Yes You Can Weigh Training’s Value,” Training, July 1994.
2.Greg Farrell, “CEO Profile: Richard Kovacevich,” USA Today, March 28, 2007.
HOW THEY ARE APPLYING IT
The essays in this chapter are case studies of the application of human capital research to manufacturing, supply-chain management, and time and labor data analysis. These stories show how process analysis can be applied, using the principles of human capital management.
ROBERTA VERSUS THE INVENTORY CONTROL SYSTEM: A CASE STUDY IN HUMAN CAPITAL RETURN ON INVESTMENT
Kirk Hallowell
Although many human resources professionals continually call for a standard set of metrics to track HR services and demonstrate return on investment, no one has stepped up to the challenge. During the 1980s, at Saratoga Institute, we introduced a set of metrics that we continued to publish for nearly twenty years. Still, the Society for Human Resource Management (SHRM), the national professional society, chose not to endorse those or any other system, leaving the profession without a standard method. That is the equivalent of there being no Generally Accepted Accounting Principles (GAAP) for accounting. This essay, therefore, offers some alternative ways of conceptualizing and measuring the return on human capital from a perspective parallel to tangible capital investments.
By way of making the point here, I use as an example the experience of the Sundance Distribution Center, which decided to build a new facility in central Michigan. If investments in human capital cannot be linked to financial returns with valid and reliable methods, the current accounting methods for depreciating or appreciating tangible assets cannot be applied. The metrics and/or the rules of accounting must be modified if a new way of thinking about investing in people is to be applied and sustained.
Different Expenditures, Different Measurements of ROI
Human capital expenses, including payroll, benefits, and training, constitute as much as 70 percent of corporate budgets. The absence of consistent metrics and the fact that spending in human capital is expensed rather than depreciated create a mindset that impedes corporate leadership from managing, measuring, and maximizing the return on investment in human capital as they would any other investment in tangible assets. Four human capital performance metrics are suggested here as superior alternatives in measuring and managing return on investment in human capital, with direct relationship to standard ROI analysis.
Sundance Distribution Center is a $2 billion consumer products company with distribution centers in four states. Based on a five-year strategic business plan, Sundance decided to build a distribution center in central Michigan. The business case for the distribution center was clear: A center in this geographic area would decrease transportation cost and time to delivery while increasing product throughput to an emerging market base. The initial proposal to build the center included detailed business plans with a strong business case, detailed market and competitive analyses, and financials including capital investments, risk analysis, and projected return on investment.
The business plan for the distribution center included $20 million to acquire the land, build the facility, and equip the physical plant. The business plan also addressed staffing the center for the first year. In this case, the plan anticipated a staff of 125 employees. With an average cost to hire or transfer at $1,500, initial training at $1,500, and an average salary and benefits package of $38,000 per employee, the initial human capital investment for the first year of the plant was $5,125,000.
While investments in tangible and people assets were directed at the same business outcome, the accounting process for each investment was remarkably different. The costs of hiring, compensation, and training people were expensed and they impacted Sundance’s balance sheet immediately. The investment in the physical plant of the distribution center was listed as an asset, and was to be depreciated over thirty years. Various categories of equipment will be depreciated over respective depreciation schedules. As a result of these accounting procedures, the expense of the physical plant captured on the balance sheet would be significantly less than the initial investment in human capital, even though the total investment was far greater. This fact, however, would pass relatively unnoticed in Sundance’s report to stockholders.
The Perennial Accounting Problem
Investments in buildings and equipment are assets, while investments in people are expenses. This is consistent with over a century and a half’s worth of accounting principles. But what happens to the financial value of these two investments over time?
From the moment construction is completed, the physical asset of the distribution center will incur maintenance and utility costs to minimize deterioration. As the building, equipment, computers, office furniture, and other tangible assets age, they decrease in value. Within a period of time, most of these physical assets will completely lose value and eventually will need to be replaced. In the case of our $20 million distribution center (excluding the value of the land on which it is located), its value is likely to drop by 30 percent in the next ten years and may incur $20 million in maintenance and utility expenses during that same period of time.
The strategic value of the distribution center is to increase distribution efficiency, speed, or throughput that will result in an ROI in capital investments. Without a commensurate investment in human capital, however, the distribution center offers nothing more than enclosed space, motionless equipment, and inventory. The people operating the center will also incur expenses as time passes. Each employee requires pay, benefits, training, and human resources administration to keep the center operational. Unlike physical assets, however, the value of human capital will increase over time. As each employee gains experience in managing and operating the center, his or her talent and expertise grow. If training and management efforts are successful, people-driven processes will become more efficient and quality will improve. In the end, individuals will increase their ability to add value to the organization while the predetermined investment in salary, benefits, administration, and training will remain relatively constant. If the return on investment in the distribution center is driven by people, why is this investment listed as a nondepreciated expense in the quarterly report?
The solution to this problem is clear: Modify the metrics and/or rules of accounting to reflect a new way of thinking about investing in people. In this case study, we compare the return on investment in two entities within the Sundance Distribution Center: a new inventory control system and Roberta, a new freight team associate. Four human capital metrics are suggested as viable analytic devices to track return on investment in both of these entities over time.
The Inventory Control System
As an integral part of the plan to increase efficiency and throughput in the distribution center, the site plan includes a state-of-the-art inventory control system. It features handheld scanners and a central software package that ties directly into Sundance’s enterprise resource planning system. Based on anticipated needs, the system design specifications and performance standards are set. Requests for proposals go out to a variety of vendors and a competitive bidding process ensues. Eventually, a vendor and system are selected, and the final bid amount is included in the budget.
In planning the anticipated return on investment in the scanning system, the financial analysts considered the cost of purchase, the cost of physical implementation, and the cost of training associated with getting the system up and running. As the system is implemented, it will take time before the return on investment is realized. It is not until the system is fully functional and accurately tracking inventory and orders that the full financial return on the system will be realized.
The relative return on investment in the scanning system can be tracked as illustrated in Figure 5.5. In the initial installation of the system, there is a net financial deficit created based on the investment to procure the system shown at Point A. As the distribution center begins operations, time and resources are invested in implementing the system, articulating outputs with order entry and inventory control processes. As the various bugs are worked out of the system, and the system begins functioning as it was intended, the efficiencies are realized and the target level of production is gradually achieved (Point B). Eventually the system is operating at design parameters defined in the operations plan; we may refer to this as “full productivity” (Point C). Additional steps to optimize the system may gradually increase the return on investment over time.
Figure 5.5. ROI in the inventory control system.

Roberta
Parallel to the investment in the inventory control system, an employee named Roberta enters the workforce at the distribution center as a freight team associate. Roberta begins her work by moving through a period of onboarding, which includes job orientation and initial training. This process is captured from a return on investment perspective in Figure 5.6 as “Roberta’s Learning-Value Curve.” Moving through orientation and initial training classes, Roberta incurs a cost in payroll and benefits rather than generates revenue (Point A in Figure 5.6). As Roberta gains her bearings and begins to understand her job requirements, she is able to fill orders and track inventory by understanding the order fulfillment and shipping process while mastering the inventory control technology used in the center. Again, parallel to the implementation of the inventory control system, Roberta’s economic contribution to Sundance is realized only as her actions conform to the expectations of her job description, and this will take time to accomplish.
Figure 5.6. Roberta’s learning-value curve.

As Roberta gains competence in her position, she adds value to the organization at a rate higher than her salary and benefits, and she creates positive economic return (Point B). At this point in Roberta’s tenure, training adds substantially to her capacity to return value to the company. While formal training is critical, the main source of her ability to create value is on-the-job learning. She will increase her skills and proficiency as she encounters errors and learns how to prioritize her tasks. She will master complex social networks of peers and supervisors to get problems resolved and tasks accomplished more efficiently. Other than training costs, Roberta’s increasing value to the organization does not require an immediate increase in rate of investment.
From an investment perspective, the period of time that it takes Roberta to reach a break-even point and then move to a point of meeting or exceeding productivity expectations is critical. This part of the appreciation process reflects Roberta’s learning-value curve. The curve will likely be steep at first and level out over time (Point C). Once Roberta meets a criterion-based level of performance defined as “full productivity,” her learning curve will directly reflect the value she creates for the company.
Four Human Capital Performance Metrics
The learning-value curve provides a way of thinking about how human capital appreciates over time. Representing the curve graphically allows us to visualize the effect of various conditions that could impact return on investment. The learning-value curve also introduces the possibility of measuring ROI in human capital with a new set of performance-based metrics. Each of these metrics considers individual and environmental factors that impact the creation of value in human capital over time. Each metric is designed with these three principles in mind:
1.Each of these metrics is event driven. Effective assessment of ROI is determined by how and when measurement takes place. In the case of other capital investments, it is not useful to wait until a quarterly profitand-loss statement is issued to respond to a serious financial issue. Human capital metrics must also provide timely, goal-directed information that is not constrained by the schedule of an annual or semiannual performance review process.
2.These measures are constructed to be clear and practical. Any measurement system that cannot be quickly understood by every individual in the organization from C-suite to associate is not likely to have impact. Measurement systems that require excessive data collection and report routines that are not seen as relevant to work will quickly collapse under their own weight.
3.These metrics focus on points of highest leverage for gain or loss of ROI in a human capital system. A successful measurement system will include fewer strategic measures.
These three principles also lend significant support to the idea of linking development of human capital directly to dollar figures. Because the measures outlined are event driven, measures and financial transitions can be more carefully defined. By integrating competencies with performance, assessment of productivity can be both forecasted and validated. Because measures are clear and practical, the measurement and reporting process should be accessible to all levels of the organization. Finally, given the fact that over 500 human capital and HR metrics have been identified, the four metrics listed here represent a “short list” based on leverage to support evaluation and continuous improvement of human capital systems.
Performance Metric 1: Time to Full Productivity
Roberta’s learning-value curve will continue to increase over time and reach some level of sustained value. A particular point in this value-appreciation path will be objectively defined in terms of productivity, skills, and knowledge achieved. This point is labeled “time to full productivity” (TFP; Point C in Figure 5.6). TFP is a critical metric of human capital appreciation, as it has the potential to focus and direct investment strategies.
Roberta’s assent to full productivity parallels the implementation of the inventory control system. As the system is implemented, a series of prescribed steps, parameters, and procedures are determined to ensure that the system is operating effectively. Integration with existing software and overcoming user errors take time and intention. In the same way, Roberta’s orientation to her position will depend on the training, support, and her own motivation to reach her goals.
A challenge is to define TFP in a clear and objectively measurable way. Quality and productivity measures are lagging indicators of ROI. Technical and leadership competencies, as well as quality of relationships with her boss and peers, predict Roberta’s future performance and her contribution to the overall performance of the center. Established research has indicated that the potential to reach superior performance may be determined by reliable assessment of validated competencies for a particular job or job class.
Of course, no set of competencies, however rigorously assessed they might be, ensures performance. Performance is a transactional concept. Roberta may come to her position with well-established competencies and experience that support performance-differentiating behaviors on the job. If she is undermined by a political agenda, demotivated by a dysfunctional manager, thwarted by lack of training and support, or does not fit with the values and culture of the organization, Roberta may fail in her position regardless of her competency.
Roberta’s ability to reach full performance is determined largely by her own motivation and her ability to find the resources she needs to be successful. The end goal of full productivity needs to be carefully defined and quantified by line management and human capital professionals. The path to that destination should be determined by Roberta in collaboration with her supervisor. A clear process and shared expectations enable the supervisor to move from a directive to a facilitative role.
If we apply the impact of Roberta’s example to many hires, we can quickly see the potential value of any human capital investment that will shorten employees’ TFP. Strategies for decreasing TFP include:
![]() Integrated talent development systems
Integrated talent development systems
![]() Selection for competencies and adaptive learning skills
Selection for competencies and adaptive learning skills
![]() Competency-based training
Competency-based training
![]() An aggressive onboarding process
An aggressive onboarding process
![]() Early identification of development needs
Early identification of development needs
![]() Candid and frequent performance feedback
Candid and frequent performance feedback
![]() Incentive-based pay
Incentive-based pay
Also, looking at environmental issues such as work process flow, equipment, and resources necessary to support work performance will contribute to productivity.
If effectively implemented, the value of TFP as a measure is that it drives ownership of the measurement process down into the organization. Many performance management systems do this by asking employees to create personal SMART (S = specific, M = measurable, A = attainable, R = realistic, T = timely) goals aligned with company strategy. In some cases this can be an overly ambiguous task. A competency-based definition of “full performance” defined for specific jobs would provide greater clarity and consistency of these goals. A SMART plan aligned and integrated into an onboarding process with specific performance goals linked directly to competency development would create an objectively assessable target for TFP.
Performance Metric 2: Quality of Hire
Just as a variety of inventory control systems would take various amounts of time to implement based on their complexity, level of customization, and eventual depth of implementation performance, individual employees will reach full productivity at different rates. Each individual hire will have a different starting point, shape, and trajectory of the value-learning curve in TFP. While there are many different factors that determine the starting point and shape of the learning-value curve, quality of hire is the strongest. Quality of hire includes the degree of employee fit with the organizational culture and the readiness to assume job accountabilities. Quality of hire is typically determined by several variables:
1.Key experiences related to the job responsibilities
2.Evidence of past performance
3.Competency assessment of both baseline and differentiating competencies
4.Adaptive learning skills
5.Personality variables measured by validated assessments
Quality of hire may vary greatly based on the sourcing of candidates. If successful, measures of quality of hire will help predict both the starting point and shape of the learning-value curve. Employees with key differentiating competencies as assessed in solid recruiting and selection methods will reach TFP more quickly and efficiently.
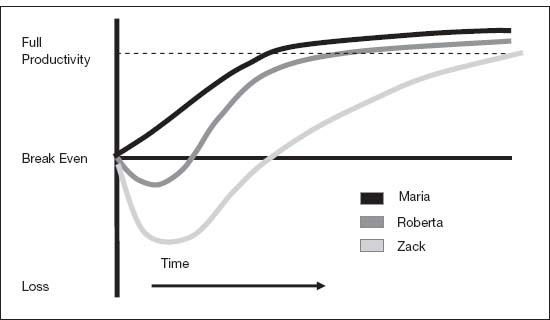
Consider the learning-value curves of Roberta and two other employees, shown in Figure 5.7. Maria enters the freight team associate position with three years of experience in distribution, strong interpersonal skills, and technical competencies related to inventory control and related software applications. Clearly, her learning-value curve starts higher and she reaches full performance sooner. In contrast, Zack is a recent technical college graduate with little work experience and competency deficits in planning and organization. Zack will require more training and closer supervision, thereby extending TFP. A proactive assessment of quality of hire will yield information to guide development strategies aimed at increasing value of human capital.
Quality of hire also creates a compelling financial case for differentiation of compensation based on capability relative to TFP. If a new hire’s TFP is three months faster than a colleague’s, then significant differences in pay at job entry may be justified. Reaching full performance criteria indicates that the initial investment in compensation has paid off and a raise is justified.
Figure 5.7. Comparative learning-value curves.
Performance Metric 3: Quality of Promotion
As the throughput in the distribution center increases, the demands on the original inventory control systems increase substantially. The number of hand scanners needs to be augmented, updates on pricing structures need to be more streamlined, and articulation with existing ERP infrastructure needs to be updated. It is decided, based on financial analysis, that an investment in a system upgrade is warranted. New system parameters are created and upgrades are installed. The result is increased capacity, accuracy, and efficiency of the inventory control process.
When we think of Roberta’s return on investment for Sundance, a system upgrade is analogous to a promotion for Roberta. As a human system, Roberta increases her capacity to produce value to a point where it makes financial sense for her to manage the action and priorities of others. A promotion is a sort of system upgrade that enables Roberta to influence and direct a broader bandwidth of actions within the distribution center. By providing feedback and support, delegating tasks, and improving processes in ways that impact many others, Roberta has the opportunity to have an exponentially greater impact on ROI.
It is well established that one of the most challenging events in career progression is to move from an individual-contributor role to a supervisor role. In addition to increased accountability, an employee moving into a role as supervisor must shift from a reliance on technical, administrative, and functional competencies to command and managerial competencies. In many cases, new managers may be supervising employees who were formerly peers, significantly challenging their motivation and courage. It is not surprising that many employees struggle or fail in this transition. The process of developing management competencies can be enhanced by training, coaching, and consistent feedback.
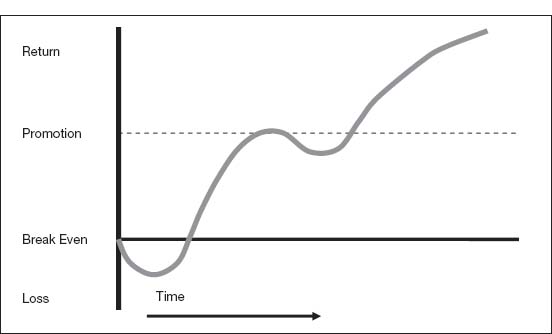
Quality of promotion depends on new investments in human capital. Before exponential ROI can be realized, a promotion typically results in a dip in the learning-value curve. Cost of salary and benefits also increases with promotion. This new level of investment will create a dip in Roberta’s learning-value curve, as shown in Figure 5.8.
At the beginning of her promotion process, Roberta’s immediate performance may be impacted by transition issues, need for new supervisor training, or a need for advanced technical training. It will be a matter of learning and integration with time before Roberta’s new potential as a supervisor provides a return on investment. If the promotion is successful, not only will Roberta’s learning-value curve increase but also her newly developed competencies will impact the productivity of her direct reports, as well as the other systems and processes she influences in the distribution center.
Figure 5.8. Roberta’s learning-value curve through promotion.
With increased potential for ROI of a promotion, there is also increased risk for loss. All of the characteristics of increased influence on people and processes also increase the opportunity for compounded losses. Poor decision quality, inability to manage conflict, lack of organizational savvy, or ineffective communication skills can have a devastating effect on performance, leading to loss of human capital ROI. Any behavior that leads to employees’ being less engaged and committed to their work can have a far-reaching impact on productivity. Any leadership behavior related to a productive employee’s leaving the company results in a substantial loss of human capital investment. These possibilities suggest that leadership potential might be evaluated through assessment tools prior to the promotion. A manager’s estimate is not always the most valid or reliable assessment tool.
Performance Metric 4: Quality of Separation
If Sundance’s inventory control system was to fail for any reason, the economic impact would be sudden and potentially catastrophic. Orders would not be filled quickly and accurately, customers would not receive shipments on time, and the credibility of Sundance in the competitive market would be shaken. If a failure or a disruption in the inventory control process was to take place, there would be a careful analysis of the failure and immediate action would be taken to restore the system to full operating capacity.
If Roberta was to leave her job for any reason, there would also be an immediate economic impact for Sundance. Key information about customer accounts and projects would not be available and immediate activity on her day-to-day accountabilities would cease. Eventually other members of the freight team would compensate for her absence. There would be workarounds, and redundancies in training and experience in the freight team would pay off. Because the economic impact of Roberta’s departure would be less immediate and systemic than the loss of the inventory control system, Sundance’s response to the loss of this asset may be less focused and intentional.
This is a profound oversight, in that loss of human capital can have an immense impact on economic return. Because this return is not managed and measured actively, the extent of the economic impact is not known. Therefore, the fourth key metric of ROI in human capital is quality of separation. When an employee like Roberta leaves an organization, ROI in human capital is potentially decreased in at least five ways:
1.All potential for that employee to add economic value from his or her direct action ceases immediately.
2.All investment in training, on-the-job experience, and internal network creation is lost.
3.A new investment will be made in replacing the employee if the organization is to sustain productivity or grow.
4.There is risk to profitability through breaks in customer relations and loss of potential revenue streams.
5.The employee may go to a competitor, taking valuable intellectual capital and client relations with him or her.
Intangible costs of separation include the impact on other employees’ morale and productivity.
All organizations have some degree of turnover. Excessively low turnover is not necessarily good from a performance standpoint. Not all separations result in net loss of human capital. The quality and reason for separation are critically important. If a person is fired from his position owing to poor performance or unacceptable behavior, this may be a short-term loss in the cost of replacement. In the longer run, it is a benefit. Poor-performing employees fail to return value and they absorb capital that could have been invested in employees with stronger potential.
If Roberta leaves for issues beyond the company’s control, such as needing to relocate, family issues, or retirement, there is little the organization can do. For example, Roberta might need to leave her position in the distribution center because she has to take care of an ailing parent in another state or she wants to return to school. An involuntary separation of this type is a loss of human capital, but it is the natural cost of doing business.
Analysis of separation from a quality perspective is critically important. Voluntary separation is the highest leverage point for loss of ROI on human capital. Individual separation cases may have a large impact even when overall retention rates are high. Failure to systematically track the frequency, quality, and drivers for separation can lead to significant mismanagement of human capital.
Of course, to this point, our metrics have looked at productivity from the perspective of the organization. We have not carefully considered Roberta’s motivation and drive to reach full productivity. We will consider this in detail next.
The Role of Line Leadership in Human Capital ROI
One of the limitations of a human capital investment strategy is that it is often determined by the HR function. While a focus of expertise and experience is necessary to create sound development practices, the accountability for human capital ROI has been shifted away from the people who can have the biggest day-to-day impact on performance—line managers. If people development is seen as someone else’s task, it is unlikely that managers are going to prioritize people-development processes. Moving human capital performance metrics into the realm and accountability of line managers will result in a realignment of this priority.
For instance, if Maria’s manager is held accountable only for production and quality of output, contributions to human capital in the form of training, feedback, and development will not receive the same priority as immediate productivity. In contrast, if Maria and her supervisor are challenged to create a development plan for her to get to full performance quickly and effectively, investment in human capital makes sense from both of their perspectives.
Implementing human capital performance metrics also reinforces a systemic view of human capital strategy. The data used to measure time to full productivity, value of full productivity, quality of hire, quality of promotion, and quality of separation require information from across the organization. Each of these measures reflects the collective work of recruiters, hiring managers, learning and development, and organizational development professionals, as well as line managers. Data resulting from these measures have the potential to drive the kind of deep, cross-functional conversations about talent development that can result in effective and sustained process improvement.
Linking ROI in Human Capital to Dollar Amounts
It is a natural tendency in measuring return on investment in human capital to derive a specific percentage of return based on dollar amounts. For example, the training evaluation approach developed by Phillips1 is focused on isolating the impact of learning on financial performance and reporting ROI figures in dollar amounts. The four performance metrics defined in this essay have the same potential with specific limitations.
Isolating the impact of any particular variable on financial performance in a highly complex business environment is difficult. For example, TFP, or the attainment of a specific competency profile by freight team associates, could be correlated to quality and productivity measures for the entire distribution center. If a supply line shuts down for some unrelated reason and halts distribution of a large volume of product, human capital variables could be largely irrelevant to the center’s overall drop in performance.
Time to full productivity, value of full productivity, quality of hire, quality of promotion, and quality of separation offer some opportunities to place dollar amounts on the cost of or return on events within human capital investment. For example, the replacement cost of a high-quality employee can be figured in approximate dollar amounts by adding the direct and indirect costs associated with hiring, training, and onboarding a new employee. Estimates of 75 to 125 percent of annual salary may be conservative if costs to rehire and lost opportunity costs are included.
A Call to Action
Facing a downturn in the current economy, Sundance’s leadership has been forced to make challenging decisions about managing costs. Share price is tanking, and there are immediate pressures from Sundance’s board of directors to cut operating budget. Knowing that the capital investment in the inventory control system is a sunk cost, and that cost is being depreciated, it makes little or no sense to eliminate any investment in the inventory control system. Because the salary, benefit, and training costs associated with Maria are expensed and Sundance’s total spend for human capital is approximately 60 percent of operating budget, it is far easier to justify terminating Roberta as an opportunity to reduce expenses. This decision-making process is currently being repeated across the globe.
There is little doubt that downsizing is an inevitable part of an economic downturn. It may be impossible for a business to stay intact if it cannot meet cash demands for payroll. At the same time, executive leaders who make decisions about headcount reduction based on an expense perspective of human capital rather than an asset perspective are perilously endangering the future growth potential of their organization. Recognizing that human capital as an asset requires time to build capacity and value, making decisions to reduce headcount without accounting for the commensurate investment in restoring human capital when economic conditions change indicates a lack of financial rigor that would not be accepted with investments in tangible assets.
In response to this challenge, three specific opportunities emerge:
Opportunity 1: Define consistent human capital metrics. Develop specific processes and procedures for defining full performance for jobs or job classes, and determine net contribution for an employee who is operating at full potential.
Opportunity 2: Define human capital management strategies. Define human capital management strategies that yield the greatest impact on reducing time to full productivity as key leverage points for increasing ROI on human capital.
Opportunity 3: Analyze separation data as an asset loss. Separation of productive employees represents a profound loss of human capital and severely impacts the potential of future returns. Risk analysis on head-count reduction should be conducted, with the same finical rigor as decisions on any other capital investment.
I am currently working on each of these opportunities. If you have interest in collaborative efforts to develop these, additional information is available at matchpointcoaching.com under the Human Capital Analytics tab.
Note
1.J. J. Phillips, Return on Investment in Training and Performance Improvement Programs (Houston, Tex.: Gulf Publishing, 1997).
THE TREASURE TROVE YOU ALREADY OWN
Robert Coon
Capital-intensive industries make extensive use of statistical analysis regarding structural issues. They recognize that their cost structure can be effectively managed through the utilization of predictive analytics. However, on the human side—which makes up 15 to 30 percent of their operating expense—analysis is virtually unknown. Here, I apply the value of predictive analytics to the transportation and logistics industry. In two examples, I point out how, just as the company analyzes its structural costs in an effort to be competitive, there are human capital variables that also affect competitiveness and profitability.
Predictive Analytics from Existing Data
Predictive measurements are mandatory in any resources-dependent industry today. Extensive “use statistics” are commonly collected in the transportation industry to determine future consumption needs. Operating resources must be anticipated and ordered far in advance: Fuel futures are purchased six months in advance; replacement tires are stockpiled per usage projections; lubricants and spare parts are preordered to anticipate maintenance schedules.
How, then, is it that the transportation industry, by and large, is not using similar processes to analyze and predict the acquisition, utilization, and replacement of its most important resource—its employees? Why hasn’t this industry adopted similar predictive metric processes for human capital?
The first user resistance to metrics always begins with, “But our company hasn’t collected any human capital data, so how can we even begin?” The more positive approach is to realize that the company is sitting on top of many more data than it will ever need to start the metrics process.
Compile the Data
Start with the many information fields usually contained in the current human resources information system, or HRIS. Standard within PeopleSoft/Oracle, SAP, or almost any other personnel system available today are collection fields on hiring and placement, promotion and assignment, termination and outprocessing. Used (and could be used) data fields are available to record a broad spectrum of employment process details.
For example, faced with the current shortage of tractor-trailer drivers nationwide, a large freight trucking firm recently began an intensive campaign to improve its recruiting success. It began by studying why applicants chose to accept its job offer and join the company. The purpose in finding the most effective “attractors” was to better the recruiting process. At the same time, experiencing constant turnover among its current drivers, it also needed to know what factors would better help retain its best qualified employees. Here, the purpose was to identify the most compelling “retainers,” and the corollary was to learn if the “attractors” were related to the “retainers.”
Delving into the personnel database for its current employees, this company found that it already had many data points to consider, including job information (position titles, levels, job groups) and assignment data (location, shifts, typical runs). Its HRIS contained personnel background data (education, prior experience, skill levels), as well as individual differentiation factors (age, sex, EEO class) as examples. The HRIS also recorded similar information on all terminated drivers, plus remarks on their expressed reasons for quitting—data that could be completed or expanded by supervisory records and notes.
Interestingly, the staffing department had similar information in its applicant tracking system (ATS) on drivers who had turned down employment offers, including their expressed reasons why. In addition, there were driver-satisfaction and commitment data collected by the employee relations department as part of its periodic employee surveys. All this information had been in the HRIS for years before anyone thought to use it.
An initial review of the data led to several interesting findings and predictions. For example, newspaper advertising for driver positions was found to be costly and ineffective. The data projected that job availability was better advertised by posters displayed at interstate truck stops, job signs placed in front of freight terminals, and increased word of mouth through employee referrals.
Interpret the Data
Now the challenge changes from what data you have to what information you need to fill in the gaps in knowledge. In this example, from statistical analysis of the already available information came a formulation of two additional sets of desired data. The first was specific hiring questions that could be answered by truck drivers who had recently accepted or rejected employment offers. The second was more detailed retention questions that could be answered by drivers who had been with the company for eighteen to thirty-six months. Incidentally, this time frame was found in the initial analysis to be a driver’s most critical decision period about continued employment with the company.
The supplemental data led to other interesting findings and predictive factors. For example, availability of new trucks played a bigger role in job offer acceptance than previously believed. Likewise, future wage progression was more important to drivers than starting pay levels. Beyond that, company stability was even more important than compensation. Now, instead of management’s gut feelings about what were employees’ decisional factors, there were valid and relevant patterns, clearly identified and later applied to recruiting and compensation plans.
As more and more data points are added to your existing findings, you will find new statistical relationships and predictive correlations. After implementing the actions predicted by this company’s analysis, the results flowed directly and positively to the bottom line. Specifically:
![]() Recruiting methods became more effectively targeted.
Recruiting methods became more effectively targeted.
![]() Applicant flow increased by 25 percent.
Applicant flow increased by 25 percent.
![]() Hiring costs were reduced by one-third.
Hiring costs were reduced by one-third.
![]() Key employee retention increased over 12 percent.
Key employee retention increased over 12 percent.
![]() Turnover was reduced by 48 percent in the first year alone.
Turnover was reduced by 48 percent in the first year alone.
Perhaps even more important to the growth and stature of this human resources department, the same analysis was requested by the engineering and operations departments of the trucking company for their hiring and retention programs.
The Memphis Experience
Memphis, Tennessee, heralds itself as the “Distribution Capital of the USA.” This thriving city is at the crossroads of several key interstate highways and cross-country rail lines. The Memphis Airport is the home hub of Federal Express. Now every national transportation, warehousing, and distribution company has a presence in this greater metropolitan area.
In the many square miles between the airport and the back of Elvis Presley’s Graceland, an immense industrial warehousing complex grew up in the past decade. Street after street is now filled with brand-new, gigantic, single-story warehouses. Each is an attractive modern building, each is neatly landscaped, and each has a HELP WANTED sign planted in front. Each offered the same per hour starting rate for warehouse workers, and each found itself competing for the same applicants in a shrinking labor market. By the mid-1990s, Memphis was running out of distribution workers.
A while back, a billion-dollar global logistics firm located in several of these warehouses recognized the immediate need to take a more pro-active stance. Its question was, “In the sourcing, hiring, and onboarding process, what were the common factors shared by our best performing employees?” To answer this question, the HR staff sought to discover actionable correlations among recruiting sources, hiring methods, selection processes, and employee performance.
In any standard process analysis, there is an input, a throughput, and an output component. In this case, the output of the best employees could be identified by the most recent performance appraisals recorded in the HRIS. Likewise, the input of recruiting sources was recorded on the ATS, while the throughputs of selection methods and onboarding were found in employee record jackets. Again, this process started with personnel data already on hand, just waiting to be utilized.
The Buried Treasure
There were several interesting and unexpected results of this analysis, which led to some dramatically effective process changes. For example, the input process review found that:
![]() Most of the best performers had been working at other companies in the immediate area when they applied for work there.
Most of the best performers had been working at other companies in the immediate area when they applied for work there.
![]() Most warehouse applicants would not travel great distances to get to work.
Most warehouse applicants would not travel great distances to get to work.
![]() The applicants learned of job openings primarily through signs on the building or from employees, not from newspapers or magazines.
The applicants learned of job openings primarily through signs on the building or from employees, not from newspapers or magazines.
![]() Good employee benefit plans were key to the applicants’ decisions to change companies.
Good employee benefit plans were key to the applicants’ decisions to change companies.
The throughput process review found that:
![]() Good warehouse applicants preferred to be interviewed in person rather than filing online applications.
Good warehouse applicants preferred to be interviewed in person rather than filing online applications.
![]() The informal warehouse setting where the applicants would be working was a stronger recruiting location than formal off-site job fairs.
The informal warehouse setting where the applicants would be working was a stronger recruiting location than formal off-site job fairs.
![]() The applicants usually filed their applications late in the afternoon—that is, just after or before their work shifts at other area employers.
The applicants usually filed their applications late in the afternoon—that is, just after or before their work shifts at other area employers.
![]() The most effective interviews were conducted by hourly lead employees rather than salaried supervisors.
The most effective interviews were conducted by hourly lead employees rather than salaried supervisors.
The Actions Taken
In response to these findings, HR began a new recruiting program centered on the theme, “How would you like an exciting place to work, with great benefits, right in your own neighborhood?” This question appeared on a large billboard near the entrance to the industrial park and was repeated on flyers posted in all nearby restaurants, diners, and stores. Informal open houses, complete with warehouse tours, personal interviews, and even some snack food, were scheduled for Tuesdays and Thursdays from 3 PM to 7 PM to catch every day or afternoon shift change in the area. Lead employees were trained in interviewing and were provided question templates. A special employee benefits information packet was prepared for all attendees.
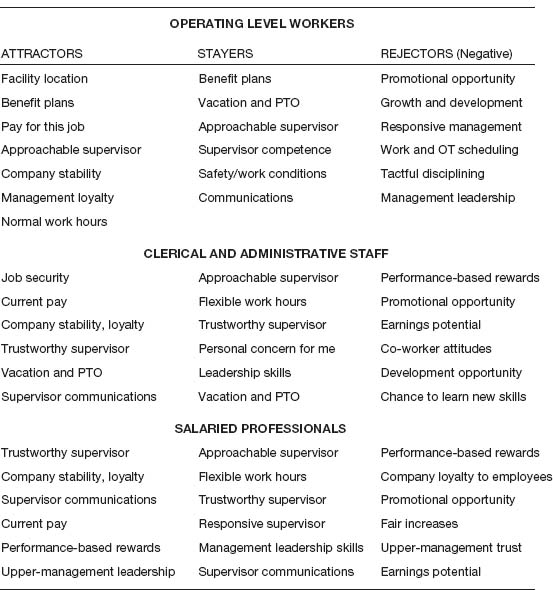
Figure 5.9. Reasons employees stay or move on.
Within the first two months of these process changes, applicant flow increased over 20 percent, as had acceptances of job offers. Even more impressive, and as predicted, after the next review cycle, high-performing new employees had increased over 35 percent.
The message here is that data mining can be accomplished by your company, just starting with the treasure trove of data you already have in HRIS, payroll, and related systems. Using process analysis and distributive statistics such as discussed previously, you can begin to develop similar predictive metrics for the human capital in your company. In this constantly changing and ever-challenging business world, you cannot afford to pass up analysis of your treasured data.
Another Experiment
During this same period, HR conducted an extensive study of why people joined, stayed, and left. Figure 5.9 on page 173 summarizes the results.
As the figure shows, the general finding was that applicants are attracted by one set of factors, stay because of another, and leave for a third. From these results, one thing is clear: Although there are tendencies dependent on position level, there is no universal reason for joining, staying, or leaving an organization. However, it is also clear that, with a bit of data organization and analysis, you can make significant, trend-changing decisions regarding your own organization’s hiring and retaining of talent.
WAKING THE SLEEPING GIANT IN WORKFORCE INTELLIGENCE
Lisa Disselkamp
There has never been a wider gap between what is possible and what is practiced in workforce management than there is today in the area of time and labor data. The tools exist, the data are within reach, and the audience is primed for improving the use of intelligence about workforce performance and cost. Yet there is a significant disconnect among these three components, leaving the potential for improved workforce intelligence sitting dormant. Can employers be rewired to use the power of data analytics to improve their management of human capital?
Employers have been collecting and reporting information about their workers for ages. The origins of payroll and accounting, bookkeeping, and paper and coin currencies can be traced to the beginning of civilization and have evolved slowly over time to what we have today. Although the practice probably dates back many thousands of years, the earliest disbursement records still intact are stone tablets from Athens dating to 418 BC.1 Fast-forward to the end of the nineteenth century and we have the first mechanical devices for collecting workforce information—time clocks. These time clocks offered employers advancements in efficiency and accuracy, but the devices themselves were transactional, not intelligent. Time-clock technology remained relatively stagnant for nearly ninety years.
In the late 1970s, the first intelligent time-clock device was born when Mark Ain put a microchip into a time clock. During the last thirty years since then, there has been a rapid progression of new technologies to collect work-time data and develop the computer systems that support these technologies. Features in these devices now validate data, integrate the data with other business systems such as scheduling and accounting systems, and share the data across wireless networks from remote locations—all means that have dramatically enhanced the employer’s ability to obtain accurate, meaningful, and timely information. Today, work-force management systems have evolved into sophisticated, intelligent, real-time business tools.
Workforce management systems have been transformed from processes for collecting and reporting information about workers and costs to tools for analyzing, reacting to, and improving how the workforce is managed. The latest additions offer management the ability to forecast and strategize how to effectively deploy and compensate people. But the key word here is offer. While software and hardware vendors have produced these powerful analytical tools, and with limited success have sold them to their customers, there remains a chasm between what is available and how it is used.
Opportunities Lost, Technologies Not Used
Outside the functional business units that own workforce management systems such as timekeeping, leave and attendance, labor scheduling, and payroll, people are becoming increasingly accustomed to the benefits of business intelligence and predictive analytics. In operations, managers follow lean methodologies that use production and quality data. Retailers and call centers employ sophisticated traffic modeling to guide them in decision making. An entire industry has developed around analytic tools for the financial markets so that anyone can access market data and trade investments from home. Every day, consumers are receiving their utility bills presented in graphic formats that show usage trends over time. And finally, advertisers and politicians alike use charts and statistics to support specific messaging being sent to their audiences. It is evident that people are familiar with the symbols of technical analysis, believe in the science of data collection, and often rely on data and signals to make important decisions.
However, within the realm of workforce management processes and decision making, predictive analytics is slow to be adopted. Companies resist at a variety of levels to transition toward methods of analysis, decision making, and control that are based on the collection and assimilation of meaningful information about their people. Perhaps one of the most glaring examples of this resistance is labor scheduling. The industry today boasts many sophisticated and interactive scheduling products that allow companies to apply the principles of supply and demand, cost containment, and employee satisfaction to their staffing process. Yet senior-level executives worry about its cost-effectiveness and front-line workers require talking points and cultural reprogramming to allay their fears and avoid “technology mutiny.”
On average, companies spend 36 percent of their revenues on human capital expenses, but only 16 percent of them say they have anything more than a moderate understanding of the return on their human capital expenditures.2 In other areas of time and attendance, despite strong suspicions or evidence that there is room for improvement, most employers neglect embracing the power of analytics. Yet, there are technological solutions to common workplace problems.
Punch Clock Abuses
A prime example of a common problem left unsolved is the neglect of methods to monitor and influence employee behaviors around reporting nonworked time (or paid time off), or punch-rounding abuse. The data can be easily analyzed and controls within the timekeeping system can be designed to influence and curb these behaviors.
We evaluated a sample of employee punches at one employer and found a significant spike in punches right at 00:23 minutes. For the minutes leading up to 23, punch activity showed a noticeable decrease. At 23 minutes, the employees’ time was rounded up to the half-hour mark, and hence, they gained 7 minutes of paid time. When we looked at the individual employees and found many who consistently punched every day right at 23 minutes, that finding proved that employees were gaming the rounding rule to gain the 7 minutes every time they punched out.3
Figure 5.10 represents how employees at the organization were abusing the punch-rounding rule across the board. Hourly workers took advantage of the rounding rule that rolls the time forward to the next quarter hour. Employees punching at these “change points” (8, 23, and 53 minutes) gained 7 minutes per punch. The dark bars represent employees who punched at the change point and gained 7 minutes of nonwork paid time; the light bars represent employees who punched right before the rounding occurs. The difference in the two shows how employees are waiting for the change point in order to gain the 7 minutes of paid time.4
Figure 5.10. Abuse of rounding rule.
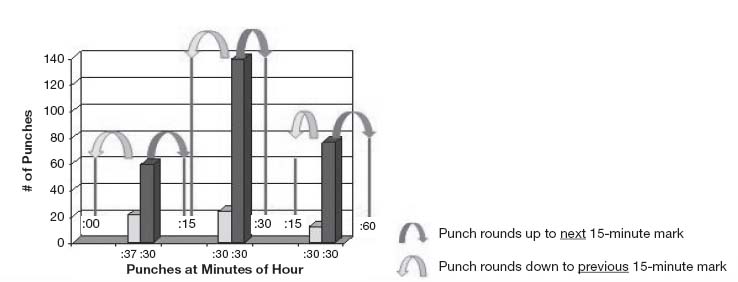
Source: Client-based research by Athena Enterprises, 2009.
Of course, it can be argued that this rounding mechanism works to the company’s advantage as well. Employees’ time can be rounded down in a way that shaves minutes off what they have worked. In theory this may be true, but only for the computer. People aren’t computers, and they quickly learn how to “work the clock” to their advantage, and they do so with abandon. The cost of this unmanaged “leakage” quickly adds up. In fact, industry estimates place intentional and error-driven time theft in the range of 1.5 to 10 percent of gross payroll, costing U.S. businesses hundreds of billions of dollars each year.5
Many workforce management technology implementations suppress—intentionally and unintentionally—the deployment of the most powerful features in deference to the demand for “on time and on budget” project objectives. When business leaders seriously consider what they are potentially missing without analytics, they will demand that someone answer the questions: What are we missing? and, What areas of our business lack tools or strategies to drive improvements?
The answer to these questions is active time and labor intelligence, and full usage of the available time and labor management tools. For this employer suffering the punch-rounding abuse, the solution was to turn on the system to flag the abuses (reporting late arrivals and early departures, especially those near the change point), to restrict the most flagrant violators (configuring clocks to prevent frequent rounding abusers from punching in early or late), and to produce desired behaviors and outcomes (reducing the number of employees who gamed the rounding rules and decreasing the amount of money spent on rounded time not worked).
This example demonstrates the power to capture, predict, and influence employee behavior, ultimately saving the organization money and increasing productivity. In this case, analytics allowed the owners to hone in on the problem, measure the impact, and improve performance.
Overtime and Absenteeism Problems
Two other examples of underutilized analytics relative to time and labor management are found in the areas of overtime and attendance. Overtime is often dealt with as a stand-alone figure managed in reactionary mode—a set dollar amount or a percentage of total hours—or subju-gated to the demands of production. Supervisors are simply told to “keep overtime in check.” An intelligent, holistic approach to controlling overtime, while balancing the demands of operations, isn’t possible without effective analytics.
Few organizations track on their balance sheets the cost of absenteeism arising from the direct and indirect costs of dealing with workers who don’t show up for the day’s work. The lack of measurement of this workplace malady demonstrates that, despite having systems that easily track work activity, mature policies around absence benefits and processes, databases with the requisite cost values and totalizers, and a subtle acknowledgment that there is a cause and effect, applying a scientific methodology to managing the impact of attendance and overtime is far from routine.
On average, employees take 1.25 extra days of leave time per year. This is equal to 0.48 percent of total payroll.6 The good news is that both overtime and absenteeism can be successfully managed when labor analytics are part of the solution. Further, improving either will have a positive impact on the other, as there are correlations between absenteeism and overtime.
The most basic forms of intelligent workforce management deliver data that notify managers about employees who are approaching overtime, and they rank employees by their hourly rate or total hours worked when replacement workers must be called in. Further up the maturity curve, workforce analytics allow managers to zero in on trends in overtime and the root causes of excessive hours, so that action can be taken to resolve the problems. This is accomplished in a variety of visual formats—data tables, bar charts and graphs, detailed reports for drill down, and trend alerts (arrows, buttons, and automated e-mails). One product, for example, alerts the user when hour milestones are reached, and it allows them to quickly drill down into the specific group, time, and events that have led up to the overtime situation. The analysis can easily draw a line directly to a cause, such as high absenteeism or unexpected demand.
These systems are also integrated with other business systems and they relate workforce activity to key performance indicators, such as production volume and quality of equipment delays. For the first time, there is a convergence of the human capital side—what is known about people and labor cost (HR and payroll)—with the operations side, or what is known about output, workplace rules, and revenue. The result is a new, comprehensive understanding of the human capital factor in a business.
Over time, the findings are built into better planning and faster reactions to ensure that a business more successfully meets the demands of production at lower cost. This is the purpose of workforce intelligence: learning more about the real-world relationships among people, the work, and the result. It’s not just providing more knowledge of what has happened or is happening, but additionally offers a greater ability to be prepared and to realize the outcomes that are desired—this is the mission objective of labor analytics.
Future Applications
What is so special about workforce intelligence? Today’s labor analytics peel back the relativism that exists in labor management decision making and processing. Our time and labor management analytics deliver an assessment of critical, real-time business information that is objective, factual, and aligned with short- and long-term organizational objectives. Analytics also uses statistical analysis to make raw data meaningful and relative. While production and financial areas have long been using these techniques, the labor area has not been truly addressed. Now that the data are available, quantifiable, and relatable, the tools can be applied to human capital. The challenge is for people to be willing and able to adapt to these methods.
Workforce analytics technology has arrived; systems are available and ready to run. Its applicability is indisputable in the absence of any competing methods for capturing and leveraging workforce intelligence. However, its power remains in large part hidden under a blanket of institutional habit, skepticism, and neglect. Aside from Dr. Jac Fitz-enz, where are the academics conducting scholarly research into the potential uses of these tools? Too few business leaders are clamoring for more intelligence about their people. What must come next is an acknowledgment of this frontier and fervor for its exploration.
I predict that professors, researchers, and thought leaders will begin to develop a body of knowledge around the new data and their applications in the workplace. Practitioners can support these efforts by spreading the word about their successes to help other businesses understand what is involved in making the transition to this new way of managing their business. Each of us can draw on our use of similar sciences to improve our use of equipment, supplies, and finances to help us acclimate to this new environment relative to people.
Employers seem hesitant to embrace the new technology. Yet, when they do, they will find that the tools are a natural device for overcoming the negative effects of managing people with processes that have been mostly relationship based, home grown, and intuitive rather than scientific. Rewiring our people management methods will transform our organizations as we take analytics into action and position time and labor management technology as a proactive, forecast-based tool for managing the workforce with intelligence.
Notes
1.Lisa Disselkamp, No Boundaries: How to Use Time and Labor Management to Win the Race for Profits and Productivity (Hoboken, N.J.: John Wiley, 2009), 285–86.
2.Mercer Human Resources Consulting and CFO Research Services, 2003, [H22107]NB, p. 59.
3.Disselkamp, No Boundaries, 115.
4.Ibid., 116.
5.Acuity Market Intelligence, Biometrics: High-Value Workforce Management—The Critical Role of Biometric Time and Attendance to Workforce Management Solutions, white paper, February 2008, p. 116.
6.Nucleus Research, G45, July 2006.