The New Face of Workforce Planning
“Strategic planning is worthless—unless there is first a strategic vision.”
—JOHN NAISBITT
Until the late 1980s, workforce planning was a common activity. But with the layoffs starting in 1989 it disappeared for a dozen years. Just as we came out of the recession of the early 1990s, the dotcom mania struck. There was no way to plan in that feeding frenzy. Workforce planning was viewed as passé in the short period during which vast sums of venture capital were thrown at unsubstantiated proposals. It wasn’t until around 2005 that workforce planning resurfaced, as management realized how essential it was, especially with the talent shortages exacerbated by an unpredictable, rapidly changing global market.
The challenge now is how to make workforce planning effective today. Because of the high level of market volatility and the risk of bad decisions, we need as much insight into the future as we can assemble. Think back to the technological capabilities that existed in 1990. For instance, there was no Internet for collecting and sharing data. The PC software was not nearly as robust as it is today. The cost of computer memory was perhaps 100 times more than it is now. In short, we had rather basic tools at that time, even if we didn’t recognize that.
The risk level that businesses faced was much lower twenty years ago, too. Globalization was just a word, and Chinese, Indian, and the Middle Eastern economies were a fraction of the size they are today. Japan was a dominant economy about to fall into a ten-year recession. Labor in the United States was readily available. In fact, we had more managers than we knew what to do with, so over the next five years we laid off a couple million of them. We thought we were busy then, but it was more a matter of managing a recession than trying to compete on the global stage.
Human Resources Versus Human Capital Planning
Strategic workforce planning is more than annual stargazing and budget building. By definition, it is a complex process that addresses both short-and long-term issues. Most important, and a characteristic that is sometimes ignored, strategic workforce planning is only as good as the operating model on which it rests. Absent a consistent, comprehensive, integrated model, workforce planning is bound to be suboptimized. We can’t construct a complex modern building without architectural drawings, and we can’t build a solid business today without a management model.
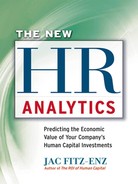
Models are common in organizations. Production has a model for managing material and processes. Finance has a model for managing cash flow. Marketing has a model for managing customer relations. Information technology has a model for delivering data and intelligence. However, human resources’ traditional “operating model” can be compared to the man who jumped on his horse and rode off in all directions. We have thrown one solution after another in an uncoordinated, inefficient attempt to respond to the latest crisis; we have always been behind the curve—and consequently, we have seldom been creating competitive advantage with our HR efforts. HR people wonder why they are not respected, but let the record show that their track record has been far from stellar. Human resources—and by extension, C-level executives—need a model and a plan that shows the total scope of the problems as well as the opportunities. They need the tools for putting out today’s fire and, as important, preventing tomorrow’s conflagration. Now, they have it.
HCM:21, or the new HR model, is shown in Figure 4.1. This management model for human capital development is an integrated, comprehensive approach that aligns each HR function with the business vision, values, and plan, as well as with each other HR function.
A Small Case in Point
When I founded Saratoga Institute in 1980, I had a clear vision and a particular model in mind. The vision was to provide objective data about human resources services so that management could make better business and personnel decisions. The model was to focus exclusively on data collection and management, and pass up opportunities to become involved in recruitment, compensation, or training. This single-minded view of the model stemmed from a story I had read years before.
Figure 4.1 HCM:21® management model.
Two men were having lunch at a Wall Street restaurant when one asked the other, “Who is that man sitting along that wall?”
The other responded, “Why do you ask?”
The first man said, “Because almost everyone who has come in has gone over to talk to him.”
The other said, “That is Mister Brown. People talk to him because he knows more about municipal bonds than anyone else.”
The lesson for me was this: If I could focus my resources on becoming known for my deep knowledge of an important topic, people would want to talk to me. It is like the old saying, “Build a better mousetrap and the world will beat a path to your door.” Adhering to my vision and sticking to my model led me to develop a worldwide reputation for measuring human capital management (HCM) that endures to this day. I recount this not to boast but to make the point that if you see an opportunity, and you build a vision and model around it, you will generate a competitive advantage that will be difficult for others to upset.
The Why of HCM: Capability Planning
Is it possible that HCM can be integrated with all aspects of today’s constantly changing business initiatives? The answer is not that it can be, but that it must be. Yet, HCM can be integrated only if we think beyond HR processes. We must initiate a broad study of the marketplace, using advanced analytic tools to operationalize a new strategic model. So often we get lost in a problem, unable to see outside of it. This leads to patchwork, short-term tactical reactions rather than insightful, long-term solutions. Even when we put out the fire, the embers will reignite with the next day’s crisis.
Typically, workforce planning focuses on matching the staffing requirements in business plans with the available labor pool and the expected growth and changes in staff owing to transfers, promotions, and departures of various types. From there, a staffing plan is developed for filling the holes. Unfortunately, quite often there is little coordination or planning between staffing and development. Siloed thinking minimizes the value of anticipating future outputs. This is industrial-era thinking that is essentially nothing more than truncated gap analysis. HCM:21 overrides this, once and for all time by providing the means for capability planning.
With the results of the environmental scan, described earlier in Chapter Three, you can begin to design a capability plan. Note that I have changed the term from workforce to capability. Workforce planning, as I mentioned briefly, is but a gap-analysis exercise. Although it deals with identifiable skills, the thinking is often restricted to filling jobs. But when you move to capability planning, your mindset expands. It goes beyond positions to be filled to building a strategic human capital capability. This might seem like a semantics game, but I assure you it most certainly is not. The lights go on and the energy rises as human resources people grasp the magnitude of difference here.
HCM:21’s capability planning process is a new mental and physical technology. It is mental in that it fosters a different mindset, with the focus on knowledge and skill, not on job descriptions that will soon be obsolete. It is physical in that the operating system includes formulas and materials for carrying out the model in practice. A workbook is available with instructions and spreadsheets for implementing this model. You will find it in the appendix.
With capability planning, the focus is on the success of the organization. Your conclusions and recommendations are driven by the data you collected in the scan and your risk assessment. Remember, capability planning is a live, ongoing program. It doesn’t happen once a year and then shut down, the way workforce planning does. Your organization must function at a high level, no matter what the future may bring.
The Segmentation of Skills
Capability planning starts with skills segmentation. While all people are important, all skills are not of equal importance. Treating the workforce like a monolith is absurd and costly. Instead, subdivide the workforce into four categories, in terms of valued capabilities:
1. Mission Critical. A few capabilities are absolutely key to ongoing success. If you think about it you know what these are. They can relate to technology, leadership, finance, sales, production, or anything else that represents a make-or-break situation. The question is, do you currently have sufficient mission-critical capabilities in place? Do you have backups being developed? This is where you start capability planning.
2. Differentiating. Given your current or desired future market position, which capabilities separate your organization from the competition? These can be unique technical, financial, service, or other skills and knowledge that only your organization has or needs to acquire. These often augment the mission-critical capabilities, but are not identical.
3. Operational. Certain skills are necessary to keep the operation going. These are often characterized as administrative and maintenance, but also include technical skills. At times they are taken for granted or ignored. They need to be reviewed as insurance, as their absence would reduce efficiency, impair timely response to customer needs, and increase operating costs.
4. Movable. As markets, customers, and products change, some skills become less important or even obsolete. Companies sometimes forget this and allow these to remain, causing operational expenses to build. This situation became such a massive problem in the 1980s that American businesses had to lay off 3 million people to regain competitive cost structures. People in these positions need to be retrained, reassigned, or let go, and the processes outsourced, if needed at all.
So, the question is: What new capabilities do you need to acquire or build to meet changing market trends? Changes in technology, customers, market niches, competition, or other forces signal this need to develop new capabilities. At this initial point, you are better able to build the scenarios for planning, acquiring, deploying, developing, and retaining those new capabilities. Scenarios are stories or scripts that spell out potential future events. They can be best-case, worst-case, or probable-case scenarios offering a range of alternatives. In short, if you have several different views of how the future may unfold, you can better prepare for the eventualities.
The Scenarios and the Playbook
In the first essay in this chapter (see page 94), James P. Ware shows how to develop the scenarios and build a playbook for the future needs of your organization. The playbook concept is derived from sports, and the analogy to businesses is straightforward. Don’t wait until the game starts to decide what to do. Depending on the conditions that develop and what your competitors try, you have to have an adaptable plan to carry out before you head out onto the field.
Succession Planning
Executive succession is a great concern for boards of directors, especially since the dotcom crash. Many companies have a senior management cadre that is ill prepared for its responsibilities. Is that the situation at your organization?
According to recent research, companies fall into three basic categories. First are the approximately 15 percent that have the cultural predisposition and systems needed to do succession planning effectively. These companies have a sense of career mobility and internal development. They also vigorously recruit and develop talent in every key area.
Next are the 50 percent that have some sense of a need for succession planning. They have taken a thoughtful approach to filling vacancies when they arise, and typically they engage in some management-development efforts. Last are the 35 percent of organizations where succession occurs largely by default. The companies may be growing too fast, may be financially troubled, or otherwise may lack the common sense or resources that effective succession planning and management development demand.
If these estimates are accurate, then approximately 85 percent of companies fall short in their efforts to deploy full, proactive, succession-planning programs—a problem only likely to grow increasingly evident as management and labor pools contract. It is also seen in numerous surveys of employee commitment. Without employee faith in organizational leadership, high turnover rates naturally follow.
Too often succession plans, when they exist, are not up to date and not relevant. The people responsible for succession planning do not always have an eye toward the future. And management development cannot be based on past experiences alone. By the time managers have a chance to put into play what they have learned, the procedures may be two to four years old. Also, managers often fail to recognize that the future seldom follows the forecast.
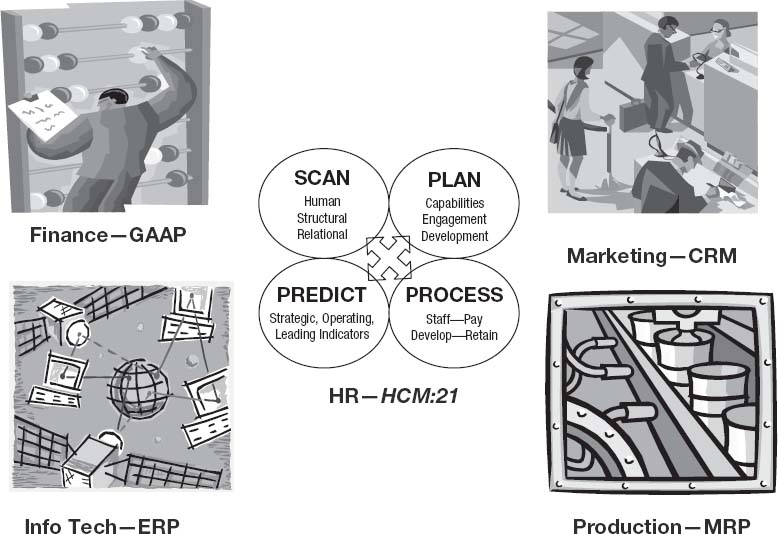
In 2007 and 2008, we surveyed over 1,200 companies regarding their planning programs.1 A highlight of their responses is shown in Figure 4.2.
Our results showed that 54 percent of companies have ready backfills for fewer than 30 percent of their positions while 7 percent have ready backfills for 80 percent of their positions. Also, 54 percent have an active replacement plan for fewer than 30 percent of their positions while 9 percent have an active replacement plan for 80 percent of their positions. Lastly, 58 percent have fewer than 30 percent of positions trained for direct replacement while 6 percent have direct replacements trained for 80 percent of their positions.
The answers to these questions were compared with management practices and correlated with financial results.2 This revealed that the companies that had at least 75 percent of their high-potential (Hi-Po) candidate-development programs fully operational, and where there were replacements ready to step into mission-critical positions, the organizations saw a rise in revenue growth per full-time equivalent (FTE). The explanation for this is that Hi-Pos in mission-critical positions are the leverage that drives overall performance. Figure 4.3 shows that point at which succession planning practices begin to have an effect on revenue growth.
Figure 4.2. Planning practices of surveyed companies—selected questions.
Given these findings, we have developed an advanced succession planning system built around four imperatives:
1. Responsibility. Assign a senior executive the primary responsibility for managing the system. This person must have the organizational power to keep the system on track and people being developed according to the needs of the organization and the prescribed plan.
2. Identification. Identify high-potential managerial and technical personnel as far down the organization as possible. As organizations become more complex, every manager and professional will be delegated greater discretionary power and faced with higher-risk decisions.
3. Design. Develop personal growth programs, and review and update the Hi-Pos’ progress at least annually. Strategic capability implies that these people be exposed to a broad range of on-the-job experiences, as well as formal learning opportunities. Because the market is moving so rapidly, continual review and revision are necessary.
4. Effectiveness. Monitor advancements and their effect on top-line growth and accelerate development where necessary. All development plans link up with the organization’s strategic goals. Development is not about training; it is about sustained capability in the form of people who are intently knowledgeable and focused on purpose.
Figure 4.3. When succession planning affects revenue growth.

Source: Workforce Intelligence Report, 2007.
Although a senior executive is responsible for management of the succession planning system, ultimately accountability must reside with the CEO. It has become increasingly clear in recent years that management succession is a critical driver of sustainability. Despite—or perhaps because of—the inadequate planning that has characterized the past, boards of directors are starting to hold CEOs accountable for ensuring a continual flow of capable executives, managers, and high-skill professionals. Research has shown repeatedly a positive correlation between organizational performance and the CEO’s commitment to management development. In the final analysis, the only corporate resource that matters is people; all other resources are depreciating assets.
Jumping Ahead of the Competition
It is possible to win—or at least be competitive—by getting the jump on the competition in the war for talent. To be proactive in your human capital management, you must:
![]() Have individuals readily available who possess the specific knowledge, skills, and personal qualities needed to assume key positions
Have individuals readily available who possess the specific knowledge, skills, and personal qualities needed to assume key positions
![]() Ensure minimal downtime caused by positions remaining vacant or being covered by someone without the skills or with competing priorities
Ensure minimal downtime caused by positions remaining vacant or being covered by someone without the skills or with competing priorities
![]() Accelerate the time it takes for new persons to adjust to the new positions and/or corporate culture
Accelerate the time it takes for new persons to adjust to the new positions and/or corporate culture
![]() Significantly reduce the risk of costly hiring errors
Significantly reduce the risk of costly hiring errors
![]() Achieve a higher talent retention rate
Achieve a higher talent retention rate
These proactive responses demand a well-thought-out, comprehensive view of the market and its forces. Your capability plans must be current and flexible, designed to move with both planned and unexpected change. The HCM:21 model does this, with its emphasis on scanning the external forces and internal factors that may impact the organization, followed by capability planning that considers the marketplace not only next year but five years out.
Notes
1.Workforce Intelligence Institute (Human Capital Source), Workforce Intelligence Report 2007, 30.
2.Ibid.
HOW TO PUT CAPABILITY PLANNING INTO PRACTICE
The essays that follow deal with scenario building, employee engagement, and paying for performance.
SCENARIO PLANNING: PREPARING FOR UNCERTAINTY
James P. Ware
As the new year begins, most of us are “on edge,” knowing intuitively we’re facing a future that feels more uncertain than anything we’ve ever experienced before. It’s all too easy to become overwhelmed or want to crawl into a hole somewhere and just hibernate until the future arrives—for better or for worse.
Will the economy get better? Or worse? When? How will it affect you personally? How will your job change in the future (if it even exists)? Will your company thrive or struggle? What’s going to happen to health insurance, Medicare, Social Security, climate change? How will terrorism, violent weather, or pandemics affect you personally, and your business? Will corporate profits ever return? Will average wages continue to drop in real terms?
We’d all love to know the answers to those questions and more, but, of course, if you did you would be rich and famous. More fundamentally, how can anyone predict or plan for a future so filled with uncertainty? The truth, of course, is that no one really can—in spite of what pundits claim, the track record of the so-called experts is dismal, especially over the past twelve to eighteen months.
It has been said that “the best way to predict the future is to create it.”1 However, as much as we’d all like to create our own future, that isn’t a realistic option.
Historically, strategic planning was all about focusing your organization’s attention on a particular marketplace and ensuring that you have the operational capabilities to compete effectively in that market segment. Most strategic plans make explicit assumptions about future trends, estimate probabilities, and include educated guesses about what’s going to happen.
However, in today’s highly volatile and unpredictable economy, assuming any kind of predictability in the marketplace can be fatal. Traditional strategic planning is worse than useless when dealing with the uncertainties of today’s economy. Indeed, traditional thinking about the future, as if it were actually knowable, is downright dangerous. Most strategic planning approaches embody several fundamental assumptions that are patently false in the current business environment:
![]() Industry conditions are relatively stable and predictable.
Industry conditions are relatively stable and predictable.
![]() We can extrapolate current trends into the future with reasonable accuracy.
We can extrapolate current trends into the future with reasonable accuracy.
![]() Customers and competitors are well known and will remain so.
Customers and competitors are well known and will remain so.
![]() Competitors play by the same basic rules that have governed the industry and its distribution channels in the recent past.
Competitors play by the same basic rules that have governed the industry and its distribution channels in the recent past.
![]() There is one “right” picture of the future, and it can be predicted by the careful analysis of trends and their underlying drivers.
There is one “right” picture of the future, and it can be predicted by the careful analysis of trends and their underlying drivers.
![]() Strategic planning can be done periodically (typically once a year) as a way to step back from daily operations and be reflective about the future.
Strategic planning can be done periodically (typically once a year) as a way to step back from daily operations and be reflective about the future.
The state of business today shows how totally irrelevant and even misleading those assumptions are. What we need instead is an approach to planning that moves at the speed of the Internet, embraces uncertainty, and prepares the organization to move in several different possible directions, sometimes simultaneously.
As a strategic planner, your task is to sort out which small number of possible futures is most likely to occur and how those alternative futures will affect your organization. More important, you need to develop a range of options (what we like to call a “playbook,” to be described in some detail later in this essay), and determine the skills and resources required to cope with (or to create) any particular future scenario. This essay provides a brief overview of the only way to plan for uncertainty that I have any confidence in: scenario planning.2
Reinventing Strategic Planning
Scenarios are stories about the future that, when taken together, describe a range of plausible future states of an industry, its markets, and a particular business. Scenarios are a tool for dealing with rapid change, uncertainty, and inherent unpredictability. Scenarios are not predictions of the future; rather, they are images of possible futures, taken from the perspective of the present.
Because scenarios are developed explicitly to describe a range of possibilities, they enable managers to open their minds to the inherent uncertainties in the future, and to consider a number of “what if” possibilities without needing to choose and commit exclusively to one most likely outcome. Scenario analysis enables managers, business planners, and executive teams to develop multiple options for action that can be compared and assessed in advance of the need to implement them.
An effective scenario suggests critical implications for a business and contains personal meaning for the people who build it. Scenarios are useful tools primarily because they facilitate—indeed, require—a strategic dialogue about the unpredictable outcome of today’s rapidly changing business environment.
Here’s the way a special report on the future role of the chief human resources officer prepared for the Society for Human Resource Management (SHRM) described the authors’ goal:
In contrast to the SHRM Workplace Forecast, the goal of this work is not to identify or trace out the trends that will likely unfold. These trends inform the scenarios presented here, but the focus in this report is much more on the uncertainties of the future. What is it that we don’t know that could fundamentally change the environment in which we work? How could these uncertainties lead us to very different worlds that will require different capabilities for success?3
In fact, the scenario-building process enables you to uncover and consider near-term developments in your markets that are indicators of the larger trends that will eventually have a dramatic impact on the shape of your industry and your business. Scenarios also help managers envision future states that might seem highly implausible to a naïve viewer. And even if the scenario is implausible on the surface, it can serve to highlight possibilities for action that may someday become absolutely essential to the future of your business, or may stimulate innovation if the future they were created for never comes to pass.
Depending on a well-defined map of what amounts to an unexplored territory can be highly misleading. As a real-life example, here’s a brief history lesson. When European mapmakers in the seventeenth century listened to the ship captains who returned from exploring the western coast of North America, they depicted California as a large island, separated from the western United States by a large unnamed body of water.
Although wrong, their logic was understandable. Sailing past Baja California, the ship captains had reported seeing nothing but water to the north. Then they traveled north in the Pacific Ocean to Seattle, where they entered Puget Sound, and once again they saw nothing but water. Based on their limited experience, it was easy to conclude that California was indeed a large island. The incorrect maps they produced led to incorrect—and sometimes disastrous—decisions by the early settlers of the American West.4
Scenario planning, in contrast, encourages a creative tolerance for ambiguity; and it enables an organization to consider what skills and resources it would need to compete effectively in each of the imagined alternative futures, as well as how it would have to change current practices to survive in that world. Finally, scenario planning provides executives with a sense of what events or patterns to look for as early warning signs that one or more of the projected scenarios might actually be starting to occur. This early sense of how the future is beginning to unfold amounts to a form of “anticipatory insurance.”
Building Scenarios
While there are many different approaches to developing scenarios, my personal preference is to follow a three-stage process. The first step is to identify the most critical and potentially impactful unknowns—the things you know you don’t know now but if you did know would tell you how to make effective decisions today about tomorrow.
The second step is to select two of the most critical of those unknowns—two uncertainties that are essentially independent variables. Each of these two dimensions of the future should have two equally likely but unpredictable outcomes (as far as you can tell at this point; if the opposite outcomes are not equally likely, the variable isn’t really an uncertainty).
Then, once you’ve identified those two critical uncertainties, the third step is to set up a 2 × 2 matrix and look at the four possible combinations. You name them, and flesh them out to create four compelling stories that capture four alternative visions of the future.
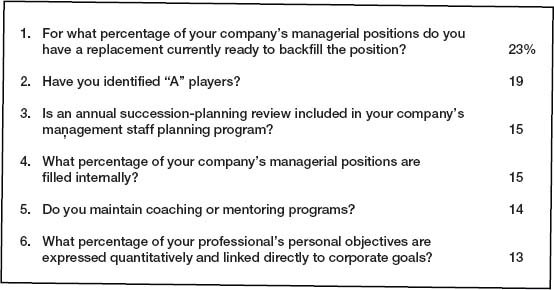
For example, consider this scenario matrix for a project-based engineering company that is highly dependent on government contracts (Figure 4.4).
While this company’s executives can’t accurately predict or adequately control either government spending or the salaries they’ll have to pay to attract and retain critical talent, they can prepare for each of these four possible futures by carefully considering their talent attraction/retention strategies, their business-development activities, and the range of possible macroeconomic trends that will influence both of these variables.
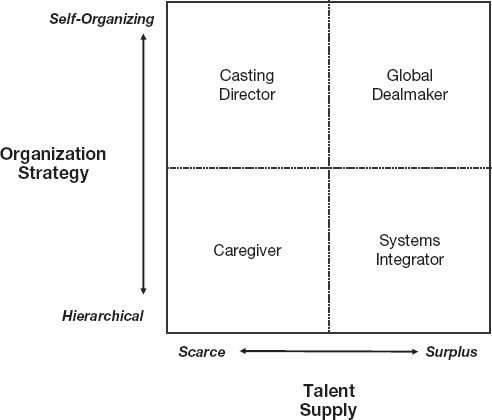
Figure 4.5 on page 100 identifies four scenarios describing very different future roles for the chief human resources officer (CHRO). These scenarios were developed in 2005 by a group of academic experts for the Society for Human Resource Management; the full report presents the four possible roles in greater detail.
In this exercise, the scenario planners selected two aspects of the future economy that they believed were indeterminable:
1.The prevailing kind of organizational strategy, either self-organizing or a more traditional, hierarchical approach
2.The global supply of talent, either scarce or in abundance
The scenario planners then developed four richly described and very different roles that senior HR executives might play in each of the four “worlds” that those two variables suggested. Here, for example, is a brief summary of the “caregiver” future as it was envisioned by the SHRM authors:
Figure 4.4. AJAX Engineering future scenarios.
Terrorist attacks and a desire for protection lead to the return of centralized, hierarchical organizations as companies create the structures needed to attract and retain workers. As the organization serves the role of a “parent,” HR in this scenario is the keeper of the corporate hearth and provider of the many benefits the organization offers.5
Each of the four hypothetical roles for the CHRO is spelled out this way to enable senior executives and HR professionals to imagine the world in which that role would be appropriate. A story like this is far more interesting, and compelling, than a set of dry statistics or a sterile narrative about the projected future conditions, no matter how sincerely the planners believe that those conditions will prevail.
Once a set of scenarios like these has been developed, a strategic dialogue can begin in earnest. Which future scenario is closest to where you are today? Which one will you be in if the key scenario drivers—business trends, regulatory policies, technological innovation—continue their present course? Which “world” would you prefer to be in? Is there anything your organization could do to nudge the future in one direction or another? What new kinds of competitors could emerge in each scenario?
Figure 4.5. Four possible worlds for the CHRO.
Most important, in which direction are the prevailing winds blowing? The real value in using scenarios is in identifying potentially useful strategies for moving your business into a more desirable future. Scenario building enables a type of war gaming well in advance of actual market competition.
From Scenarios to Playbooks
Once you have developed several plausible scenarios, what can you do with them? Scenarios are not an end in themselves, and if misused they can actually increase organizational risk. If you have developed several different but equally credible views of how the future might unfold, you might end up even more overwhelmed than if you had simply been stymied about where things might go. To avoid that, we recommend building a “playbook” containing alternative scripts or action plans for the different futures you have described in your scenarios. We know of several organizations now using playbooks to develop multiple possible strategic moves and to enable rapid implementation of the most potent ones. The playbook approach expands scenario planning into a complete, action-oriented management technique.
The Playbook Concept
Professional teams in most major team sports—especially those in time-based sports like football, basketball, and soccer—have used play-books for years. A playbook contains a series of different offensive and defensive plays that have been developed for a variety of different conditions. An effective playbook takes into account the unique strengths (and weaknesses) of the team; there is one set of plays for the first-string quarterback (who may be a left-handed rollout passer) and a second set for the backup quarterback (who may be right-handed and more of a drop-back passer). Similarly, when the star halfback is in the game, the team will execute one set of running plays, and when he is on the sidelines, there may be a completely different running game in place.
The analogy to businesses developing future-focused strategies is straightforward. Like a football team, you can’t afford to wait until the opening kickoff to figure out what to do; nor do you want to wait until you have only thirty seconds left in the game to figure out how to move the ball sixty yards downfield. Instead, you want to anticipate, develop, and practice (i.e., pilot) a series of possible strategic moves. Then, depending on the conditions that develop and what your competitors do, you can carry out one set of plans or another.
Or, if the competition does something unexpectedly, you can even “call an audible” at the last minute and execute it effectively because you have rehearsed it in advance. In addition, of course, when you know what strategic moves you want to be able to make, you know what skills and resources you will require to make the moves successfully.
Management teams that think of themselves as coaches planning for a championship game are more likely to succeed than those who “wing it” by acting predictably, randomly, or only in response to the actions of others. Working through in advance what “plays” or strategic moves you want to make under different conditions is by far the best way to prepare for the new, highly unpredictable “game” of business strategy. We have even seen some companies that engage in “scrimmages” whereby they explore several generations of strategic moves by imagining what their competitors will do in response to their initial moves, and then determining what to do next.
The Contents of a Business Playbook
A business playbook must be developed quickly, and it should be fully integrated into your organization’s strategic planning and execution process. Ideally, building the playbook will involve the entire senior management team in thinking through the possibilities of market futures, strategic moves, and potential business outcomes.
From my perspective, a complete strategic playbook includes six basic “chapters.”
1.Analyzing the “Game.” The opening chapter includes a basic analysis of the company’s business environment, focusing on the fundamental drivers of change, including those strategic uncertainties whose combinations lead to a set of plausible alternative futures.
2.Assessing Our Competitive Position. This chapter includes a thorough examination of the company’s capabilities and limitations, with a particular focus on its position and power in its current channels. What is your present value proposition? Why do your customers buy from you and not your competitors? What are your capabilities and resources?
3.Scenarios—Envisioning the Future. This chapter contains documentation of the alternative futures that come out of the critical uncertainties defined by the scenarios you have created. These scenarios are most effective when they take the form of rich, detailed narratives that make the alternative futures come alive. In addition, more detailed economic analyses, customer profiles, and channel structures may also be described and discussed. This is also the chapter of the playbook where opportunities for changing the rules of the game can be identified.
4.Plays—Setting Our Options. These are the specific strategic moves that can be made within each scenario. In addition, indicators are identified—environmental factors that can act as signals that one or more of the alternative worlds may actually be occurring, or are becoming more likely. Here is where a potential sequence of plays can be outlined, helping to identify strategic priorities and interdependencies.
5.Executing the Plays. This chapter lays out the action steps required to execute each plausible or desirable strategic move. Here, the resources needed to execute each play are delineated, as are the managerial accountabilities for ensuring resource availability and actually executing the plays. In addition, it is often useful to identify the consequences of both success and delay in executing each play.
6.Tracking, Anticipating, and Acting. This chapter includes the ongoing documentation of the plays as they are executed, and it contains updated environmental assessments as well as any new plays or counter-plays as they are developed. It represents the regular, if not continuous, revision of the playbook. This notion of the playbook as a “living” document is critical—given the pace of change we live with today, any set of static plays will become outdated very rapidly.
It should be clear from these descriptions that creating and maintaining a comprehensive strategic playbook is no small undertaking. Yet, today’s business environment does not allow any organization the luxury of taking a year, or even six months, to develop its playbook. The successful companies we have observed typically complete a first-draft playbook in twelve weeks or less. It takes a focused, high-energy effort to do so. A time-box approach—which necessarily limits the amount of detail in the initial version of each chapter and each play to what can be prepared in a short period—is the only way to get the job done in time to make a difference.
The Process for Creating a Playbook
We recommend developing a playbook in three phases:
![]() Phase One—Background research and scenario development
Phase One—Background research and scenario development
![]() Phase Two—Development of strategic options
Phase Two—Development of strategic options
![]() Phase Three—Acquisition of necessary resources and building of the capability to execute
Phase Three—Acquisition of necessary resources and building of the capability to execute
Phase One—Background Research and Scenario Development
Phase One corresponds to chapters 1 and 2 of the playbook structure described previously, plus the groundwork for chapter 3. It involves conducting intensive background research into your industry, your current customers and channel partners, and your own business capabilities.
This phase typically begins with formation of an effective cross-functional playbook team that not only represents all the skills and perspectives needed to build the playbook but also has the credibility with senior management to ensure that its findings and recommendations are listened to and acted on.
Phase One includes asking questions like these:
![]() What is changing today about our customers, our competitors, our marketplace?
What is changing today about our customers, our competitors, our marketplace?
![]() What is our current position within our supply chain? What is keeping us where we are in the chain? What forces are changing our channel power relative to our suppliers, our customers, and—if applicable—the ultimate end consumers?
What is our current position within our supply chain? What is keeping us where we are in the chain? What forces are changing our channel power relative to our suppliers, our customers, and—if applicable—the ultimate end consumers?
![]() What core business processes drive our industry and channel today?
What core business processes drive our industry and channel today?
![]() What kind of channel player do we want to be going forward? What are our ambitions?
What kind of channel player do we want to be going forward? What are our ambitions?
Phase One generally concludes with a workshop with senior management in which these questions are addressed. Critical uncertainties are identified, and the senior management team itself explores scenarios of possible future operating states.
Phase Two—Development of Strategic Options
Phase Two, corresponding to chapters 3 and 4 of the playbook structure, should be completed within four weeks, if at all possible. The play-book team develops the scenarios in much greater detail, and for each scenario the team asks, “If this world actually happens, what do we need or want to do? What capabilities and resources are required to be successful?”
Other important questions to ask during Phase Two include:
![]() What impact would each scenario have on our existing resources, market position, and channel partners?
What impact would each scenario have on our existing resources, market position, and channel partners?
![]() How might our competitors react to each scenario? What opportunities and threats would their reactions create for us?
How might our competitors react to each scenario? What opportunities and threats would their reactions create for us?
![]() How could our resources evolve or be transformed to take advantage of the conditions in each scenario?
How could our resources evolve or be transformed to take advantage of the conditions in each scenario?
![]() What competencies are required to be successful in each scenario? What will it take for us to develop or acquire those competencies? Can we afford them?
What competencies are required to be successful in each scenario? What will it take for us to develop or acquire those competencies? Can we afford them?
![]() What kinds of products or services would our customers value in each scenario? Can we create these offerings ourselves, or do we need new (or existing) partners to create them?
What kinds of products or services would our customers value in each scenario? Can we create these offerings ourselves, or do we need new (or existing) partners to create them?
It’s very important at this point to engage senior management across the company in playbook development. When done well, this participation produces rich scenario narratives, and the detailed playbook becomes the basis for extended discussion and even excitement within the operating units that will ultimately implement the plays. During this phase, the company sometimes discovers that some of the critical indicators it has identified as signals of the future are already occurring. Such discoveries can serve as powerful wake-up calls that action is needed, and quickly. Of course, they also help in narrowing the field of likely and feasible options for action.
Phase Three—Acquisition of Necessary Resources and Building of the Capability to Execute
Phase Three, corresponding to chapter 5 of the playbook structure, is also best completed within another four to six weeks. It consists primarily of working through the resource requirements and execution capabilities surrounding each of the strategic options that have come out of the scenario-building process in Phase Two.
Here the organization is doing something that looks and feels like traditional resource planning; it is sorting through the implications and consequences of each possible scenario. What makes this process different, however, is that no final or formal commitments have been made to any particular strategic move. Identifying the possible or most likely scenarios is not equivalent to predicting that they will actually occur, and describing a set of possible plays is not committing to execute them. Indeed, defining the resource requirements and costs of each strategic play is another consideration that will help to determine what actions management actually wants to take. The practicality and economic feasibility of developing or acquiring the resources is an important part of deciding which of the moves to prepare to take.
The first iteration of playbook development concludes with another senior management workshop, this time to consider the playbook as a whole, internalize the scenarios, evaluate the plays, select any plays you want to execute immediately, and plan investments in capabilities and resources that will enable strategic plays in the future.
The Strengths and Limitations of Scenario Planning
As a planning tool, scenarios have both strengths and limitations. Their primary advantages are as follows:
![]() Plausibility. No one is trying to predict the future. The focus is on the logic of the scenario, not on what someone believes will or should happen, but what can happen and why.
Plausibility. No one is trying to predict the future. The focus is on the logic of the scenario, not on what someone believes will or should happen, but what can happen and why.
![]() Creativity. The brainstorming approach actively encourages outof-box thinking.
Creativity. The brainstorming approach actively encourages outof-box thinking.
![]() Tolerance for Ambiguity. By their very nature, scenarios teach managers that it is all right not to know “the” answer about the future. Perhaps the most important value of scenarios is that they shift the debate from “what will be” to “what if.”
Tolerance for Ambiguity. By their very nature, scenarios teach managers that it is all right not to know “the” answer about the future. Perhaps the most important value of scenarios is that they shift the debate from “what will be” to “what if.”
![]() Seeing the Big Picture. In laying out a range of possible futures, we become more adept at considering multiple variables, asking fundamental questions, and thinking open-mindedly about plausible alternative conditions. On the other hand, scenario planning introduces new kinds of risk into the way people think about the future.
Seeing the Big Picture. In laying out a range of possible futures, we become more adept at considering multiple variables, asking fundamental questions, and thinking open-mindedly about plausible alternative conditions. On the other hand, scenario planning introduces new kinds of risk into the way people think about the future.
There are several important limitations that you can ignore only at your peril:
![]() Oversimplification. You can’t cover all the key uncertainties in complete detail.
Oversimplification. You can’t cover all the key uncertainties in complete detail.
![]() Team Composition Interacting with Content. The team members and their interaction during scenario building inevitably affect the visions the team produces. While individual involvement and group cohesion can create an enthusiasm and understanding that is then difficult to replicate across the organization, groups that fall into either interpersonal, special-interest bickering or “group-think” may actually interfere with productive planning.
Team Composition Interacting with Content. The team members and their interaction during scenario building inevitably affect the visions the team produces. While individual involvement and group cohesion can create an enthusiasm and understanding that is then difficult to replicate across the organization, groups that fall into either interpersonal, special-interest bickering or “group-think” may actually interfere with productive planning.
![]() Insight Versus Action. The scenario technique works best in generating new ideas and leaps in understanding. But this doesn’t necessarily lead directly to action and concrete change. It is too easy to become enamored of the scenarios themselves, and to gain false security from their documentation. But their only value lies in the way the company acts on the information and ideas the scenarios generate.
Insight Versus Action. The scenario technique works best in generating new ideas and leaps in understanding. But this doesn’t necessarily lead directly to action and concrete change. It is too easy to become enamored of the scenarios themselves, and to gain false security from their documentation. But their only value lies in the way the company acts on the information and ideas the scenarios generate.
Summary
This is the value of scenarios: They have the ability to help you plan effectively for improbable and uncertain futures. Rather than selecting a most probable vision of the future and devoting all of your resources to a single, hard-to-change strategy, you can instead spend a small but significant amount of effort keeping your knowledge current in each of several different areas of concern—a range of possible futures.
The scenario planning process takes managers out of their daily routines, forces them to consider the underlying drivers that are causing change and uncertainty, and enables them to work constructively together to consider what might happen in the business environment. With this deeper understanding and broader anticipation of the future, they are then equipped to play out a range of potential strategies and sort out the implications of each strategy for the current business and its customers.
With a portfolio of strategic options in hand, a management team can determine the costs and risks inherent in adopting any one of them, or in trying several of them simultaneously. More important, the organization now has a much clearer sense of what factors in the marketplace matter, and can focus attention on the few uncertainties that will have the greatest impact on the future. With this knowledge of what to look for, the company is well positioned to move quickly to adopt a specific strategy, or make an aggressive move, as soon as it determines that the strategic indicators have moved in a given direction.
Building a playbook is not a simple task, but it is an extremely effective approach to anticipating how your business will be affected by the complex dynamics of a volatile marketplace. No one can predict with any confidence what the future in general will be like, and certainly no one but you can plan for how it might evolve in your industry and within your particular market segments.
As Louis Pasteur said, “Chance favors only the mind that is prepared.” In the fast-changing world of today, the future may be almost completely unpredictable, but it is not completely random. Scenario analysis, strategic indicators, and playbooks are tools for increasing your odds of success (and survival). When you know your strengths and limitations, your sources of competitive advantage, and your strategic options, then playing the game well becomes much easier.
Notes
1.It is difficult to identify the original source of this idea, which has been repeated many times by many pundits. As nearly as I can tell, it has been attributed with roughly equal frequency to both Peter Drucker and Alan Kay.
2.Arie de Geus, Peter Schwartz, and their colleagues at Shell Oil in the 1970s are generally credited with being the “inventors” of scenario planning. Schwartz was also the co-founder (and remains chairman) of Global Business Network, today’s undisputed home of scenario planning. And if there is a bible of scenario planning—what it’s about, why it’s important, and how to do it—it’s Peter Schwartz’s 1996 book, The Art of the Long View (Peter Schwartz, The Art of the Long View: Planning for the Future in an Uncertain World [New York: Currency Doubleday, 1996]).
3.Robert Gunther et al., “Scenarios for the Future of Human Resource Management” (Executive Summary), Society for Human Resource Management, 2005.
4.This example comes from Eric Clemons, a friend and former colleague who teaches IT and Business Strategy at The Wharton School at the University of Pennsylvania.
5.Gunther et al., p. 12.
QUALITY EMPLOYEE ENGAGEMENT MEASUREMENT: THE CEO’S ESSENTIAL HUCAMETRIC TO MANAGE THE FUTURE
Kenneth Scarlett
Peter Drucker, generally recognized as the inventor of the modern organization, commented that the best way to predict the future is to create it. Perhaps he was thinking about the day CEOs would use predictive human capital metrics, or hucametrics, to sculpt their own business future. Thanks to advances in technology and greater scientific understanding of the value potential of human capital, that day has arrived for CEOs who are ready to proactively manage their human resources and their businesses using future-facing metrics. Here, I describe how having predictive data to put the right people in the right place, at the right time, with the right skills, at the right engagement level, so they can do the right things, serve the right customers, just in time, is the best way to create business success in these unpredictable times.
Hucametrics Explained
So what is hucametrics and what in the world does quality employee-engagement measurement have to do with predicting outcomes? Huca-metrics (hew-ca-MET-rix) is the new science of tracking and applying human capital data to predict employee and business performance and cause and effect. Hucametrics is to predicting winning business outcomes as sabermetrics is to predicting the best courses of action to win baseball games and Numerati is to predicting customer purchase preferences. The assumption is that most, if not all, organizations have a signature set of data on their human capital that can be formulated to foretell the future and illuminate the best possible courses of action with a high degree of accuracy. These hucametric data sets, powered by quality employee-engagement profiles, can enable forward-thinking top managers to create their own futures.
Are You Ready?
In forty-five-plus years of employee attitude and engagement research, some interesting, reliable, and repeatable statistical models have been produced that are predictive of future business and employee performance. These models vary in complexity from basic to expert. Further, they seem to operate, if managed from the top of the organization, in virtually any size company or organization, provided the measures are statistically sound and separated into management, nonmanagement, and customer-contact groups.
I refer here to the basic hucametric predictive model as the CEO success formula:
Competence × engagement × organizational opportunity = return on human capital
Or, more conversationally put, “ready, willing, and able.” For those who want reliable, forward-facing metrics to maximize the return on dollars invested in human capital, while synchronizing the organization’s activities to delight the customer, this is as simple as it gets. Human resources’ economic contribution is at the heart of maximizing the productivity of capital (profit), and human capital is usually the most expensive form of capital. It stands to reason that some foresight regarding the return on human capital has the potential of adding incredible value. So, in its complete form, the success formula provides CEOs with meaningful indexes and data columns that list the elements of each of these hucametric indexes on their computer spreadsheets each month, with a baseline ROI on human capital numbers and a projected ROI on human capital numbers. Each leader is accountable for each index in the formula for his or her group and for correlating those statistical relationships to group performance and data on business outcome. It is at the group level that many predictive linkages emerge and become actionable. Many organizations have some form of these hucametrics squirreled away, sitting idle, and they simply need to be gathered and mathematically calibrated to work in combination. But the CEO needs to get his or her hands dirty and drive it. But let’s look at the CEO success formula in greater detail.
Competence—”Ready”
Think of competence in the organization as a collective rather than an individual phenomenon, where unity of effort is more important than the sum of the parts. That’s why we have organizations: because one person can’t do all the work. But too much emphasis has been put on individual/anecdotal talent management these days, at the expense of group engagement and unity of effort, which is where the real value and potential for predictability slumber.
Competence, for hucametric purposes, is the group’s or organization’s collective state of being adequate, well qualified, or masterful in performing a specific set of jobs or functions, measured against set standards, and in consistently and successfully achieving specific outcomes. It’s a reliable statistical measurement of group performance against established or desirable business outcomes. The competence element of the equation can be derived from individual performance-appraisal scores (provided those scores reliably describe the actual level of performance), aggregated by work group, expressed as an index, and broken out by value-factor element. Experience has shown that the aggregated scores of management, nonmanagement, and customer-contact groups should be broken out and rolled up separately to make it easier to spot direct cause-and-effect links.
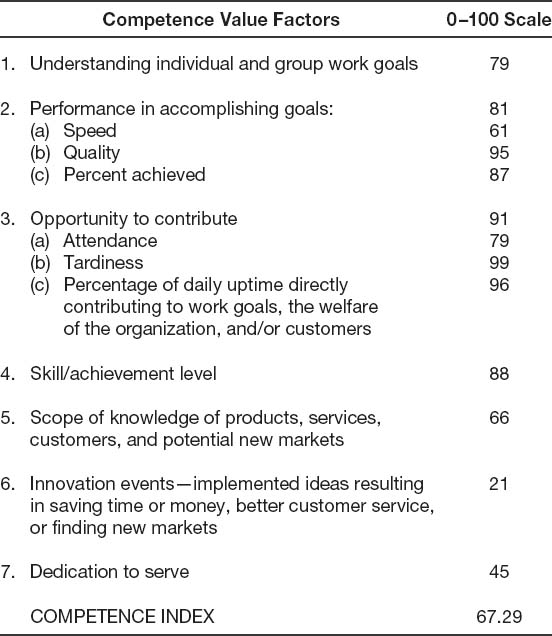
Figure 4.6 is an example of what the nonmanagement competence profile may look like.
For these statistics to be useful for predictive and intervention purposes, individual performance results should be aggregated by leader work group. We have found that most companies underutilize combined individual performance-appraisal scores and fail to adequately manage group performance totals. Often the valuable data get stuck in the human resources department rather than being sent to operating managers for data mining and correlation.
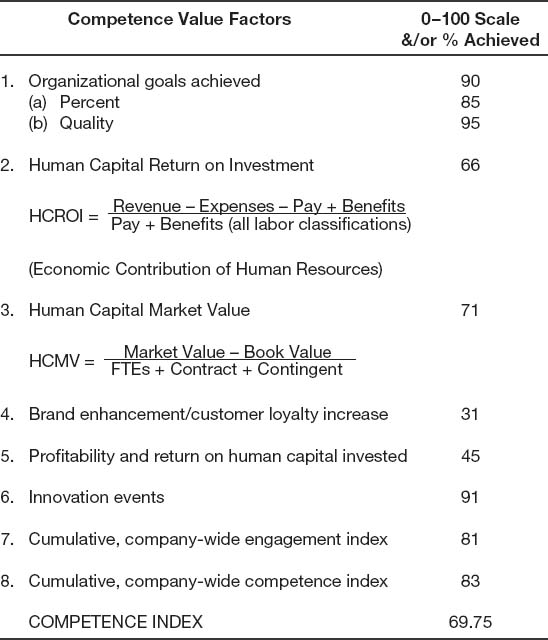
Figure 4.7 is what the top management group profile may look like. Competency profiles, once calibrated properly, should statistically describe the competency of each work group, as well as the organization as a whole. Group competency scores can be classified into categories of less than adequate, adequate, well qualified, and masterful for purposes of skills training and transfer management. Over time, signature acceptable ranges can be established based on their correlations to desirable future outcomes.
Employee Engagement—”Willing”
How many times have we seen gifted athletes or persons of great talent become disengaged or even hostile toward the organizations that employ them? They may be masterfully competent, or ready, to provide great talent, but they are emotionally unwilling to focus their talents and efforts for the economic benefit of the enterprise. It’s like a champion race-car driver spending big money on a high-horsepower sports car and refusing to start the engine. The driver is ready but unwilling.
Figure 4.6. Nonmanagement work group competence profile.
True measurement of engagement statistically describes this state of willingness and predicts the quality, speed, energy, and enthusiasm of human effort in the organization, independent of competence or opportunity to contribute. “Ready” without “willing” results in poor return on human capital because the capital sits idle. The expert race-car driver is going nowhere.
Figure 4.7. Top management competence profile.
This is why the engagement element of the CEO equation given earlier must come from quality employee-engagement psychometrics—a rarity in today’s euphemistic marketing-muscle world. Poor-quality attempts at measuring engagement are a massive problem affecting an estimated eight out of ten organizations in the United States alone. Faulty measurement disables management’s ability to engage employees, which often is the root cause of companies going out of business. Based on our sampling, seven out of every ten CEOs are less than satisfied with the integrity of their measurements or the return value of their current employee-survey programs. That is, they don’t believe that their surveys accurately measure engagement. Conversely, we have found that eight out of ten HR directors are satisfied with their surveys. That is, satisfaction is passive, engagement is active, and the emotional commitment of energy is toward reaching the goals of the enterprise. Thus, quality measurement of engagement is critical to employee survey values, workforce productivity, the future success of the business, and the successful application of hucametrics—so we need to examine this in some detail.
Cases of Mistaken Identity
Engagement is often mistaken for satisfaction in opinion, best-in-class, or business outcome surveys. As a result, management errantly embarks on fixing the wrong things in an attempt to positively engage more employees, often with deleterious consequences. Extrapolating from a reputable independent study,1 over 7 million more employees in the United States became disengaged between 2005 and 2006. Clearly, this epidemic of disengagement is being fueled by mistaken measurement. Most surveys labeled “engagement” are, in fact, not.
Similarly, two fundamental precepts necessary to positively engage people are often ignored in the survey measurement: (1) employee sense of fair treatment underpins engagement (if people feel they are treated unfairly, there is less than a 15 percent chance they will be positively engaged), and (2) the things that engage people are different from the things that disengage them (the opposite of disengagement is not engagement, but no disengagement). Disengaged talent produces negative financial value. Figure 4.8 summarizes our findings, which describe how engagement factors and disengagement factors operate separately but interdependently.
There are a couple of things to note about these findings, based on Frederick Herzberg’s Two-Factor studies and confirmed by our survey work: (1) positive employee engagement cannot be sustained if the preponderance of disengagement factors is not neutralized, and (2) to positively engage employees there is more than “one thing you need to know”—most disengagement factors must be neutralized before improvements in engagement factors can have a significant positive influence.
Figure 4.8. Effect of motivation and hygiene factors on engagement and contribution.

Source: Scarlett Surveys International, 2008.
Definition and Measurement of Quality Engagement
After many years of empirical instrument testing and measurement across many industries and cultures, we developed the following definition of engagement that is measurable, manageable, and predictive: Engagement is an individual’s degree of positive or negative emotional attachment to his or her organization, job, and colleagues.
Notice that the above definition describes engagement as an individual phenomenon that varies in intensity from extremely positive to extremely negative. In the middle of the engagement spectrum is a neutral position that is often mistaken for satisfaction (and acceptably productive). The reality is that engagement—or, more precisely put, emotional attachment—is heavily influenced by employee experiences with employers; leadership interactions; policies and procedures; company image; and aspects surrounding the job, work, rewards, social camaraderie, and work environment.
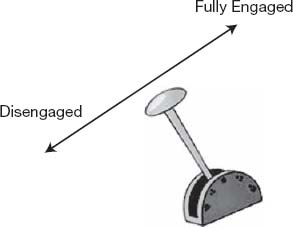
Figure 4.9 illustrates engagement when expressed as an acceleration lever. At the front-forward position, there is a predisposed behavioral tendency that favors economic contribution for the organization. At the back-end position, there is a behavioral tendency that is detrimental to economic contribution. Individuals at the back end are disengaged. At the extreme back end, employees are actually hostile about constructively contributing to the economic benefit of the organization.
From this understanding and definition of engagement, Scarlett Surveys has developed fifteen global factors, or drivers, of engagement that are universal in their measurement application. Employee attitudes toward these drivers heavily influence their behavioral predisposition to economically contribute, add value, or not contribute. Thus, employee engagement can be measured by surveying employee attitudes about these drivers, using a battery of validated questions. Scored responses to these question batteries assess the emotional attachment level, judge the intensity of effort propensity, and predict future behavior.
The Identification of Engagement Drivers
So, how can CEOs apply this information to increase the ROI of human capital?
Employee engagement from the organization’s point of view is the art of getting people to do whatever is necessary to ensure continuous high performance and the success of the business—and have them love doing it! The measurable definition of engagement—an individual’s degree of positive or negative attachment to the organization, job, and colleagues—makes it possible to provide managers with trustworthy statistics as a means of improving their art. The group engagement index shown in Figure 4.10 is a summary score of how masterful they are becoming in the art of better engaging their people. The goal, of course, is to fully engage 100 percent of the people who are 100 percent competent 100 percent of the time.
Figure 4.9. Accelerator for employee engagement.
Source: Scarlett Surveys International.
The most common failure of management to engage employees is poor integrity of the survey measurement. Occasionally, in a workshop or presentation, I will ask participants to select from a list of immeasurable but pleasant-sounding employee engagement “definitions” collected from published Society for Human Resource Management information. I ask them to bear in mind that their selections will determine their company’s leadership actions in managing people in the organization for years to come, in spending thousands of hours in discussions at meetings, and in determining the spending on human capital priorities. A couple of interesting things occur. Rarely do people from the same company choose the same definitions, and the most nicely worded but most immeasurable definitions are chosen more than 60 percent of the time. The point is this: Confusion in the marketplace is crippling Management’s attempts to successfully measure engagement and to use that data predictably to increase their percentage of engaged employees. Employee engagement is too often reduced to rhetoric (“I know it when I see it”) rather than a reliable statistical measurement upon which to base performance standards, make leaders accountable, and continually increase return on human capital.
Similarly, most employee surveys do not contain the complete set of fifteen engagement drivers (even though they may get at some elements or derivatives of engagement). The harm is caused when follow-up managers prioritize an incomplete or incorrect list of drivers that, when engaged, actually disengage employees. This predicament is commonplace with satisfaction surveys that measure factors that, in reality, are entitlements and hygienic oriented. Prioritizing and activating those survey results do not have a positive correlation to improving the number of positively engaged employees.
In a recent podcast interview I was asked why there are fifteen engagement drivers. My response was, “I wish there weren’t, because there are more questions to ask, more psychometrics to get right, and more factors to manage; but we can empirically prove there are fifteen, just as Frederick Herzberg proved there are fifteen.” The interviewer’s response provided a good summary of reality: “I guess that’s because people are a lot more complicated than we want to believe.” What we are dealing with is an accepted widespread lack of integrity in engagement measurements, which originates from faulty definitions—that is, does the instrument correctly measure employee attitudes toward proven engagement factors and calculate a reliable numerical index predictive of future behavior?
Figure 4.10. Nonmanagement engagement sample.

Source: Scarlett Surveys International, 2008.
Now that we’re experts in employee engagement measurement and its predictability value, let’s move on to the next hucametric.
Organizational Opportunity—”Able”
Dr. Frederick Herzberg once commented, “If you want someone to do a good job give them a good job to do.” This statement lies at the heart of what organizational opportunity is all about: putting the right people in the right place at the right time doing the job or working for the cause they love.
Organizational opportunity metrics are a bit trickier to gather than those for competence and engagement, since they aren’t wholly available off the shelf. In his recent book Outliers, Malcolm Gladwell describes how opportunity in addition to competence and engagement (he calls it “luck”) help people and groups succeed. GE did some good practical work on organizational opportunity some years ago. It took data from performance appraisals, placement tests, and employee surveys relating to job fit, productivity, personal growth, and personal goals to formulate group indexes and manageable individual work plans that were matched to customer engagement, future customer demand, and potential new markets. GE was one of the first organizations to realize that organizational opportunity—giving people a chance to contribute to the max and have unlimited success—could predictably maximize their return on human capital and grow their business exponentially. GE forced its managers to figure out innovative skill-building career paths for each individual in their groups so that their “double O” group index would be higher and their bonuses bigger. As a result, a good brand was made great, and innovations and new start-ups became commonplace, all while running low operating costs and achieving high return on human capital. But the CEO drove the process.
Our research over the years has revealed that, by and large, people go to work for economic stability, to find out who they are (personal growth), and to achieve and be recognized for those achievements. Company owners, on the other hand, want people to come to work to add more economic value than they are paid. The two motivations can be bridged through organizational opportunity.
Figure 4.11. Nonmanagement work group organizational opportunity profile.
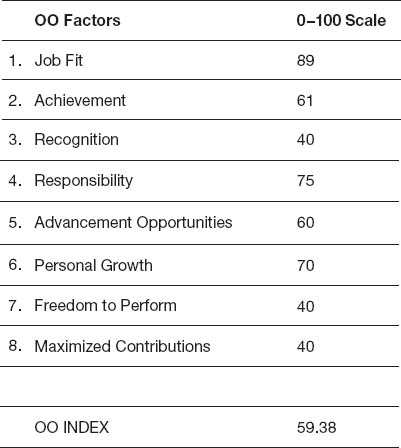
Take, for example, our race-car driver. He is “ready” (he is a certified, competent master race-car driver with a great car), he is “willing” (he is fully engaged racing cars), but he is required to work concessions at the track instead of getting the opportunity to race. His organizational opportunity score would be low and his return on human capital score would be low.
The method we have used successfully to measure double O is to extract data from engagement survey results in the following areas: job fit, achievement, recognition, responsibility, advancement, growth, freedom to perform, and a self-classification question involving contribution. Figure 4.11 above is an example of a nonmanagement work group organizational opportunity profile.
The Return on Human Capital Predictor
Based on the example in Figure 4.11, using the index scores of the non-management group, let’s take a look at how things multiply out:
(Competence) 67.29 × (engagement) 73 × (organizational opportunity) 59.38 = (potential HCROI) 291,685
This translates to a PHCROI index average of 66.56. Both number results are useful. The 291,685 can be compared to current revenue per employee, human capital ROI, human capital value added, and human capital market value (see The ROI of Human Capital by Jac Fitz-enz, pp. 35–38) every time the CEO success hucametrics are gathered until some type of predictive relationship is established, overall and at the work-group level. After the first round of measures, there should be sufficient data from the group profiles to establish some predictive trends.
The index average can be used to measure leadership performance, company-wide, in maximizing return on human capital. You can use it as a summary score for leadership effectiveness and as an essential qualification for promotion.
Hucametrics—Where Do I Start?
The value proposition is this: If the CEO does not embark on huca-metric modeling, his or her organization’s chances of continuously thriving in this age of short product and service life cycles, extreme market shifts, and economic uncertainty are substantially diminished. Driving a car looking out of the windshield gives someone a much better chance of arriving at the intended destination on time and alive than using the rear-view mirror. As the car increases in speed, the rearview person’s chances of avoiding obstacles, staying on the road, and arriving safely diminish substantially. This is the case with today’s flat-world market speed. Historical and even current financial accounting and operating statistics have us looking out the back and side windows as the speed of markets increases and the likelihood of going in the wrong direction or hitting something we didn’t see is certain. Foresight eats hindsight for breakfast. The business disasters at GM, Ford, and Chrysler are harbingers of what’s in store for companies that disregard hucametrics.
This basic CEO success equation should be just the beginning in the modern organization’s quest to harness and apply human capital data to reduce uncertainty and shape its own business future. But hucametrics can’t get stuck in numerically challenged HR departments. Think of it as a science that requires someone’s full attention to get the signature cause-and-effect models right. It’s more than just about making money; it’s about promoting human excellence and eupsychian leadership. It’s about creating wealth with people, rather than by using them.
For hucametrics to really work in an organization, CEOs need to own the data and appoint a numerate human capital (HuCap) manager who reports directly to them. The HuCap manager should supply the data matrices, explain them, and make them predictive and reliable. Like a business GPS system showing the road ahead and the alternative routes, the HuCap manager is responsible for developing signature predictive cause-and-effect profiles, eventually correlating hucametric data with Numerati data to predict the most efficient deployment of human resources to best engage the customers. Similar to the “quality czars” of the 1980s who made quality predictive and American businesses competitive again, the HuCap manager of tomorrow will make return on human capital predictive, will make investors more knowledgeable, and will make businesses more successful.
Note
1.The Conference Board, TNS survey of over 5,000 U.S. households.
TRULY PAYING FOR PERFORMANCE
Erik Berggren
Performance management is one of a manager’s most perplexing tasks. The reason that managers and supervisors have a difficult time conducting performance appraisals is twofold: psychological and systemic. In the first case, many cultures, particularly for America’s individual-based all-are-created-equal value system, there is an underlying belief that criticizing another person’s performance is unacceptable. When organizations force this task on supervisors, those employees’ anxiety levels elevate. In the second case, the system and the tools we give supervisors to do the job are problematic. In my years of running HR departments, every compensation manager I hired wanted to change the performance-appraisal forms. My response was, “Go ahead if you must, but it is not going to make any difference.” The problem is not with the form; that is simply a scorecard. The problem is with how we manage performance.
—Jac Fitz-enz
Paying for Performance
The standard system of performance management is flawed. Theoretically, we pay for performance; actually, we pay for many things, and performance is one item that is often far down on that list. To begin, we all know the reasons that people receive salary increases of one level or another:
![]() Fear of confronting employees whose view of their performance is much higher than that of the rater
Fear of confronting employees whose view of their performance is much higher than that of the rater
![]() Fear of losing employees who would be dissatisfied with the rating and subsequent salary increase
Fear of losing employees who would be dissatisfied with the rating and subsequent salary increase
![]() Lack of sufficient room in the salary system to truly differentiate between levels of performance
Lack of sufficient room in the salary system to truly differentiate between levels of performance
The list goes on. In contrast, the most effective systems I have seen in the past forty years—and there have been few—all have one common trait: They connect individual and group performance with the organization’s key performance initiatives. There is no break in the linkage. Most organizations claim that they align the top goals with employee performance, but close scrutiny reveals gaps and misdirections as the goal imperatives cascade down from the top to the middle and bottom.
If you ask top executives if they have fully aligned organizations and if they pay for performance, they throw back their shoulders and proudly say, “Of course, that is my job.” But when you empty the room and turn off the cameras, the shoulders come down and the truth comes out: “We try, but we don’t always succeed.” In too many cases that is a gross under-statement. If workers had any other option, they would rebel. Unfortunately, the next company they go to has the same flawed system.
Why is it that intelligent, talented, experienced executives cannot build and manage aligned systems that truly reward people for their performance? Like most solutions, the answer is in the question and the key word is alignment. If the line from the corporate goals to the individual performance is skewed or broken, the system breaks down. And why, so often, is that line skewed or broken? It is a lack of discipline backed by naïveté.
I once had a somewhat heated argument with a CEO who believed—so he said—that all you needed were good people backed by resources and they would work it out. He could not see that everything that works well runs on a system of consistent and coherent processes. No, that attitude is an abdication of executive responsibility. I suspect he didn’t want to confront something in which he was not proficient—that is, managing systems. He was a financial wheeler-dealer, not a leader and manager. Eventually, his company fell apart, and he moved on to ruin another company.
Research has consistently shown that companies that set and maintain an alignment from top to bottom, and that pay for performance based on employees’ meeting objectively stated goals, outperform the market.
Performance Management: How to Really Pay for Performance
Performance reviews are a fundamental aspect of managing individual and company performance. As organizations grow larger, the link between individual performance and organizational performance becomes more obscured by size, systems, and processes. In a company of one, a person working for him- or herself, it is clear that company performance is largely determined by the performance of that person. In a company with thousands of workers, the contribution of each individual is not always so clear, yet motivating and maximizing the performance of individuals is critical to company performance.
Every Person Counts
Too often, the focus on individual performance is lost because people are aggregated into numbers. These numbers are important for perspective—in fact, people costs make up as much as 70 percent of operating costs. There is no doubt that people are supremely important to both output and cost; however, managing people in aggregate as an expense is a surefire recipe for poor company performance. Everyone in a modern organization is connected.
Companies are under increasing pressure to make big decisions regarding their people. Uncertain economic times and changes in the environment are forcing companies to adjust their staffing, reduce head-count, and realign their resources for the future. Furthermore, companies are under pressure to make these decisions quickly enough to respond effectively to the changing environment. Those companies with great human capital management will be able to make these decisions intelligently, with real data on individuals. Companies without great systems for managing people and performance-related data will default to managing people in aggregate. True workforce optimization is not possible without meaningful, accessible, and relevant data on individuals.
SuccessFactors Research and Dr. Jac Fitz-enz conducted a study called “How Smart HCM Drives Financial Performance,” which clearly showed that companies that maintain a focus on the individual perform better than those that do not. This study looked at high- and low-performing companies to see how the talent-management processes of high performers differed from those of low performers. The results speak for themselves:1
1.67 percent of companies with stronger financial performance cover all managers and some levels below with the performance management system. Only 28 percent of the weaker performers do.
2.44 percent of the stronger performers have 100 percent aligned goals at the managerial level. None of the weaker performers do.
3.63 percent of the high-growth group review employee performance more than annually. Only 22 percent of the low-growth companies do.
Companies with performance management, goal management, and succession management outperform those that do not—it is that simple. Performance management provides individual benchmarks relevant to the worker. Goal management provides a context within which to act and get everyone on the team on the same page. Succession management provides a framework for moving individuals to where they might have the greatest impact in the organization. Of course, the data are the real power behind these talent-management applications.
![]() Performance Management Systems. From a people perspective, isn’t it fair to say that an individual should get clear expectations on what he or she should accomplish? Think about playing a sport without understanding the rules of the game. How are success and defeat to be measured? In most situations, business is a team sport. Team sports have the added dimension of different roles, with some players on offense, some on defense.
Performance Management Systems. From a people perspective, isn’t it fair to say that an individual should get clear expectations on what he or she should accomplish? Think about playing a sport without understanding the rules of the game. How are success and defeat to be measured? In most situations, business is a team sport. Team sports have the added dimension of different roles, with some players on offense, some on defense.
These individuals need to know how they are doing and how to improve. This is why success in different positions is measured differently. In ice hockey, a goalie is measured by different metrics than is a forward offensive player. A strong performance management system measures individuals with relevant metrics, and these metrics are transparent and effectively communicated to the individuals in order to set clear expectations.
![]() Goal Management Systems. Of course, team sports are won by teams (individuals acting together toward a common goal), not by individuals. Where performance management provides individual benchmarks for success, goal management links individual performance with the goals of the team or organization. Players on the field need a context for making decisions. If athletes were rewarded only on success in their roles, and not on the success of the team, then teamwork would break down. Goal management puts action into perspective for individuals, and also ensures that everyone is contributing to the team goals, or the objectives of the organization.
Goal Management Systems. Of course, team sports are won by teams (individuals acting together toward a common goal), not by individuals. Where performance management provides individual benchmarks for success, goal management links individual performance with the goals of the team or organization. Players on the field need a context for making decisions. If athletes were rewarded only on success in their roles, and not on the success of the team, then teamwork would break down. Goal management puts action into perspective for individuals, and also ensures that everyone is contributing to the team goals, or the objectives of the organization.
![]() Competency Management Systems. How do you build a successful team? Sports are fairly straightforward. In American football, if you need a great receiver, you look for someone with the speed and agility required for the role; the competencies required to be a great receiver are obvious. With some thought and planning, smart companies also can identify the competencies required to succeed in various roles, and place and develop talent in those roles accordingly. Competencies are one of the few reliable leading indicators of performance. People with the right competencies for a role are more likely to succeed in that role.
Competency Management Systems. How do you build a successful team? Sports are fairly straightforward. In American football, if you need a great receiver, you look for someone with the speed and agility required for the role; the competencies required to be a great receiver are obvious. With some thought and planning, smart companies also can identify the competencies required to succeed in various roles, and place and develop talent in those roles accordingly. Competencies are one of the few reliable leading indicators of performance. People with the right competencies for a role are more likely to succeed in that role.
A Real Performance Review
A real performance review is much more than a form, or even process. Many companies look at a performance review as an appraisal, but it is really much more than that, as shown in Figure 4.12. It is the single most powerful tool for driving the performance of an individual in an organization, and it will likely have substantial repercussions on pay, future promotion, and (therefore) the engagement of the individual.
The automation of a form is the start of a performance management process, not the end. A well-rounded and complete performance review has these three components:
1.The Dialog. The line of communication between a manager and his or her direct reports is the start of all performance reviews. The dialog is an ongoing conversation between manager and employees, with the purpose of establishing clear expectations and goals, and trust through transparency.
2.The Data. All too often a performance review is distilled down to a single appraisal that is either too generic or too narrow in scope to truly perform a meaningful assessment. The performance review is a time to pull together and rate the employee on all of the dimensions mentioned earlier. Review the progress the individual has or has not made on the goal plan, assess his or her competencies, and measure the individual contributions. Only with comprehensive data can meaningful decisions be made.
3.The Direction. If a performance review does not provide direction for both the manager and the employee, then the process itself has little value. The employee should be left with a clear impression of where he or she has excelled and where improvement is needed. Furthermore, the individual should not only have an idea of how he or she is doing in the current role but also where he or she might go elsewhere in the organization. Managers should get a clear idea of not only how their people are performing but also where each individual can make the best contribution for the company.
Figure 4.12. Performance review functions
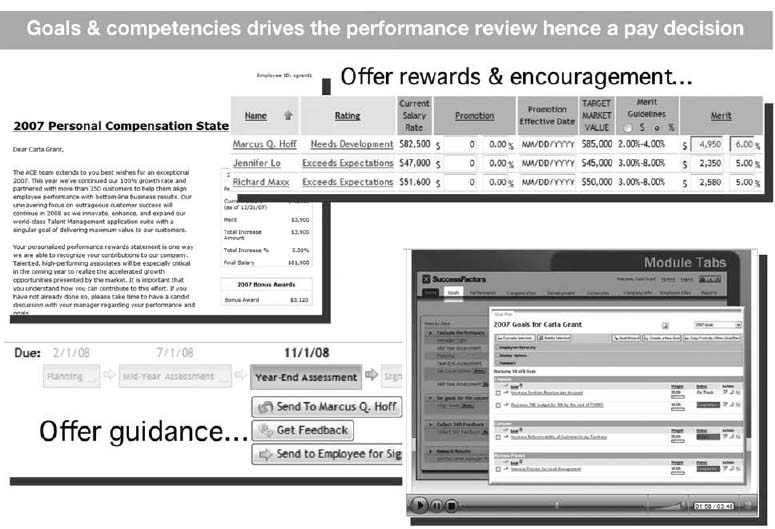
Source: SuccessFactors, 2008.
Why is there so much focus on transparency and direction? In addition to being smart tactically—employees will find it harder to complain if they know what is expected and where they are going—it is also smart from a performance perspective. Both clear links between individual goals and company performance and having a clear career path are strong drivers of employee engagement. Then, organizations are pushing performance directly through the review process, as well as through potential increased employee engagement.
Make It Count: Strategic Applications
The performance review, done correctly, is the foundation for making strategic people decisions. In isolation, it provides the tactical benefits of managing the performance of an individual. But what if the data could also be used to save the company millions of dollars in compensation cost by providing a global view on pay versus performance across the entire organization? This is just one potential strategic application of performance review data. Use performance management data (which, remember, should include goals, competencies, and workforce planning data) to drive real value creation in your organization.
There are several rules you can use to ensure that you get the most from your performance management data.
Never, Ever Do Compensation Planning in a Vacuum
Compensation is the clearest and most direct reward that companies control, and it is one of the most effective levers for motivating individual performance. Compensation is also supposed to represent in some way the value that an individual adds to the company—people are supposed to be paid what they are worth. Compensation largely determines the cost of people (including benefits, time off, and other perks). Few things are as critical to a company as getting its compensation right, and you must not get it wrong.
The only way to really understand if you are compensating an individual appropriately is with access to detailed performance review data on that person. Of course, the labor market will set a wide range that is appropriate for a given role, but these broad categories do not provide real insight into the contributions of individuals, regardless of their roles. If someone is contributing much more than a typical person in his or her role, that person should be rewarded, even if it pushes the individual over that role’s pay ceilings. (Ceilings are ridiculous things anyway; if someone is performing and contributing extraordinarily, artificial boundaries should not dictate the compensation.)
Real performance review data allow managers to set pay accordingly, to truly pay what the employees are worth. The value of an integrated system extends even further; with analytics and comparative functions, managers can see how the pay is spread, how it compares to that of others in the organization, and what a global view of compensation in the company looks like. Having a global stack ranking of performers can help in determining appropriate compensation levels, and it has the added benefit of highlighting high performers throughout the company. The value of this data review is illustrated in Figure 4.13.
Never Do Layoffs Without Performance Data
Earlier I mentioned the folly of managing people by aggregate; there are few scenarios where this is more likely to happen than in the case of layoffs. Presumably, layoffs happen because the company is spending too much money or because revenues have dropped, usually owing to changes in the external environment. Financial pressure drives managers to make cost-cutting decisions quickly. Where people are managed as costs, bad decisions result. People create the value in modern organizations; they make the products and intellectual property, sell to and support customers, and ultimately build the top line.
Figure 4.13. Effects of merit increase on net income.

Source: SF Research Analysis, 2008.
Take, for example, a typical layoff scenario. All departments are ordered to lay off 10 percent of their staff. But what if one department was extremely high performing? Why lay off any of the high performers? Global performance review data can help companies avoid these scenarios by allowing them to do real performance-based layoffs. Don’t lay off aggregate groups; lay off the low and middle performers who aren’t contributing. In uncertain times you want to keep your strongest people to keep your company performing and ready to emerge in a position of strength when the economy recovers.
Fill Here, Fill Now
Use your performance review data to drive the internal fill rates in your company. Hiring from outside of the company is costly. External hires are unknown quantities, typically have longer ramp-up to productivity times, and are generally much more expensive than filling an open position with an internal promotion or lateral move. Of course, companies need and should want some external hires for fresh ideas and to expand the workforce, but finding the right balance between internal and external fills builds impressive cost savings and has the potential added benefit of increasing engagement. As I have mentioned, career pathing is an important driver of employee engagement. Furthermore, flexibility to move people around the organization allows managers to put talent where it can make the most impact.
The power of real performance review data is in the objectivity and transparency that the data bring to the process of filling positions, making promotions, and arranging lateral moves. Slackers cannot hide when performance is being accessed continually and comprehensively. Politics and favoritism can be curtailed. Objectivity and transparency are the building blocks of a high-performance organization. Progressive organizations don’t “manage turnover”; they “optimize their workforce”—a much deeper and more impactful action that sets the company up for long-term success.
Quantitatively Driven Performance Management
As Dr. Jac Fitz-enz taught over twenty years ago, it’s not about the form—it’s about the usage of data. What is important is consistency, or having a systematic approach to managing performance and having a sound process that drives the right behavior. Quantitative, objectively driven performance management simply provides you with the most strategic data to manage the business. Those data are key to motivating your managers and employees to use the system, and to make the strategic data easy and rewarding to act upon. You cannot hand businesspeople a solution with poor processes and complicated forms and expect them to use it. Simplicity is the key to getting the most strategic benefit from the process and to beating your competition while making work a better place for individuals in the process.
Pay is an extremely sensitive issue for employees, and it serves several purposes. It is a scorecard that allegedly reflects one’s contribution to the organization. It is supposedly a fair assessment of reward that matches the market. It is a measure of comparative equity across the workforce. Mostly, it is a highly personal matter. Get the pay wrong and very little else matters. The connection of pay to performance is probably the most important issue that management must master.
Note
1.Erik Berggren and Jac Fitz-enz, “How Smart Human Capital Management Drives Financial Performance,” SuccessFactors, 2006.
THE SLIPPERY STAIRCASE: RECOGNIZING THE TELLTALE SIGNS OF EMPLOYEE DISENGAGEMENT AND TURNOVER
F. Leigh Branham
There are two ways to look at what is often called turnover, or attrition. One is the negative perspective of turnover whereby we track turnover rates. The other is the positive viewpoint of retention. If we focus on keeping people whom we need, we will have better results than if we view the problem from the turnover side. In order to be preventive and predictive, however, we have to reverse-engineer the concept of turnover. Questions such as who is leaving, when in the individual’s career is he or she jumping ship, and what is the reason for quitting paint a picture of turnover. This gives clues as to what you can do to retain such people. It is almost always better to view a problem from the positive rather than the negative side.
Engagement can also be viewed from two angles—an employee’s feeling engaged with the company in general and the results of engagement that lead to exceptional performance. The first view is passive, akin to job satisfaction. The second is active and drives value. For both retention and engagement, the challenge for supervisors at every level is to pay attention before the fact rather than after, when it is often too late.
Disorder and Disengagement
The phrase “attention-deficit disorder” can be used to describe a much broader range of phenomena than its usual psychological meaning. In today’s business climate, it certainly applies to a reduced focus on employee retention. One CEO described how he saw the situation: “Most of my CEO friends at other companies are ‘high-fiving’ each other in celebration of the fact that their employees are once again ‘tree-hugging their jobs.’ “ In other words, many leaders and managers are finding good news where they can in the down economy.
But there is a downside to the relief of not having to work so hard to retain talent: Many managers are paying even less attention to their front-line workers. And the timing for that response couldn’t be worse. Economic contraction demands that managers work harder than ever to coach, manage, and engage all who report to them. And yet, the human response, regardless of one’s level, is to turn inward and worry about one’s own job and survival prospects.
With employee disengagement already hovering somewhere between 40 and 75 percent in most companies (depending on which survey is used), we don’t need any new reasons not to pay attention to people management. We already know that while more than 80 percent of employees leave their jobs for reasons unrelated to pay, a large majority of managers still believe that pay is the main reason employees leave.1
This disconnect between manager belief and employee reality strongly suggests that many managers are failing to see the daily opportunities to reengage employees through recognition, performance feedback, career discussions, increased responsiveness to work-life issues, job redesign, and the full range of “soft” solutions. The good news is that these solutions are relatively inexpensive, and are well within managers’ spheres of influence and control.
The Unfolding Model of Employee Disengagement and Turnover
Most new hires are highly engaged on day one, so why do so many become less engaged during the ensuing weeks and months? And how do we get leaders and managers to pay more attention to the signs of employee disengagement before it’s too late to do anything about it?
Knowing the causes of employee disengagement doesn’t guarantee that managers will recognize the signs of it. Nor does recognizing the signs guarantee that managers will care enough to do anything about it. But what is helpful is to better understand the dynamics of how employees disengage and leave their jobs.
No one has done more to help us understand these dynamics than Dr. Thomas Lee, business professor at the University of Washington in Seattle, who has spent much of his academic career studying how and why employees make the decision to leave their jobs. Dr. Lee’s major finding is not a surprising one, but it is sobering nevertheless: that an employee’s departure, from first thought to final action, is typically not a sudden decision; it is a gradual process that may take weeks, months, or even years.2
The down staircase in Figure 4.14 shows the intervening steps, from initial engagement through final departure. An employee typically starts a new job with great optimism and enthusiasm. Some are able to sustain their enthusiasm. Others become disillusioned by the job or other work-place realities, which they may tolerate for long periods, during which time they typically withhold effort and show less enthusiasm. Eventually, the employee may, or may not, begin an active search for another job, receive an offer, and leave. And as we know, as the saying goes, some employees quit and leave while others quit and stay (“warm chair attrition”).
Figure 4.14. Steps in the disengagement-to-departure process.

The Two Distinct Phases of Employee Departure
Dr. Lee points out that there are two distinct phases that occur between the moment an employee starts thinking about leaving and the employee’s last day. Phase 1 is the time that passes between an employee’s first thoughts of quitting and the actual decision to quit (“I’m outta here!”), which Dr. Lee calls the “deliberation phase.” Phase 2 is the time between the employee’s decision to leave and the actual leaving—the “action phase.” In this phase, the employee begins updating the resume; telling friends he or she is looking; and checking online job listings (often on company time), contacting recruiters, applying for other jobs, and interviewing.
The following brief comment from a post–exit survey respondent gives us a glimpse into how the cognitive, but emotionally charged, deliberation process begins and evolves: “After the merger I gave it a year to see what the company would be like, and I tried to keep my attitude positive, but things were no different, so I started looking.” Another departed employee said that he actually first started thinking of leaving after he was promoted and no letter went out announcing the promotion, which he took as a personal slight. Things went downhill from there:
I first started thinking seriously about leaving later, when I asked for more responsibility and was turned down. What made it even tougher to take was the fact that I had left my wife and family behind for a year to work abroad for the company. I felt they owed me a new opportunity. But, instead of getting the job I wanted, I was transferred to another department. That’s when I made the decision to leave.
In reviewing the comments of exited employees, it is easy to see a “last straw” phenomenon in many cases, as they reveal what pushed them over the edge from deliberation to action:
![]() “I wasn’t being challenged. And then I came across payroll information while doing some project costing and discovered that I was paid less than 15 percent less than everyone else in my group. That was the turning point.”
“I wasn’t being challenged. And then I came across payroll information while doing some project costing and discovered that I was paid less than 15 percent less than everyone else in my group. That was the turning point.”
![]() “I was happy there two years ago, but my manager left and my new manager was not a good mentor or coach. She was just coasting to retirement, but she was moody and unprofessional. And then one day she yelled at me. I went to her manager about it, but she just excused her behavior, saying ‘That’s just the way she is.’ That was the last straw for me.”
“I was happy there two years ago, but my manager left and my new manager was not a good mentor or coach. She was just coasting to retirement, but she was moody and unprofessional. And then one day she yelled at me. I went to her manager about it, but she just excused her behavior, saying ‘That’s just the way she is.’ That was the last straw for me.”
![]() “My head of our department changed and I felt the new one didn’t seek my input or recognize my contributions. Then, the work started becoming more administrative than technical. I felt like I was just shuffling papers and not designing anything. That’s when I started looking elsewhere, and a co-worker referred me to the company I now work for.”
“My head of our department changed and I felt the new one didn’t seek my input or recognize my contributions. Then, the work started becoming more administrative than technical. I felt like I was just shuffling papers and not designing anything. That’s when I started looking elsewhere, and a co-worker referred me to the company I now work for.”
Dr. Lee’s studies have shown that 63 percent of all employee decisions to leave are precipitated by a “triggering event,” or turning point of some kind, such as:
Realizing they are underpaid compared to others doing the same job
Realizing they are not in line for promotion
Being pressured to make unreasonable family or personal sacrifices
Being asked to perform a menial duty (e.g., clean bathroom, go shopping for the boss)
Petty and unreasonable enforcement of authority
Being denied request for family leave
A close colleague quitting or being terminated
A disagreement with the boss
A conflict with a co-worker
An unexpectedly low performance rating
A low pay increase or no pay increase
Being passed over for promotion
Realizing the job was not as promised
Learning that he or she may be transferred
Replacement of the hiring boss with new boss the individual doesn’t like
Being asked to do something unethical
An incident of racial discrimination or sexual harassment
Learning a leader is doing something unethical
Some additional interesting findings reported by Dr. Lee are that relatively few triggering events are pay-related. About 20 percent of departing employees leave without having another job in hand. Temporary, part-time, and marginal workers are more likely to quit suddenly or impulsively after experiencing a triggering or shocking event. Lastly, many employees keep an eye out for other jobs while working, and they decide to interview for outside opportunities just for practice, to create a “plan B,” or to test their marketability.3
In my own research into why and how people leave their jobs,4 I have some findings of my own to report:
![]() The triggers that caused respondents to start thinking of leaving were mostly push factors that the organization could have taken steps to address before it was too late. About 53 percent said their decision to leave was motivated primarily by their job dissatisfaction, while only 10 percent reported that their decision was motivated mainly by an outside offer. The remaining 37 percent said their decision to leave was based on a combination of push and pull factors.
The triggers that caused respondents to start thinking of leaving were mostly push factors that the organization could have taken steps to address before it was too late. About 53 percent said their decision to leave was motivated primarily by their job dissatisfaction, while only 10 percent reported that their decision was motivated mainly by an outside offer. The remaining 37 percent said their decision to leave was based on a combination of push and pull factors.
![]() Pay was the deciding push factor for only about 12 percent of survey respondents. While most of us believe we should be paid more, some people really are underpaid compared to similar positions in their industries or within their companies. “Pay not based on performance” and “unfair pay practices” were also frequently mentioned as push factors.
Pay was the deciding push factor for only about 12 percent of survey respondents. While most of us believe we should be paid more, some people really are underpaid compared to similar positions in their industries or within their companies. “Pay not based on performance” and “unfair pay practices” were also frequently mentioned as push factors.
![]() Disappointment with senior leaders was the number-one push factor cited as the major motivation for leaving. In the post-Enron, post–Wall Street collapse era, it is not surprising that employees might be more jaundiced and inclined to lose faith in senior leadership. And as we know, senior leaders’ decisions and mindsets either determine or influence most other push factors, such as insufficient pay, lack of work-life balance, unhealthy or undesirable culture, excessive workload, uncertainty about the future of the company, lack of open communication, and pay not based on performance.
Disappointment with senior leaders was the number-one push factor cited as the major motivation for leaving. In the post-Enron, post–Wall Street collapse era, it is not surprising that employees might be more jaundiced and inclined to lose faith in senior leadership. And as we know, senior leaders’ decisions and mindsets either determine or influence most other push factors, such as insufficient pay, lack of work-life balance, unhealthy or undesirable culture, excessive workload, uncertainty about the future of the company, lack of open communication, and pay not based on performance.
![]() Most survey participants experienced a turning point or “last straw” in their final decision to leave. Almost 60 percent said they experienced such a triggering event.
Most survey participants experienced a turning point or “last straw” in their final decision to leave. Almost 60 percent said they experienced such a triggering event.
Some of their verbatim comments include:
“Being told that my best skills were the ones I needed to work on”
Some of their verbatim comments include:
“Seeing an unethical manager be promoted”
Some of their verbatim comments include:
“Company owner swore at a customer in an open Internet forum”
Some of their verbatim comments include:
“Promotion denied; found out that boss did not even show up to promotion meeting”
“The arbitrary termination of half of the employees within one week”
“Obvious favoritism to co-worker”
“Berated by SVP who made me feel incompetent for making a small mistake”
“Incidents in which good people were fired and destructive people were promoted”
“Was directed to break federal law and commit crimes”
Some other findings include that 65 percent who voluntarily left did so within one year of starting to seriously consider leaving. And 71 percent of employees surveyed said they were giving less effort on the job during the period they were thinking of leaving. Likewise, 77 percent reported that they were looking for another job while still employed, and 66 percent had already accepted another position when they resigned. About two-thirds felt that their employers could have taken some action to make them change their minds and stay.
To Reverse Disengagement and Turnover, Watch for the Signs
As you might expect, the chances of a manager’s re-recruiting and successfully gaining renewed commitment from an employee during the action (job-seeking) phase are greatly reduced. This is why it is important for managers to be alert to the signs that an employee is just starting to disengage—when there is still time to do something about it.
So, what can managers do about it? First, and most important, they can observe the signs—some subtle and some not so subtle—that employees are in the downward spiral of disengagement and possible departure. There are three kinds of signs to watch for: behavior-based, event-based, and data-based.
Behavior-Based Signs of Departure
Employees’ nonverbal behavior is the most basic and easiest of the three kinds of signs to observe. All that’s required is for managers to get up, get out, and walk around, and open their eyes and pay some attention to their direct reports. Here are some common signs that an employee may have experienced a triggering event and is thinking of leaving, or at least starting to disengage:
Avoids eye contact
Stops smiling or greeting
Gives less energy and effort
Arrives later
Has bursts of anger or frustration
Participates less in meetings
Exhibits passive noncompliance
Exhibits active resistance
Is absent more often
Misses deadlines
Applies for other jobs internally
Increases community involvement and networking
Event-Based Signs of Departure
Some event-based signs may not indicate that the employee is disengaged, but they may nevertheless precipitate thoughts of leaving. The following types of triggering events are not preventable and exert more of a pull on the employee:
Marriage
Pregnancy
Inheritance
Personal or family health crisis
Spouse or partner having job opportunity in another city
Reaching eligibility for retirement benefits
Last child leaving home
Paying off the mortgage
Acquiring a company
If an employee is already somewhat disengaged or dissatisfied with some aspect of the job or environment (push factor), a pull factor such as one of those listed above may be just the nudge he or she needs to move on. Yet, when asked in exit interviews why they are leaving, these employees, not wanting to burn a bridge, are more likely to offer the pull factor as the main reason rather than divulge the contributing push factor. As a result, many root causes of turnover remain hidden and unresolved.
Other triggering events are clearly more of the push variety and are definitely preventable:
Conflict with manager
Being ignored or discounted by manager
Manager leaving, getting new manager Valued co-worker leaving
Conflict with co-worker
Being passed over for promotion
Career advancement being stalled or blocked
Loss of confidence in senior leaders
These kinds of events may be the most difficult for managers to see or acknowledge, as the managers may, in fact, be the root of the problem.
Data-Based Signs of Departure
The third kind of sign that may help in anticipating employee disengagement and turnover is available to us by reviewing data typically kept in human resources records. Like all signs and indicators, any one or two of the following data points may be meaningless, but when combined with others from the first two categories, they may add up to a flashing red light:
Absenteeism record
Tardiness record
Vacation days not taken
High turnover in the employee’s demographic group, type of position, or location
Declining performance ratings
Survey data showing low levels of engagement in employee’s unit
Employee being paid less than others at same level
Employee having longer than average tenure in same position
Being at or approaching historically high-turnover tenure “window” (e.g., second or third year)
Having had short tenure at previous employers or in previous jobs
Employee having record of frequent internal job postings
Employee not having received performance review
Employee having record of filing employee relations grievances
This list is not comprehensive, but it is representative of the kinds of data that may be available from one company to the next, depending on company size, and the availability and relative sophistication of HR information systems. An important advantage of HR data is that they can also help pinpoint trends indicating that groups of employees in various job categories, geographic locations, or under the supervision of certain managers may be at risk.
Can We Really Predict Turnover?
As Yogi Berra supposedly remarked, “Predicting is hard … especially about the future.” We need all the help we can get in predicting whom to hire, much less who will stay. But this is still not a science. Theoretically, a manager could assign points to all the warning signs for a given employee, then add them up to see which ones fall into yellow, orange, and red alert groups. The logical next step would be for the manager to sit down with employees in the red-alert category first—assuming, of course, that the manager wants to keep them and cares enough to keep them engaged. If so, Figure 4.15 may be a helpful tool for diagnosing which employees may be most at risk of leaving.
It should be noted that B performers are valued, steady, and not dispensable—and are well worth your efforts to keep and engage them. So are many C performers, who have simply been placed in the wrong jobs, mismanaged, or undercoached. To use the chart, simply list the names of your direct reports in the appropriate boxes, based on your evaluation of their performance and how at risk of disengaging or leaving they may be, based on your awareness of the signs presented here.
As an example, suppose you have noticed that Joe, one of your A performers, has stopped sending you e-mails in the last two weeks and has stopped speaking up in meetings. You began seeing these changes the day one of Joe’s closest peers left the company. Joe has been working sixty to seventy hours a week to meet a critical project deadline and has not taken a vacation in two years. So, is Joe a high or a medium risk? It probably doesn’t matter. What matters is that you care enough to notice and have a talk with Joe.
All managers of people need to keep their antennae up for signals that a valued employee may have experienced a disappointing shock or a gradual accretion of last straws. Because it is often hard to read the feelings of employees from the looks on their faces, and managers are sometimes too busy to read every available sign, they should simply have regular check-in meetings with their direct reports.
Figure 4.15. Disengagement diagnostic matrix.
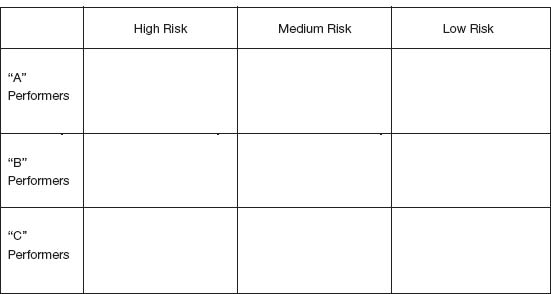
Many employee disengagement-and-departure cycles can be reversed if managers will only care enough to sit down with the employees at some point in the hidden-from-view deliberation process and say the following: “I value you as an employee and want to keep you. How are you feeling about things in general?” That simple question may well open a discussion that can lead to a resolution of the precipitating issue.
When you consider the gradual, unfolding nature of employee disengagement, there can be but one conclusion—there is urgent need to initiate discussions and actions to engage and reengage employees, and the daily opportunity to do so is ever present. The good news is that most valued employees can be reengaged and retained with the right kind of attention, concern, and willingness to take action. But first you have to see the signs.
Notes
1.Leigh Branham, The 7 Hidden Reasons Employees Leave: How to Recognize the Subtle Signs and Act Before It’s Too Late (New York: AMACOM, 2005).
2.Thomas W. Lee et al., “An Unfolding Model of Employee Turnover,” Academy of Management Journal 39 (1996), 5–36.
3.Ibid.
4.Data based on my ongoing analysis of almost 300 post-exit surveys, conducted on my Web site, http://www.keepingthepeople.com/surveyStart.cfm.