The HCM:21® Model: Summary and Samples
In today’s unpredictable market, the CEO mandate is to grab competitive advantage. The focus has shifted from cost reduction to top line growth, excellence in execution, and acquiring top talent. To accomplish this goal, executives are looking for new paths and new resources to exploit the next cycle’s growth opportunities. Clearly, the asset with the greatest value potential is human capital.
Despite ongoing market transformations, very little has changed in the “people game.” Organizations still operate in silos distinct from and largely disconnected from each other. Although computer technology has made human capital management more efficient, it has not delivered strategic value because we have not changed our management model. In essence, there has been no seminal shift in the way we manage people. We desperately need to revitalize human capital management.
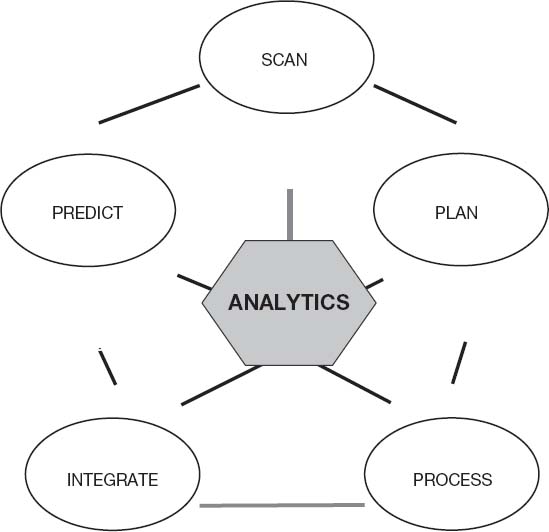
Now, for the first time, you have an opportunity to make a quantum leap in human capital management. Presented here is the model we call HCM:21, or human capital management for the twenty-first century. This breakthrough model was developed over a period of eighteen months by the Predictive Initiative, a consortium of major corporations, vendors, and management associations committed to transforming HR into a strategic function. HCM:21 is not a human resources program. It is both a management model and an operating system. The model identifies mission critical organizational issues and entities. Then it operationalizes how they align, are interdependent, and need to be integrated. An outline of the model is shown in Figure A.1.
Following are the steps essential to this model:
A.The Strategic Scan
B.Capability Planning
C.Process Optimization
D.Integrated Delivery
E.Predictive Measurement
F.Analytics
Included here are sample forms corresponding to these steps that should make your realization of the model clear.
A. The Strategic Scan
Human capital management typically starts with workforce planning. Planning compares business plan staffing requirements with internal and external labor pools. From there a strategy is developed for filling gaps in the workforce. Although the marketplace is continually undergoing radical change, quite often there is no change from past practices. Before you can plan future human capital investments, you need to understand all aspects of the market. This includes competition, technology advancements, and regulations, as well as economic, political, and human capital trends. This is why the external and internal scan is essential. HCM:21 is launched with a strategic scan of external forces and internal factors that might affect the three fundamentals of the organization: human, relational, and structural capital, shown in Figure A.2.
Figure A.1. The HCM:21® model.
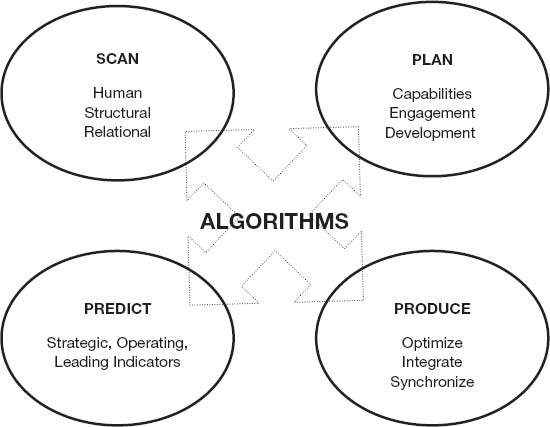
Samples of how and where these forces and factors might affect your organization follow as Forms A-1 through A-6. Most important, they remind you that problems in one of the sectors of the organization usually affect the other sectors. Technology investments usually require training of operators. Economic downturns and upturns change the interactions between human and relational capital and often demand structural investments. The English metaphysical poet John Donne said, “No man is an island, entire of itself; every man is a piece of the continent, a part of the main.” This is also true of organizational entities and functions. Here is your first encounter with the inherent integration of organizational activities.
Figure A.2. Template for a strategic scan.
The Strategic Scanner
The Strategic Scanner is a series of six forms or templates to use in completing the strategic scan. There are basically four types: (1) a detailed corporate-wide survey and identification of external and internal factors; (2) an equivalent survey and identification performed on a function or department level and covering both external and internal factors; (3) an identification and review of the corporate vision, mission, and values; and (4) an analysis of corporate objectives and initiatives.
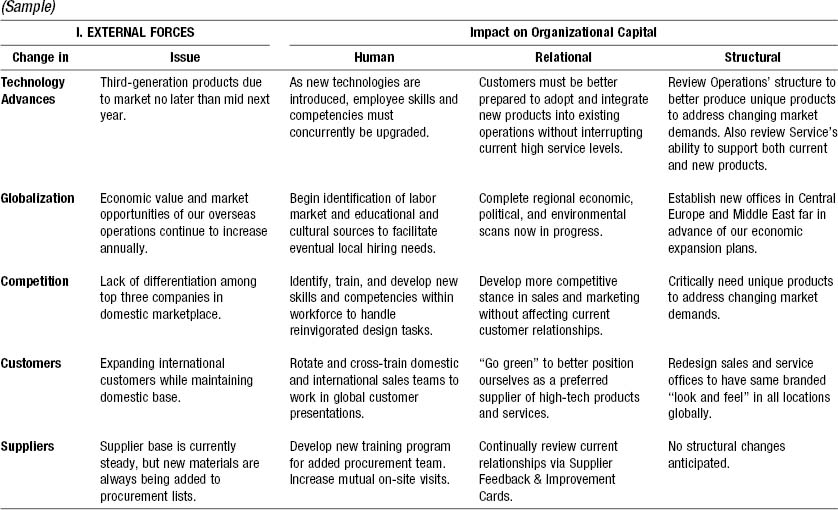
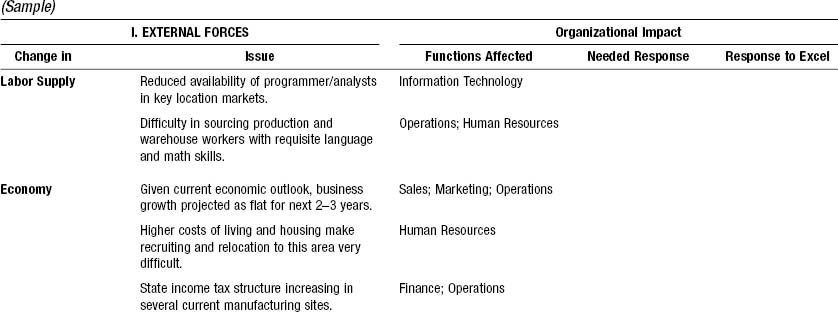
Instructions and Comments: External Forces (A-1)
External Forces are elements outside your company that you believe will have a present or future effect on your organization. This template sample has a general starter set of External Forces, and you may delete these and/or add others as you see fit.
First, identify issues that will arise as a result of External Forces. Describe them in a few key words or phrases and enter onto the spreadsheet templates provided here. All key issues should be clearly identified, but not all impact cells have to be filled in. Consider primarily those significant issues or forces that will demand attention across the entire organization. Second, to give the scan consistent structure, link the issues to your organization’s three forms of capital: human, structural, and relational:
![]() Human capital is your employees and active contingent workers.
Human capital is your employees and active contingent workers.
![]() Structural capital is essentially things that you own, ranging from facilities and equipment to intellectual materials, codified processes, patents and copyrights, and IT software.
Structural capital is essentially things that you own, ranging from facilities and equipment to intellectual materials, codified processes, patents and copyrights, and IT software.
![]() Relational capital is working knowledge of and relationships with outsiders including customers, suppliers, competitors, regulators, and communities in which you do business.
Relational capital is working knowledge of and relationships with outsiders including customers, suppliers, competitors, regulators, and communities in which you do business.
This corporate-level scan forms the basis for subsequent forms at the departmental or functional levels to link consistent plans and objectives throughout the company. Each level must react to these forces and issues in ways that keep the organization aligned and internally integrated. See the sample response provided here.
A-1. STRATEGIC SCANNER–External Forces
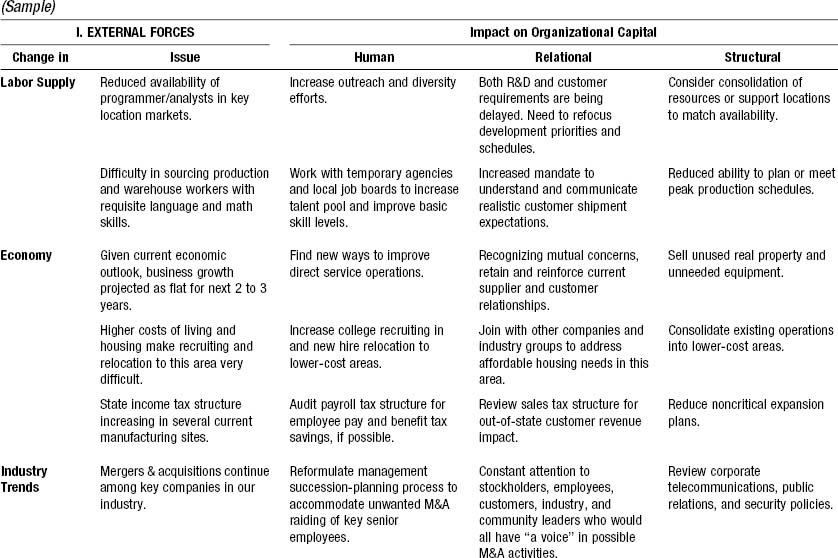
A-1. STRATEGIC SCANNER–External Forces (Continued)
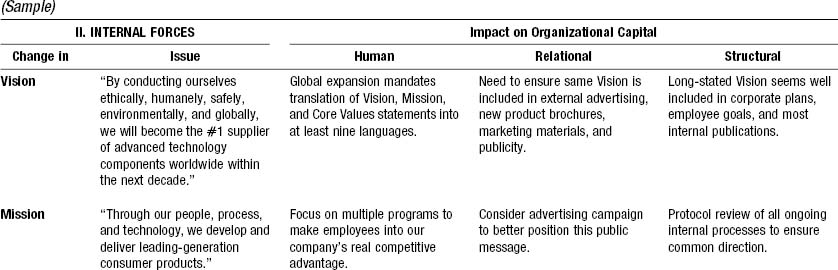
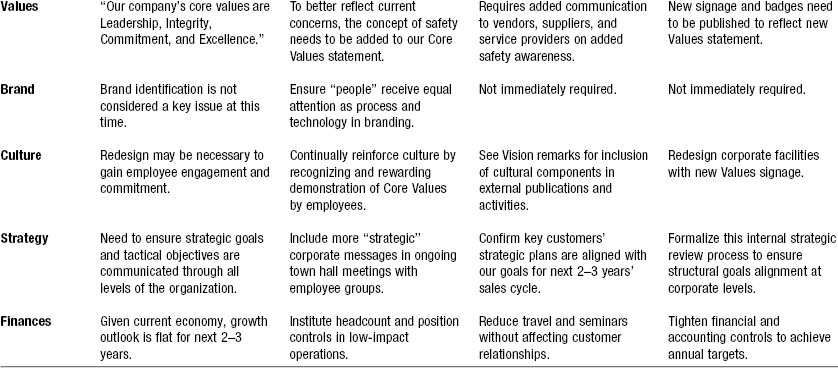
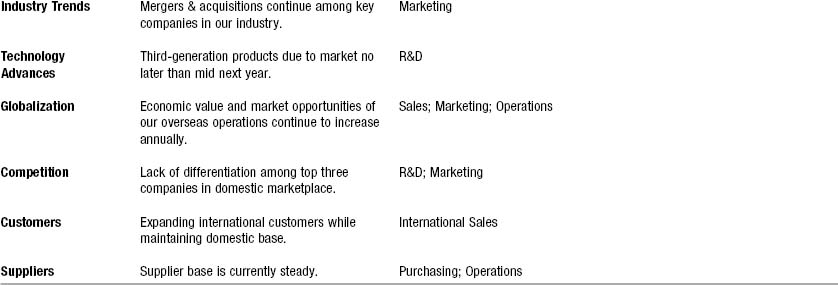
Instructions and Comments: Internal Forces (A-2)
This corporate-level scan of internal forces follows the same directions as those for the external scan. It is a general starter set of forces; you may delete some of these and/or add others as fits your situation. When this strategic scan is completed at the corporate level, it can be recreated at the divisional or department level as appropriate.
Organizational Analysis and Response
Instructions and Comments: External Forces (A-3)
To prepare this stage, copy the entries in the “Change in” and the “Issue” columns from the Strategic Scan to the “Change in” and “Issues” columns on the A-3 template. This ensures consistent consideration of all uses when multiple sheets are used by different functions or departments. Then, decide which functions or departments are primarily affected by these issues. You need to supply a “Needed Response” for each “Issue.” The “Response to Excel” column is for listing “stretch factors” that are designed to achieve true excellence
Optional: This sheet can be duplicated, so that each function and/ or department receives a copy for local completion. Responses are then merged for the corporate summary.
Instructions and Comments: Internal Factors (A-4)
Obtain current or revised corporate statements from the Vision, Mission, and Values sheet (Form A-5) and insert in Form A-4, as done for the external forces.
Corporate Vision, Mission, and Values
Instructions and Comments
Form A-5 should be completed by the chief executive officer or senior leadership team. Review these current vision, mission, and values statements and amend or modify as needed. Determine what current or future actions may be taken at corporate level to better commit to, communicate, and implant these positions in the corporate culture.
When completed, provide copies to the functions or departments for their individual organizational analyses and responses.
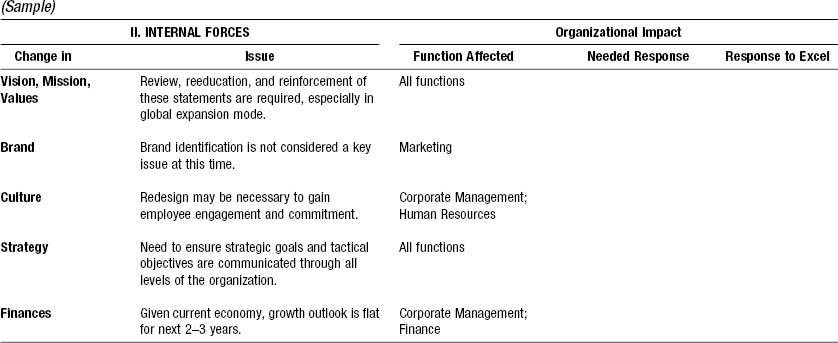
Corporate Objectives and Initiatives
Instructions and Comments
Form A-6 should be completed by the officer or senior leadership team. These are key initiatives described at the corporate level. More detailed goals and objectives are covered in the function- or department-level form. See B-1.
A-2. STRATEGIC SCANNER–Internal Forces
A-3. ORGANIZATIONAL ANALYSIS AND RESPONSE–External Forces
A-4. ORGANIZATIONAL ANALYSIS AND RESPONSE–Internal Factors
A-5. VISION, MISSION, AND VALUES

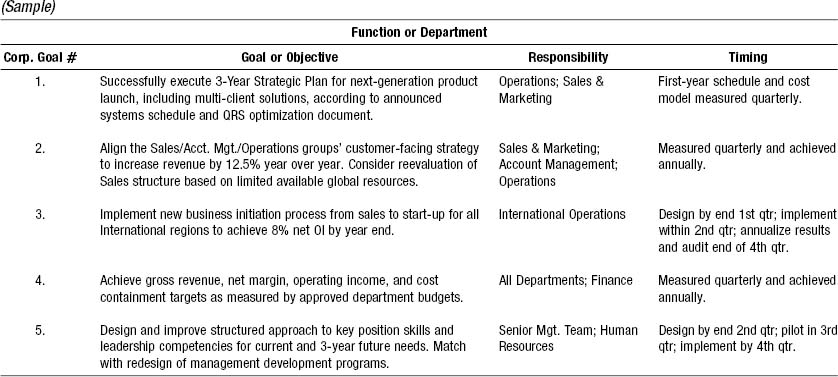
A-6. CORPORATE OBJECTIVES AND INITIATIVES
Review current corporate objectives and initiatives, and amend or modify as needed. It is recommended that you limit this to five key strategic objectives. After the form is completed, provide this review of corporate objectives to the function/department groups to obtain information that will be used in the delivery planner that follows in step D.
B. Capability Planning
Once the scan is completed, you have the foundation for an advanced workforce-planning process. Rather than continue to apply an industrial-era model, filling holes with interchangeable bodies, now you can think in terms of building capability for the intelligence age in which we function. The strategic scan told you who and what you have to compete with and where your internal process and structures might need recalibration. Now, you can start building capabilities across essential functions.
Capability Planning Worksheet
Instructions and Comments (B-1)
This section begins the workforce analysis process, both current and future. The first step is to divide the workforce into four categories in terms of their valued capabilities:
1.Mission critical—essential to survival
2.Unique—market differentiators
3.Important—operational necessities
4.Movable—outsource or eliminate
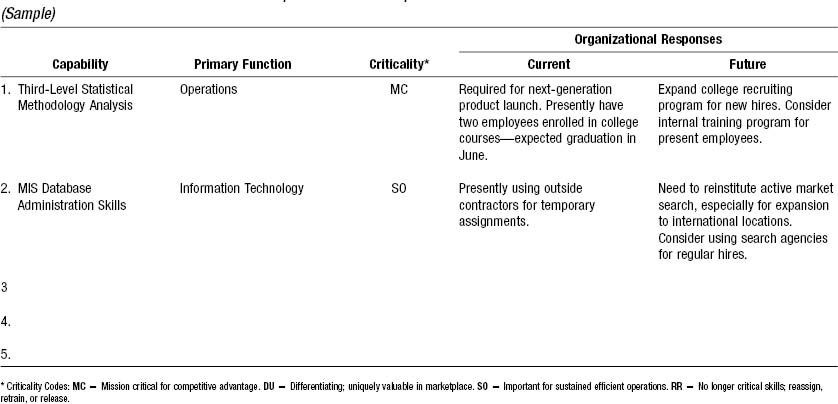
After reviewing the “Change in” entries on the Strategic Scanner sheets and the “Needed Response” listings on the Organizational Analysis and Response sheets, list the key “Capabilities” required for organizational success on the Capability Planning sheet (see B-1). Designate the “Primary Function(s)” needing those skills, abilities, or expertise; or indicate the “Organizational Responses” to meet such needs. Then outline the responses that may be immediately taken (tactical measures) and those longer-range responses to be considered (strategic initiatives).
Optional: This B-1 form may be duplicated, then assigned to individual functions or departments for completion.
B-1. CAPABILITY PLANNING–Function- or Department-Level Responses
Succession Planning
Once the capability planning is completed, you follow with our advanced succession planning system. This system is built around five principles:
1.Assigning a senior line executive the primary responsibility of managing the system
2.Identifying high potential (Hi-Po) personnel as far down the organization as possible
3.Designing personal growth programs and reviewing and updating the Hi-Po list at least annually
4.Monitoring advancements and their effect on mission accomplishment and revenue growth
5.Ensuring the development plans are aligned with strategic business plan and corporate KPIs
When you have at least 75 percent of your Hi-Po candidates’ development programs fully operational and their replacements ready, you should see a rise in revenue growth per FTE and mission fulfillment. The reason for this is that your Hi-Pos are the key people who drive overall performance.
C. Process Optimization
It is natural to fall into a routine, unquestioning way of running a process. That’s why periodic process analyses can greatly increase both efficiency and effectiveness. This can be used in any process analysis, in any function. In human resources, it can be applied to hiring, compensation, development, or retention.
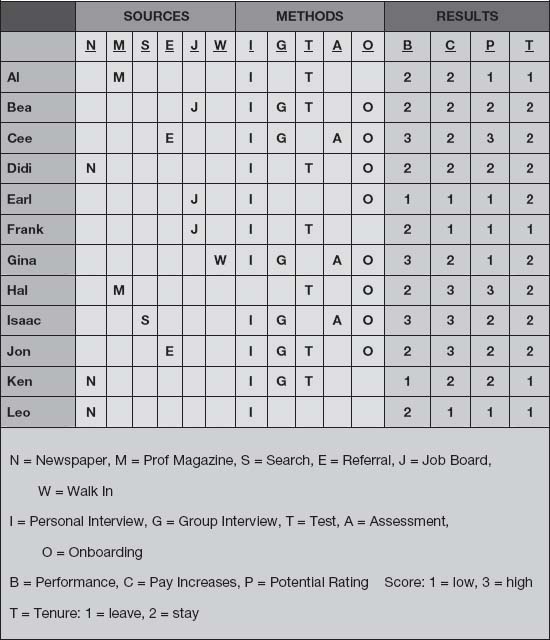
For example, one human capital management application is staffing. In any process there are inputs, throughputs, and outputs. In staffing, the inputs are job applicants who come through a variety of sources, such as advertising, job boards, agencies, and employee referrals; throughputs are the selection and orientation methods you use, such as individual and group interviews, testing, assessment, or onboarding; and outputs are new hires who can be evaluated in terms of performance (B), salary progression (C), growth potential (P), tenure (T), or other outcomes.
For example, a dozen people in a selected mission-critical job group were hired two years ago. The end goal was to learn which combination of sources and methods yielded the best hires for this job group. Findings of past experiences with hiring and retention were compared to the strategic scan and the planning data. This established a base upon which to build a staffing strategy for the future. The result of this work led to cuts in the cost of sourcing and improvements in the hit rate for exceptional hires. It clearly demonstrates the added value achieved by a solid staffing strategy and clear-cut methods. In Figure A.3, you can see which combination of source and method yielded the best results. From this it is possible to see which sources produced the high performers, as well as which attracted people who stayed. The figure also shows the correlation between onboarding (O) and tenure (T). When you have a very large work population, you will need to apply the sample algorithm that is included in the HCM:21 package.
Figure A.3. Process optimization.
Process Optimizer: Staffing Process Analysis
Instructions and Comments (C-1)
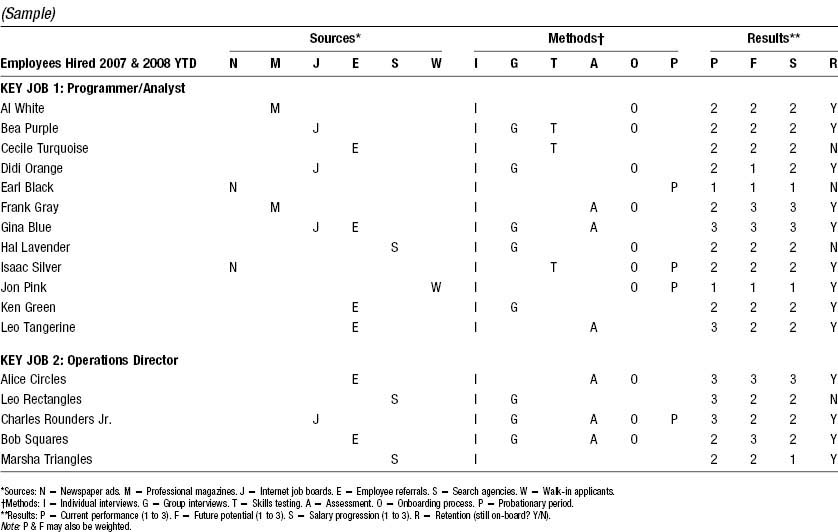
Form C-1 helps you consider what may be the most effective recruiting methods you are currently using to source those key jobs or competencies identified by this survey. Under “Key Job,” list each person hired during the relevant period. (Coded names and ID numbers may be used for privacy purposes.) For each individual, consider his or her primary recruiting source and onboarding methods. The methods listed are suggestive and others may be added to better reflect your organization’s programs. Then evaluate each person’s performance, potential, progress, and tenure to date. For a job group, look for patterns that are most effective, cost-efficient, and performance consistent in finding suitable candidates and in retaining higher potential employees.
Optional: This sheet may be duplicated to allow each key job to be listed on a separate page.
Process Optimizer: Training Process Analysis
Instructions and Comments (C-2)
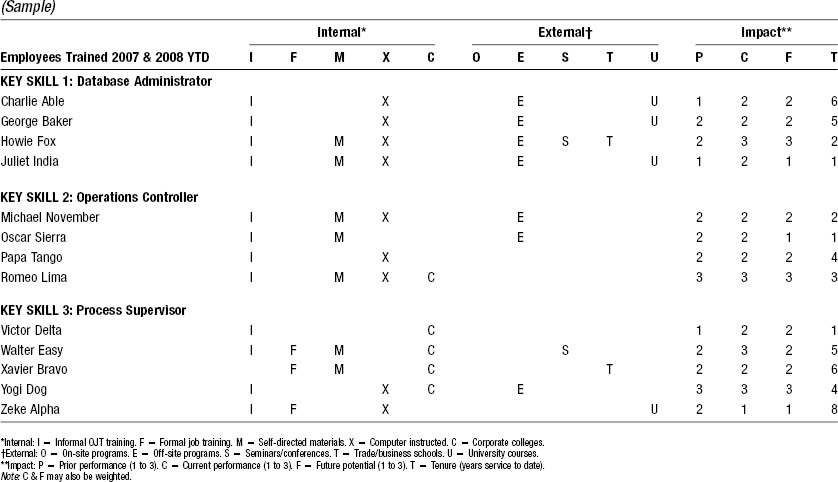
Form C-2 helps you consider what may be the most effective training methods you are currently using to develop employees in those key jobs or competencies identified by this survey. Under “Key Skill,” list each person trained in the relevant period. (Coded names or ID numbers may be used for privacy purposes.) For each individual, consider whether internal or external training is used or programs are attended. The methods listed are suggestions; others may be added to better reflect your organization’s programs. Then evaluate each person’s performance prior to and after the training, and the impact of that training on the individual’s potential and continued tenure. As a skill group, look for patterns that show effective, efficient, and consistent improvement in performance and potential of employees trained by different methods.
Optional: This sheet may be duplicated to allow each key skill to be listed on a separate page.
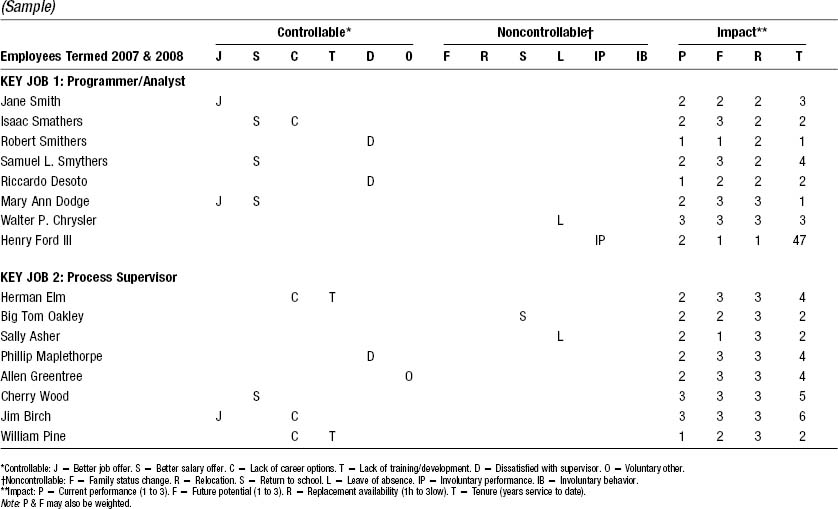
Process Optimizer: Turnover and Loss Analysis
Instructions and Comments (C-3)
Form C-3 helps you consider what may be the common causes of controllable and noncontrollable turnover and its impact on the performance of the organization or the key competencies identified by this survey. Under “Key Job,” list each person who left the company during the survey period. (Coded names or ID numbers may be used for privacy purposes.) For each individual, consider his or her primary reason for employment termination. The reasons listed here are common and are used to differentiate between controllable and noncontrollable terminations. Then evaluate each person’s performance, potential, ease of replacement, and tenure. As a skill group, look for patterns that may be effectively addressed, especially those considered controllable.
C-1. PROCESS OPTIMIZER–Staffing Process Analysis
C-2. PROCESS OPTIMIZER–Training Process Analysis
C-3. PROCESS OPTIMIZER–Turnover and Loss Analysis
Optional: This sheet may be duplicated to allow each key skill to be listed on a separate page.
D. Integrated Delivery
This step has three sections.
Integrated Delivery Planner: Corporate Objectives, by Function or Department
Instructions and Comments (D-1)
This sample is for a human resources department. The sheet should be duplicated for separate completion by each major function or department in the organization. The corporate objectives have been developed by the officer or senior staff during the Corporate Objectives and Initiatives phase of this process. They should be copied directly from Form A-6 onto this form.
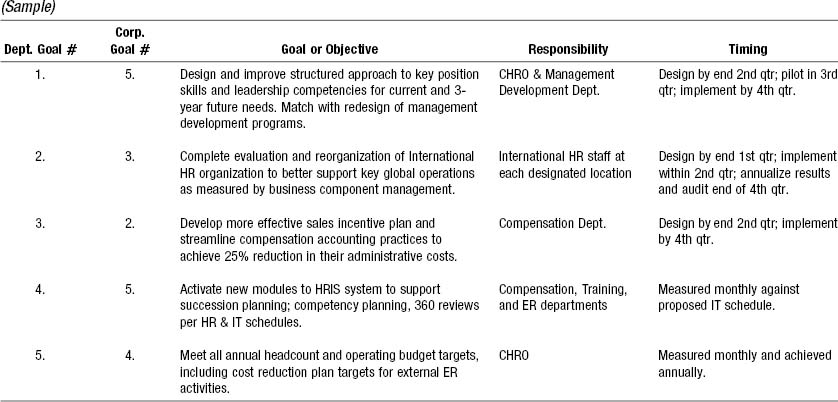
Integrated Delivery Planner: Key Goals for Function or Department
Instructions and Comments (D-2)
The function’s or department’s key goals are listed here and cross-referenced to the corporate goal number that they support.
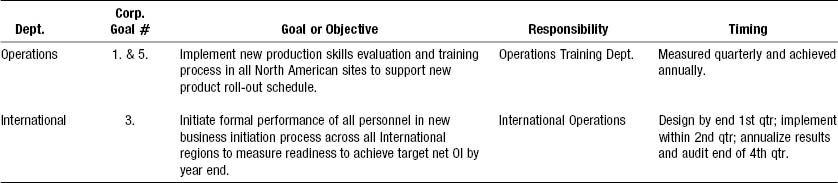
Integrated Delivery Planner: Related Department Goals
Instructions and Comments (D-3)
Key related or support goals from other functions are listed here and cross-referenced to the corporate goal number.
D-1. INTEGRATED DELIVERY PLANNER: CORPORATE OBJECTIVES, BY FUNCTION OR DEPARTMENT
D-2. KEY GOALS FOR FUNCTION OR DEPARTMENT
D-3. RELATED GOALS FROM OTHER FUNCTIONS OR DEPARTMENTS
E. Predictive Measurement
Today, many HR departments are engaged in some type of measurement. The problem is that most of them have not moved past measuring internal cost and quantity level. Typical metrics are cost, numbers hired and trained, ratios of HR staff to employees, and HR budget benchmarks. These can be useful measures of HR efficiency; however, the numbers do not interest management because they focus on costly HR activities and not on value-adding business results.
Modern analytic tools and behavioral science methods support higher levels of analysis. For example, you can dig into your turnover rates and discover what is causing them to rise or fall. You can track the return on investment of many HR services from incentive pay plans and training offerings, to staffing, engagement, and retention strategies. These numbers address the issues that drive the current business operation. As such, they attract management’s attention because they show value added.
The latest and most exciting measurements are the leading indicators and intangible metrics. These predict what is most likely to happen in important future events. With these data points, the C-level executives can strategize and invest with minimum risk. Given the volatile markets today and into the future, risk management is at the core of human capital investment. High degrees of success yesterday do not guarantee similar returns tomorrow.
Lagging and Leading Indicators
Most data generated by companies lag, reflecting past periods. Accounting, production, sales, customer service, and other factors including human resources regularly report on yesterday. While this information can be useful for review, it does not lead directly to the future, and extrapolating old data into the future is a risky business. To manage for tomorrow you need new metrics that are inherently predictive. We call these leading indicators.
A number of factors can be turned into leading indicators: Readiness, Capabilities, L&D Return on Investment, Loyalty, Culture, Leadership, Absenteeism, Innovation, Brand, Retention, Engagement, and Reputation. Note that most of these indicators are intangible. With experience, you learn to see patterns in data that are predictive of the future. Measures of management bench strength, or readiness, are certainly indications of the organization’s ability to transition smoothly to new leadership tomorrow. This is why the HCM:21 model is referred to as “Managing tomorrow, today.” Likewise, employee opinions regarding their leaders have been shown to be valid signs of future retention or attrition. In addition, lagging indicators often can be reverse-engineered and turned into leading indicators. For example, metrics such as absenteeism and retention are predictive of future attrition and low productivity. Similarly, the practice of counting units of past performance is no longer sufficient; now you have to look over the horizon, using data that have predictive capability.
Metrics Evaluation
Instructions and Comments (E-1)
These are suggested topics for your development of relevant benchmarks, strategic initiatives, or corporate direction to facilitate predictive metrics. Evaluation should be made against SMART targets that clearly define proactive and positive movement from current status toward the corporate future state outlined via this survey process. SMART targets are marked as S = Specific, M = Measurable, A = Actionable, R = Realistic, and T = Time-bounded.
E-1. METRICS EVALUATION
| SMART TARGETS | |
| A. Strategic-Level Metrics | |
| Sample SMART Target: | |
| Revenue per FTE HCROI HCVA Brand Recognition Market Reputation R&D Spend |
“Achieve gross revenue of $250,000 per full-time equivalent employee (FTE) measured corporate-wide by year end 2008.” |
| B. Operational Metrics | |
| Hiring Effectiveness Competitive Total Compensation Training & Development Retention & Commitment Management Tenure Key Worker Turnover |
|
| C. Leading Indicators and Intangibles | |
| Leadership Culture Engagement Competency Readiness Succession Readiness Technology Innovation |
F. Analytics
Business intelligence tools have been adopted by finance and marketing, but they are seldom applied to human capital management. With the HCM:21 model you can statistically analyze connections across various human capital functions and outcomes. In the past scanning, planning, processing, and measuring were distinct functions. Now, with alignment and integration as your foundation, you will find relationships hidden in the data. By applying various multivariate techniques you can see both inside and across functions.
In section C, Process Optimization, you saw the connections among sources, methods, and results. You can find similar connections between processes and the external/internal variables developed in the Strategic Scan (section A). For example, market factors such as a depressed economy focus management’s concern on customer service so as to retain customers. Service incentives are developed (compensation), recruiting service-oriented people becomes an imperative (staffing), and training in customer service is required (development). When these responses are monitored, you are able to track the effects on customer retention, presumably leading to greater market share.
Likewise, across almost any human capital intervention, you should be able to find correlations with operational improvements (PIQS) in production, supply chain management, and customer service. Eventually, these correlations lead to cost reductions, shorter time to market, increased sales, higher gross margins, faster response time to customers, and quicker resolution of their problems.
Barriers to Achieving a New Human Capital Management Approach
The logic has always been there. Operationally, the barrier to HR change has been the weak alignment across functions—relationships that were either never truly established or quickly broke down. Also, within units, services have not been integrated well. Siloed subdivisions are inherently not only inefficient but also obscure natural connections and breed parochialism.
There is no longer any excuse for such operational failings. We have the knowledge of the behavioral sciences, as well as the statistical tools and computer power to link activities. With predictive management, you have a tested, practical, strategic model and operating system. Making connections, finding value, and calculating return on investment are simple operations with HCM:21. Figure A.4 illustrates the concept.
Changing the Game
Continually working on process improvements and making additional investments in disconnected software can only keep you far back in the pack. The only way to break out, take the lead, and drive top line growth is to come up with an entirely new way of managing human capital. You can change your pace and pass your competitors by adopting a new offensive strategy called HCM:21, a model and a strategy that have been adopted by companies around the world.
Figure A.4. Connections through statistical analysis.