Chapter 14
Conduct Efficiency Analysis
In This Chapter
♦ Looking for waste
♦ Value-added/non-value-added analysis
♦ Inventory, queues, and batch sizes
♦ Balancing workloads
♦ Reducing setups and changeovers
♦ Dealing with bottlenecks
In practice, you never use purely Six Sigma approaches, and you never use purely Lean approaches. Yet when it comes to rooting out waste and analyzing inefficiencies, the Lean toolkit takes precedence. That’s why this chapter will focus almost exclusively on Lean approaches, techniques, and tools.
Lean tools are used to answer questions like: How many people do I really need to perform the work demanded by customers? What should management expect of the people in the process? How can I improve the flow of my processes? How much inventory is required to sustain flow in the process? Do I have enough equipment processing capacity to meet customer demand?
To answer these questions, we’ll get into some details of Value Stream Mapping, Takt Time analysis, inventory levels and Queuing Theory, Little’s Law, Kanban calculations, Workload Balancing, Standard Work combinations, equipment effectiveness, Fast Changeover, and Total Productive Maintenance. If all this sounds foreign, good. That means you’ll benefit from further reading.
Name That Waste
In chapters past, we touched on the twin Lean concepts of Flow and Pull. Flow is making sure your workloads are even and humming along at full utilization in a steady way. Pull is the dynamic by which you store, use, and produce what you need only when you need it, in real time ideally, or as close to this as possible.

Lean Six Sigma Lingo
Mura is when your operations flow unevenly and therefore aren’t utilized at their full capacity. Often mura is a root cause of muda, or waste. For instance, if you have too much inventory at any one time, it might be because your operations are not flowing well.
Muri is when your people or machines are overburdened and therefore cost you more time and money in the long run. Often muri is a root cause of muda, or waste. For instance, if your people are overworked, they might make mistakes that later have to be rectified with rework.
With this in mind, let’s take another look at the notion of waste, or muda, from its Japanese origin. The key at this stage of the game is to use various approaches to find and eliminate waste (and inefficiency). But before we get into the many ways this can be done, we should point out that muda is not the only form of waste you need to tackle. There are two other important forms as well: mura and muri.
Mura is unevenness in operations (poor Flow), and muri is the overburden of people or machines. If you focus only on muda, or waste reduction, then you might inadvertently create uneven flow or overburden people or machines. You don’t want this, because the goal of Lean Six Sigma is always to be as efficient as possible with the least amount of waste, rework, and variation.
For example, sometimes a company will artificially reduce materials just to meet inventory targets at the end of a quarter. They stop ordering the materials they need just to make a number. Doing this then greatly overburdens the organization, which works twice as hard at the beginning of the next quarter until they rebalance the supply. This also causes Flow issues as production starts and stops while the rebalancing occurs.
In other cases, organizations perform end-of-the-month miracles to meet schedules while ignoring maintenance schedules, incurring overtime, and compromising quality standards. While this feels good at the time (or not so good), there are consequences. While the customer is temporarily satisfied, your long-term ability to achieve good quality, perfect delivery, and lower costs is jeopardized.
Therefore, don’t just be a loose-cannon waste warrior. When you conduct your waste analysis, you have to understand the true causes of that waste. How can you ensure good Flow? How can you avoid overburdening your people and equipment? These are good questions to ask as you go about looking for and ridding waste.
Be systematic and recognize that, often, mura creates muri that causes muda. Only when mura and muri are under control will your efforts to take muda out of the process be effective. And sometimes unaddressed mura creates muri that undermines previous attempts to eliminate muda. If all this sounds confusing, good. You know you’ve still got a ways to go before you master the Lean Six Sigma Lingo.
Value Analysis
The opposite of waste is value, which we defined in previous chapters as activities that are necessary to transform inputs into outputs for which customers are willing to pay. When we say that an activity is value-added, we mean it’s absolutely necessary. For instance, squeezing juice out of an orange is value-added; the customer is willing to pay a price for that, and the business makes money doing it.
Other activities or steps in a process are non-value-added. This includes waiting time for people and materials, like when parts wait in a queue before their assembly. It includes the costs associated with storing excess inventory, and the time involved in changing over from one mode of production to another. Of course, rework performed to fix mistakes or errors is non-value-added, too.
We touched on the use of a Value Stream Map (VSM) in Chapters 6 and 7, and we gave the details of building a VSM in Chapter 10. Here we just want to mention that you use the VSM to identify opportunities related especially to such non-value-added activities as inventory levels, waiting queues, cycle times, setup times, processing times, wait times, customer demand rates, process yields, capacities, and numbers of people.
Examining Inventory Levels
Many Lean Six Sigma practitioners will talk about doing Kaizen Events to reduce or eliminate inventory. This is a good thing, but it’s dangerous because inventory issues are usually the result of other issues. Removing the inventory without first eliminating the sources of unevenness might pose delivery issues, and can create nervousness and resistance as the inventory security blanket is removed.
If you really want to reduce inventory down to its bare required minimum (which you do), then you’ll have to dig a little deeper. One way to do this is to “walk the process” to account for work-in-process inventories, as well as measure traditional warehouse inventories tracked by accounting. Work-in-process inventories are potential signs of bottlenecks, rework, products not in demand, poor ordering or scheduling, or hoarding items due to just-in-case, pseudo emergencies.

Lean Six Sigma Lingo
Work-in-process inventory is any materials or needed inputs that reside, virtually or physically, at different points in the process.
To minimize operational costs, you need to minimize the quantity of things (inventory levels) inside your process without putting your output in jeopardy. If you make the causes of problems go away, then inventory can be reduced. This includes such issues as long changeover times, poor work balance, unreliable quality, and frequent equipment failures. Ultimately, this all boils down to improving Flow, one of the five key Lean principles.
Queueing Theory
Queuing Theory is the mathematical science of organizing the flow of people, material, information, data, supplies, and other items through a process. Properly designed queues (or waiting lines/areas) create harmony because they create a constant flow and balance of whatever the process needs to perform its function.
Service operations build inventories of customers waiting for service (think long lines at a fast-food restaurant), or inventories of resources that are unused. Unlike production inventories, service inventories can suddenly disappear—that’s not always a good thing. Customers might give up on the service (abandon) and go to your competitor, or they might be blocked from the service (not enough bandwidth to handle the service). Manufacturing operations can build inventories of product, which often leads to increased damage or spoilage.
Queueing models use statistical distributions used to answer a variety of important questions. How many customers or items will be waiting in the queue? How long will a customer or item have to wait in line to be processed? What is the average utilization of servers in the process? What is the probability of waiting longer than some specified time? How does absenteeism affect service levels?
Since different situations have unique mathematical queuing models, we could get overwhelmed quickly. Rather than pursue this complexity, in our next section we’ll look at Little’s Law, which has universal application.

Real-Life Story
An Internet service provider identified dramatic swings in customer service times. By asking why, they found that service reps were not trained to field questions about new features; long customer queues resulted from this lack of training.
Little’s Law
It’s called Little’s Law, but it’s big—because Little’s Law desribes the relationship between lead time, work in process, and completion rate. Here’s an illustration: if the rate of arriving patients is high (work in process), and it takes a long time to process each patient (completion rate), then the inventory of patients in the waiting room will be high—and they will have to wait longer (lead time).
Generically, you can think of Little’s Law like this: the average number of customers (or things) in a system is equal to their average completion rate, multiplied by their average time in the system.
The same relationship applies to all service, transactional, and manufacturing processes. For instance, if the rate at which customers phone in to a call center increases while the staffing level remains the same, and the average handling time for each call stays the same, then the average time on hold (wait time) will increase.
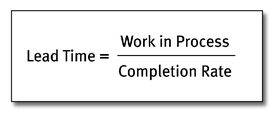
Little’s Law is a formula that shows the relationship between lead time, work in process, and completion rate.
The simplest practical application of Little’s Law is calculating wait times in your VSM. If you count the number of items in each queue and have the cycle times for the process each queue is feeding, then you can multiply them to get the wait time for each process. Then, by adding the cycle times and wait times, you can see the overall process lead time.
Viewing the following small section of a VSM, we find the wait time consumed by the three pieces of inventory is equal to 3 pieces × 2.5 minutes per part in the next operation, which equals 7.5 minutes.
This part of a Value Stream Map provides the visual correlation to Little’s Law. It shows total wait time of 7.5 minutes and total cycle time of 2.5 minutes.
Therefore, we can determine our total lead time by adding the wait times to our total process cycle times (2.5 minutes), as shown by the following formula.
Lead time is the sum of all wait times plus the sum of all cycle times for a given process.

Takt Time Analysis
Takt is the German word for the beat an orchestra conductor uses to regulate the speed at which musicians play. Without takt, we only have noise and confusion. So what sound does your process make? Is it beating along at the same rate your customers demand? Or does it feel disjointed, overwhelmed, or underutilized at different times?
We introduced the notion of Takt Time in Chapter 12, and showed you how it relates to process cycle time. The idea is to match your process cycle time as closely to your Takt Time as possible. But to do this you first have to calculate your Takt Time, which is done like this:

Takt Time is calculated by taking your available amount of work time (within a certain time period) and dividing it by your customer demand (for the same time period).
So say your available time is 12 hours per day, 5 days per week to make a product, or deliver a service, or conduct a series of steps in a process. Available time is the actual amount of time you have to perform value-added work, excluding lunches, breaks, and scheduled team meetings that result in planned machine and process stoppages.
So our availability is 12 hours × 5 days × 60 mins/hour = 3,600 minutes per week. And let’s also say that we have 410 units of demand from the customer each workweek. Our Takt Time is 3,600 minutes per week divided by 410 units per week, which is equal to 8.78 minutes per unit. Our Takt Time of 8.78 minutes is the average pace of customer demand.
You may have heard the mantra of cycle time before—doing what you do and operating your process faster and faster. Generally this is a good thing, but you have to realize that the fastest doesn’t always win the game. Just ask the three guys who were out in the woods camping when the bear began to chase them down. In that scenario, you don’t have to outrun the bear. You only have to be faster than the slowest guy!
Business survival is much the same. Your process doesn’t have to be “fast,” but only in step with the rhythm of the customer. Knowing your Takt Time can greatly help you determine such key process variables as staffing and equipment levels, and work-in-process levels. The goal is to balance the workload and make your process as consistent with customer demand as possible over time.
Do You Kanban?
Kanban is a Japanese word that literally means “sign” or “signal card.” In the context of performance improvement, Kanban systems are inventory replenishment systems that function on the basis of customer demand. When stock batches of raw materials reach a certain level of depletion, the system signals the need to order or replenish stock using some kind of visual sign, like a colored card.
You know when you reach that place in your checkbook where you see a check reorder form? That’s a Kanban—a visual signal telling you it’s time to replenish your inventory.
Kanban systems are a subset of Just in Time operations—the practice of using only what you need when you need it, and minimizing all inventory and waiting queues. If you know how much stock to keep on hand at every part of the process, and you keep inventory moving through the process at the rate it runs, you never store more than you need, and you never run out of stock, either.
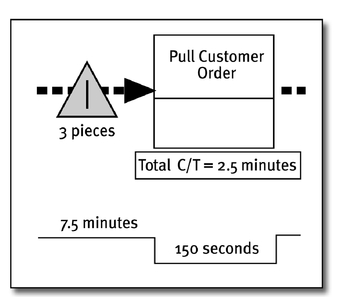
Comparing current batch sizes, or materials on hand, to Kanban calculations enables you to uncover the root causes of inventory problems. This typically leads to changes in your ordering and scheduling processes, and helps you determine your ideal batch sizes for inventories throughout the process. The formula you’d use is this:
This is the formula for analyzing ideal inventories and determining the number of Kanbans you need in a process, or at various stages in a process where materials and inputs are needed to perform work.
In our analysis, a container is the device created to house the units in process, often organizing and protecting them during internal handling. Containers can be baskets or custom racks for parts, a mail pouch, or a stock card on the shelf of the office supply store. The number of Kanbans is the number of these containers, or handling units, that we have in process. Because of this relationship, we often think of the Kanban as the container itself, but actually the Kanban is a visual trigger.
In the formula, demand rate is influenced by fluctuations in Takt Time. Lead time is influenced by supplier delivery timing. Safety Stock is influenced by tolerance for outage, likelihood of an outage, fluctuations in Takt Time, supplier delivery history, and defects. When these are unknown, you should start with 15 percent as safety stock.
Analysis of Resource Usage
Just like inventory issues, resource (staffing) issues are usually the result of other, deeper problems. The good news is that you have a number of Lean-type techniques at your disposal to analyze your resources and determine their optimum use. These include Ideal Manning Calculation, Workload Balance, and Standard Work Combinations. You’ll find that all these techniques lead you to the root of what it takes to best utilize your resources.
Ideal Manning
Every process requiring humans has to be staffed with people who are capable of doing their respective jobs. But you never want to understaff or overstaff, so it pays to use a formula to determine your ideal manning levels. See the formula that follows.
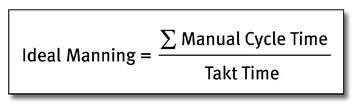
You determine your Ideal Manning Levels by dividing the sum of your manual cycle times (time required to perform a job) by your Takt Time (rate of customer demand).
Summing cycle times provides the total work content time, while Takt Time (customer demand rate) gives you the number of people required to produce to that demand rate. This is your Ideal Manning Level. The implication is that you can’t achieve or sustain your Ideal Manning Level without also addressing all causes of mura, or unevenness in Flow. A process must be approaching near zero downtime, zero rework, and zero defects to sustain ideal manning.
Workload Balance
Workload Balance is the distribution of total work cycle time, and the pacing of that work content to the customer demand rate. This process helps eliminate bottlenecks, unevenness in Flow (mura), and overburdening of people and machines (muri). Workload Balance is done through Cycle Time Bar Charts to identify imbalances in equipment, workers, and process times.
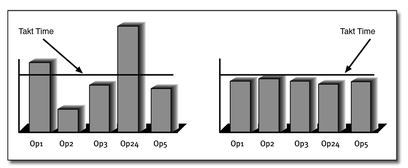
The chart on the left is without Workload Balance; the chart on the right is with Workload Balance.
You can see from the previous charts that your goal is to engineer staffing levels to utilize people at their fullest capacity as close to Takt Time as you can.
Here’s how it works: you plot the manual cycle times for each operator (staff) on a bar chart against the upper limit of the Takt Time. In principle, you have cycle times at or below the Takt Time to assure you have the capacity to service the demand rate of the customer.
Let’s consider an automotive example. As vehicles move through an assembly line, workers have a fixed amount of time to complete their work at each step. Imagine the problems and amount of waste created if the windshield installation step takes 20 percent longer than Takt Time. By the time you get to the sixth vehicle, you are one car behind schedule, and you are faced with a tough choice: stop the line, skip a car, or put the car in the parking lot with no windshield and work overtime to catch up every day.
Analyzing Standard Work Combinations
Standard Work Analysis breaks down process steps in small increments and compares performance to the Takt Time. By doing this you eliminate the overburdening of people (muri), and you identify worker variations that can be smoothed and made consistent. Such an analysis, an example shown following, helps you determine the best arrangement of work tasks for optimum performance.
Spaghetti Diagrams
Analysis of Spaghetti Diagrams (covered in Chapter 7) provides a great visual image of the flow of materials, people, forms, and even customers. The purpose of the Spaghetti Diagram in the analyze phase is to visualize the waste of transportation and create strategies for reducing distance. Physical layouts of equipment and resources can be analyzed and improved using Spaghetti Diagrams.
Standard Work Analysis is useful for arranging work tasks and for keeping each worker’s responsibilities below the customer demand rate.

Overall Equipment Effectiveness
If people have to be utilized well, so do machines, because both are necessary in most businesses and processes. That’s why the Lean Six Sigma Master is concerned with analyzing Overall Equipment Effectiveness (OEE)—the percentage of value-added time for the equipment.
Low OEE values are symptoms of poor scheduling, material shortages, excessive changeover times, inaccurate standards, surprise maintenance, and rework. Stratifying the categories of nonvalue time on equipment can direct the investigation to the critical xs.
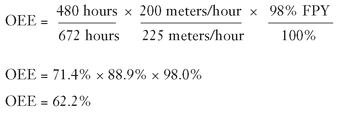
OEE takes into account losses in availability (like planned downtime, setup time, unplanned downtime, or breakdowns), performance rate (like reduced speed, minor unrecorded stoppages), and quality rate (like rejects, rework, yield, and start-up losses). OEE is a clearly defined measure of actual process/asset performance relative to its maximum capability.
You can use the following equations to calculate your OEE:
OEE = Availability ×Performance ×Quality Rate
Where:
Availability is Actual Run Time/Total Time in Period
♦ Actual Run Time is the time that the machine produces product.
♦ Total Time in Period is simply the actual amount of time in the period.
Performance is Actual Production Rate/Expected Production Rate
♦ Actual Production Rate is the actual pace that product is generated.
♦ Expected Production Rate is the pace that internal standards dictate.
Quality Rate = Percent Acceptance/100 Percent
♦ Percent Acceptance is typically referred to as the First Pass Yield.
For example: A wire manufacturer runs its operation 24 hours a day, five days a week. The current-year production standards state that each machine should be able to make 225 meters of wire per hour of operation with perfect quality. For the last 28-day month, they ran 20 days and averaged only 200 meters of wire per hour, with a 2 percent reject rate.
Quick Changeover Opportunities
Changeover is an important non-value-added activity that most organizations have to perform to be competitive. Changeover is downtime: while it’s happening, no product is made and no service is delivered to the customer.
You clean your juicers when switching from making grape to making raspberry. You clean the airplane, gas it up, and ready it for its next load of passengers. You clean up and prepare the operating room for its next patient.
All these necessary activities do not add value for the customer, but they have to be done. Therefore, the goal is to minimize the time it takes to perform changeovers, or eliminate the downtime involved altogether, if possible. This is known as Fast Changeover, and the Lean Six Sigma practitioner applies many techniques, such as videotaping, to reduce setup times.
For manufacturing processes, standardized equipment and changeover processes can reduce changeover times by 90 percent. Changeovers in transactional processes can have dramatic impacts also. Southwest Airlines, for example, is known for the way it unloads passengers, cleans planes, restocks supplies, and loads baggage and passengers for the next flight.
When videotaping or analyzing changeovers, you want to classify steps into two categories: internal and external. Internal changeover steps are activities that must be done while the process is idle. To change the battery, we must shut down the computer. External changeover steps are activities that can be done while the process is running. To add or remove USB devices, we can simply unplug them from the computer.
Your strategy is to externalize as many changeover steps as possible, and to keep the process producing good product for as long as possible. Also, your strategy is to, in advance, organize and stage all materials necessary to perform your changeover activities, external or internal in nature.
Total Productive Maintenance (TPM)
The goal of Total Productive Maintenance (TPM) is to make all equipment downtime 100 percent predictable and minimized. In other words, you want to make processes better than new, not simply restore them.
For example, if we look at one part of the 5S activities (Sort, Store, Shine, Standardize, Sustain), the Shine activity, we might find a leak, and we would use the TPM activity to diagnose the underlying cause of that leak. We’d also use TPM to correct the problem at its source (Improve) to fix it and to avoid future leaks.
A subset of TPM is Autonomous Maintenance, the goal of which is to make the worker the first line of maintenance, performing routine tasks (like adding toner to a copy machine), identifying problems early (detecting low tire pressure before it goes flat), and making minor adjustments (aligning rollers before the paper jams).
Close observation of the process, and rigorous review of maintenance records, can reveal the critical xs for any maintenance issues you have. This is the Analyze aspect of TPM; we cover more of the Improve aspect of TPM in Chapter 17.
Identifying Bottlenecks in the Process
We mentioned earlier in this chapter that bottlenecks often cause inventory problems. At the same time, bottlenecks are caused by still deeper issues related to manning levels, Flow, equipment effectiveness, changeover issues, rework, and anything else that causes you to wait. In essence, bottlenecks are what happens when processing time exceeds Takt Time.
The result is bumper-to-bumper traffic on the highway, long lines at an amusement park, long waits to purchase concert tickets right after they go on sale—even online—for a popular band. In manufacturing, bottlenecks come in the form of work (parts, assemblies, people) that is queued up to the point where it prevents subsequent steps in a process from getting needed inputs in a timely manner to maintain Flow.
In writing this book, we had many consultants draft and provide material. Sometimes these consultants were busy teaching Lean Six Sigma to clients for weeks at a time. While we tried to schedule their tasks and inputs in a flowing manner, sometimes the assignments backed up because the consultants were booked for billable business with clients. Therefore, their book-related tasks took a backseat, creating bottlenecks.

Performance Pitfall
Don’t fix your bottlenecks too much, especially if it takes more time and effort. All you have to do is fix them enough to meet your Takt Time. Anything beyond this will only create capacity you can’t use because the customer demand is not there.
So how do you analyze bottlenecks and solve them? Go to the Genba—the “actual place” where the work is performed. There you use observation, interviews, the Five Whys, and other techniques to find out why the bottlenecks occur. Most likely this will lead you down a chain of bottleneck causation. Unlike stubborn defect issues where the root cause is not known, usually you can figure out how to fix bottlenecks through pure observation and simple investigation.
The Least You Need to Know
♦ If your primary metric is time, the Lean toolbox offers your best bet for analyzing what you need to do.
♦ Focus on reducing waste to improve flow and remove non-value-added activities as much as possible.
♦ Analysis of queue flow delays and batch sizes can reduce inventories.
♦ Smoothing flow through any process requires a balance of equipment, materials, and resources in step with the Takt Time of the customer.
♦ Quick changeovers reduce the need for large batches and improve responsiveness to customer needs.
♦ Most of all, you can see a lot by observing, or by going to the Genba (walking/ observing the process where it is).
..................Content has been hidden....................
You can't read the all page of ebook, please click here login for view all page.