Chapter 4
The Basics of Six Sigma
In This Chapter
♦ Specifications and standard deviations
♦ Understanding the hidden factory
♦ The different types of variation
♦ All about performance characteristics
♦ The reality of Rolled Throughput Yield
♦ The shift-and-drift phenomenon
In this chapter, you’ll learn about some of the more technical aspects of Six Sigma. Still, we’ll only scratch the surface of what there is to know about data, process, and product metrics, and using the many Six Sigma tools to uncover the root cause of complex performance problems.
You’ll learn that variation is the key cause of defects—whether they’re related to products, transactions like a stock purchase, or services like airline baggage handling or prescription filling. By reading this chapter, you’ll also understand more about why Six Sigma is such a strict performance target.
It’s All Greek to Me
The 18th letter in the Greek alphabet is sigma (σ), and in the world of statistics it describes the standard deviation, or variation, of a population. But don’t confuse sigma level (sometimes called sigma value, sigma score, or just sigma) with standard deviation. While the Greek letter sigma is used to describe the standard deviation in statistics, the word sigma in the context of Six Sigma is used to define what statisticians call the Z-score.

Lean Six Sigma Lingo
A Z-score is a statistical measure that quantifies the distance a data point is from the mean (in standard deviation units). If a test had a mean score of 75 and a standard deviation of 5, then a score of 80 would be equivalent to a Z-score of 1. If the raw score were 70, then the Z-score would be -1. If the raw score were 90, then the Z-score would be 3. (The negative sign simply tells you the test score is to the left of the mean.)
Here is the essence of Six Sigma: how many standard deviations can you fit between your average (mean) performance and your specification limits for any given Critical-To characteristic? If you can fit three standard deviations, then you operate at three sigma performance; if you can fit 4.4, then you operate at 4.4 sigma, and so on.
Before you can understand what we mean by “fitting” three, four, five, six, or however many standard deviations between your mean and your specification limits for any given performance characteristic, you have to have some background in statistics. If you do, then skip over the next couple of pages and go right to the section titled “What Does Six Sigma Look Like?” If you don’t, you’ll want to read on.
Basic Statistical Terms
The statistical mean is a measure of central tendency that is determined by adding all the data points in a population, then dividing the total by the number of points. The resulting number is the mean—or the typical value of the population, otherwise known as the average.
Variation is the range of difference between the statistical mean and all the data points that are used to calculate the mean. Or the extent to which performance varies around the average. In the context of Lean Six Sigma, you always want to minimize variation as much as you can.
A defect is any output of any process or business task that does not meet its intended performance target. For example, serving cold food at a restaurant (when it’s supposed to be hot) is a defect. Showing up 20 minutes late to a meeting is a defect (or “error,” as many like to say in nonmanufacturing environments). Of course, when you take your new computer out of the box and it doesn’t work, that’s a defect, too.
What Is a CT?
A Critical-To characteristic (CT) is any feature of a product or process that is important to the customer. A tire has a color, a weight, an exact shape so it fits on a rim. All these characteristics have to perform to specification, or the final product will not perform as intended. Therefore, Six Sigma focuses as upstream as possible in the value chain—toward the ultimate root causes of performance shortfalls.
Some people call CTs CTQs, for “critical to quality.” Others call them CTXs, because a trait can be critical to quality, cost, delivery, time, or some other important aspect of performance. Generically speaking, every performance characteristic is critical to quality, but if you want to be more exact you can say critical to cost or delivery, and so on. If you want to be more generic in your communication, you can use the terms CTs or CTXs.

Lean Six Sigma Lingo
Referring to activities and steps in a process as upstream means they are closer to the beginning of the process. Naturally, steps and activities closer to the end of a process are referred to as downstream.
What Are Specifications?
Specifications are the exacting requirements for CTs expressed mathematically so they can be constantly measured and monitored. In manufacturing, for instance, a specification for a piece of metal might be 3.2 to 3.4 millimeters. Any produced metal piece that falls outside these limits is considered defective. In a service environment, like a hospital, you might have a specification of changing the dressing on a wound no more than once every eight hours.
What Is a Statistical Population?
A statistical population is a distribution of data points around a mean, or average. Often you will hear the words “normal distribution” to depict data that form the bell-shaped curve that is so prevalent in nature.
For example, if we plotted the height of all men, we would see a bell-shaped population whereby the majority are between about 5’8” and 6’ tall. Fewer men would be shorter than 5’ or taller than 6’. Fewer still would be shorter than 5’8” and taller than 6’. It’s the same with IQ, college entrance exam scores, weight of people, etc.
Sometimes populations are not normal and are described as “skewed,” meaning they’re biased toward one end of the measurement spectrum or another. Sometimes, too, populations can have double (bimodal) or multiple (multimodal) peaks—which means that data are clustered around certain values throughout the measurement scale.
What Is a Standard Deviation?
The standard deviation (σ) is a measure of how spread out the values in a data set (population) are. The standard deviation of a data set is a measure of dispersion of the data points around their arithmetic mean. If all the data points are close to the mean, then σ will be closer to zero. If the data points are spread out farther away from the mean, then Σ will be bigger.
Calculating the standard deviation from a sample of data entails taking the square root of the sum of the squared differences of each data point from the mean, divided by the number of data points minus one. (See Chapter 8 for a Standard Deviation formula and sample calculation.)
What Does Six Sigma Look Like?
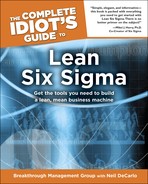
What follows is a performance characteristic, or Critical-To characteristic, with one standard deviation identified. We also show a performance characteristic with lower and upper specification limits, and it shows that its capability is three sigma. This translates into 66,807 defects per million opportunities for defects, or a process yield of 93.32 percent.

Technically Speaking
Some quality and Six Sigma professionals make a distinction between a defect and an error. While all defects are the result of errors, not all errors result in defects. For instance, failing to signal is an error that doesn’t always lead to the defect of a car wreck.
Now if we make this same CT perform at a six sigma level, we see a distribution that looks like the next graph. Note that there are six standard deviations falling within the upper specification limit—which means that the process is operating at no more than 3.4 defects per million opportunities. It’s really as simple as that. No mystery, no magic. If you can design and operate your processes in a way that yields six sigma performance, you will be world-class in what you do.
The distance between the mean (m) and the inflection point is the standard deviation (σ).
In this depiction, the performance of the CT is three sigma, because you can fit three standard deviations between the mean and the upper specification limit.
In this depiction, the performance of the CT is six sigma, because you can fit six standard deviations between the mean and the upper specification limit.
It’s All About Variation
Did you know that no two coins are exactly the same width? How about those grains of sand on the beach, or on all beaches in the entire world? Did you know that no two people are the same size or weight? Hard to believe, but true. That’s right, no two grains of sand anywhere are the same size or weight—or diameter or circumference, for that matter.
Six Sigma statisticians will tell you how important it is to measure variation in any process, product, part, system, and so on—and they are right, because variation can kill a business, especially uncontrollable variation. This is key: some variation is controllable, and some variation is uncontrollable. Six Sigma helps you perform to standard all the time regardless of the variation you can’t control; at the same time, Six Sigma ensures that you prevent the kind of variation you can control.
In Six Sigma terminology, most variation in the performance of any quality characteristic falls under the designation of Common Cause variation. This is the variation you get by virtue of nature, or by virtue of the way you design your product or process. Every time you get a cup of cappuccino at a coffee shop, for example, it’s a different temperature, even though in general it’s “hot.”
Special Cause variation, on the other hand, is when the coffee shop serves you a cold cup of cappuccino. Obviously a defect like this is “special.” Something went unusually wrong with the process, and it produced a faulty output—the root cause of which can be determined and rectified. Maybe the guy who makes the coffee forgot to steam the milk in the cappuccino, or maybe the milk steamer is not working properly.

Lean Six Sigma Wisdom
Design for Six Sigma (DFSS) is the branch of Six Sigma that enables you to prevent defects from occurring in the first place through superior design. One of the hallmarks of DFSS is that it enables you to make your products, services, and transactions “robust” to Common Cause variation. Therefore, you use DFSS to “vaccinate” yourself against the variation in nature that you can’t control. You also use DFSS to prevent the occurrence of Special Cause variation, or the kind of variation you can control.
Both Special and Common Cause variation can wreak havoc on businesses and organizations—since reliability and consistency are critical to the success. How long would you keep your exterminator if he showed up for only half of his scheduled appointments? How many jet engines do you think Boeing would buy from Honeywell if they worked most of the time but sometimes failed? When it comes to transporting humans, variation, especially the kind that leads to error, is intolerable.
How Capable Is Your Process?
One of the key activities of Six Sigma practitioners is measuring and characterizing the behavior of a process, or a Critical-To characteristic. This is what people mean when they talk about performance capability, and it’s at the root of Six Sigma. If your CT is the weight of a product, or its color, or the timeliness of a service, then how often does that product or service perform as intended?
This is the capability of your process: the percentage of time it performs within its intended specifications.
Let’s use a car wash as an example—a process that results in a flawlessly clean vehicle. To do this, you have to perform several functions in a consistent way over time. You have to shoot water at the car at a certain pressure for a certain amount of time. You have to release the right amount of soap at the right time, and guide the car through the wash via some foolproof system.
In addition to machines, some car washes have personnel who perform a series of actions on the car—before it goes through and after it comes out of the automated part of the process. People on the front end determine what kind of wash you want, and often try to sell you the kind you don’t want. They tag your car and vacuum it before it gets washed. They dry it when it comes out and shine your tires (if you paid for that option).
All these major steps are critical to achieving the outcome of a flawlessly clean car each and every time. Sure, it’s easy on average to turn out pretty clean cars; but it’s not easy to turn out superiorly clean cars each time, every time. To do that you have to define and control all your many quality characteristics; if you want your final outcome to be perfect, then you have to be nearly perfect at each and every step in the process.
Mind Your CTs
We’re afraid there’s more you’ll have to know about process capability if you want to be Six Sigma proficient. It’s not enough to just understand that every process has a number of steps to be managed and controlled. Each step itself is a world of quality characteristics unto its own! That means the steps of washing and rinsing your car have their own quality characteristics, which in turn have theirs, and so on.
Obviously, the more complex a system, the more CTs there are because they keep getting nested and nested. A large jet has three million parts that come together in a complex assembly of systems and subsystems, all coordinated together to make it fly you and about 250 other people around the world.
A car wash is simpler, but all of its parts and CTs have to work together just the same. So the automated washing system has various functions it performs by virtue of a power system, hydraulics, water flow, water removal, signaling devices for the customer, and so on.
The key point about Six Sigma is that it Defines, Measures, Analyzes, Improves, and Controls (DMAIC) the functionality of all CTs in a system. If you want your process to function properly, then all your CTs have to function properly as well. The way to ensure this is to apply Six Sigma (or Lean Six Sigma) to your processes, which we show you how to do in Part 2.
Multiply Your Yields
You may already know that the numerical definition of Six Sigma is no more than 3.4 defects per million opportunities for defects. But what does this mean? Does this mean if you’re a Six Sigma trial lawyer, you’ll only lose 3.4 cases for every million you try? It could, if that’s your target and definition of success.
Certain industries have certain performance expectations. For example, the airline industry operates well above Six Sigma performance when it comes to transporting passengers. Far fewer than 3.4 per million end up not reaching their destinations due to crashes.
Your luggage, on the other hand, has a much worse chance than you of getting where it’s supposed to go. That process classically yields only around four sigma performance—which means about 6,200 pieces of luggage for every million don’t make it where they’re supposed to go.
But here’s where it gets a little tricky. Let’s say you want your car wash to operate at a “Six Sigma” level. What do you mean? Do you mean that no more than 3.4 cars per million washed will display any defects causing a customer complaint? If this is the case, how well would each step in the process have to operate, and each part of each step?
Remember the jet airplane discussed in the previous section? The car wash, too, has many CTs that all need to be defect-free if the final product is to be defect-free. Not three million parts like the jet, but probably more than you might imagine.
The key for you to know is that each CT has a probability of failing—of not meeting its designed specification. So the rinse cycle might run without the required volume of water; or the vacuuming people at the front end might leave some area undone; or the guy who washes your windows could leave a smudgy fingerprint.
Rolled Throughput Yield (RTY) is a key concept that tells half the story of why Six Sigma is such a stringent performance target. The reason is because each CT in a system has its own probability of success or failure—of meeting or falling short of its specification(s). Yet if any one CT fails, that puts the final product in jeopardy of meeting its performance target (or customer expectation).
In other words, the probability of failure tends to propagate throughout a system as a function of multiplying the yields of each CT in the system. So let’s say the intake guy at the car wash has a 90 percent chance (yield) of doing his job right, and the vacuum people have a 90 percent chance of doing their jobs right, and the washing machine has the same chance, as does the tire shining, drying, and window washing functions.
Therefore:
That’s the probability of failure for:
Therefore, given this oversimplified example, your car has only a 53 percent chance of meeting the performance target of “perfectly clean car,” as defined of course by the detailed completion checklist used religiously by the managers of the car wash.
Imagine the Rolled Throughput Yield calculations required for the building of that jet with three million parts. A 747 ain’t no car wash! And the implications are different when it fails. This is the reality of Rolled Throughput Yield, and why you should take Six Sigma seriously.
Beware of Shift and Drift
The other half of the Six Sigma story (from a statistical perspective) is that the behavior of a process tends to “shift and drift” over time. Take the car wash personnel, for example. Their behavior will fluctuate over time, and there is nothing the car wash manager can do to prevent this. As a population, the car wash workers will perform within some limit of short-term variability, as well as some limit of long-term variability.
Therefore, if you measure your process performance on any given day, or within any given short period of time, you will get some distribution of variability around your process mean. This is true for the final output of a process as well as any of its steps or CTs.
Short-term variation around a process mean.

Any instances of performance that fall outside the specification limits are considered defects.

This is not a book about Six Sigma, so you’re not going to get a lot of the statistics. We just want you to take note that, over time, your sampled performance distributions will vary, as shown in the chart that follows. Just like samples you take of your hair length will vary from sample to sample over time. Just like any samples the car wash manager takes of his staff’s performance—they, too, will vary from sample to sample.
Every process “wiggles” back and forth over time. This is known as “the 1.5 sigma shift.”
We mentioned before that every CT has to perform within certain specifications, or performance limits. When it doesn’t, you have a defect, and this creates problems and rework. The following chart shows the statistical representation of a defect in terms of a performance distribution.
You know those self-serve car washes where you spray your car with water from a wand? To be effective, and not cause defects, the water has to come out at a certain pressure. But we know there is variation in everything, so it is unrealistic to expect that the pressure can remain constant. Therefore we set some lower specification limit (LSL) and some upper specification limit (USL).
When the pressure coming out of the hose falls below the lower limit, we can say a defect has occurred. Similarly, when the pressure exceeds the upper limit, a defect occurs. If this happens 66,807 times per million opportunities, then the water jet is a three sigma activity. If this happens 6,210 times, then it is a four sigma activity. If defects occur 233 times out of a million, we have a process that operates at five sigma, and so on.
But here’s the rub, a process that displays Six Sigma performance in the short term might operate at 4.5 sigma in the long term. (Thus the “1.5 sigma shift.”) This is true for a car wash, a jet engine maker, a bank, a particular machine in a particular factory, lawnmowers made by XYZ company, the fitting of the wheels on the mower, the level of satisfaction customers have with a hotel—anything and everything that holds leverage in bringing about the desired outcome of a process.
That means to achieve Six Sigma performance (3.4 defects per million opportunities) over the long haul, you have to display no more than one defect per billion opportunities in the short term!
We’re hoping now you have the full picture of why Six Sigma is such a strict performance target. Not only do you have to account for the propagating nature of error (Rolled Throughput Yield), but you also have to make sure you operate at a full 1.5 sigma level higher in the short term than you want to operate in the long term.
The Least You Need to Know
♦ Six Sigma is focused on defect reduction through the minimization of performance variation around the statistical mean.
♦ Six Sigma performance is when an organization commits no more than 3.4 defects per million opportunities for defects at the quality characteristic level.
♦ Most companies will not even approach Six Sigma performance, but by attempting to do so will dramatically improve their operational and financial performance.
♦ The more Critical-To (CT) characteristics there are in a system, the better you have to perform, due to the phenomenon of Rolled Throughput Yield.
♦ Process performance tends to “shift and drift” over time as much or more than 1.5 sigma. Therefore, if you measure 233 defects in the short run (five sigma), you are likely to have about 22,700 defects (3.5 sigma) in the long run.
..................Content has been hidden....................
You can't read the all page of ebook, please click here login for view all page.