
Chapter 11
Validate Measurement Systems
In This Chapter
♦ What is a measurement system?
♦ Attribute and variable data
♦ Gage R&R
♦ Accuracy versus precision
♦ Using customer requirements
You have exploited your quick-hit opportunities by employing the simpler tools and leverage of visual process analysis. But you still don’t quite know what your problem is despite your detailed visual and rudimentary data analysis of your process.
Therefore, this chapter gives you the basics of measurement systems: what they are, why you need them, how they are validated, the nature of different kinds of data, key concepts, and specific tools for operationalizing your customers’ requirements.
Identify Existing Measurement System
Here in the Measure phase, you are still primarily concerned with your outcome measures, or Ys. And as much as you documented the way your current process operates, you now have to document your current measurement system. In other words, what data do you have and how is it collected, reported, and managed? How do you know that the data you have is valid? How do you know that your data-generating tools and gages are accurate?

Lean Six Sigma Lingo
Key Performance Indicators (KPIs) are leverage variables in the chain of causation we call “business success.” Often we refer to the entire set of KPIs as one’s “system of indicators.”
Hmmm. That’s a good one. Why make assumptions? Why make foolish assumptions that the data you have is good data? Why not question everything? What are your Key Performance Indicators (KPIs)? Is it enough to just collect data on the performance of your ultimate Y metric, or might there be a progression of Y-related metrics that you will need to know, validate, and track?
After all, if you want to impact yield in a specific way, then what are the components of yield? Rework? There’s another factor to measure. Scrap? That affects yield, too. At the same time, these factors are caused by even more factors. And so on down the chain where every key input is the output of some lower-level set of inputs. Think about that.
The key is to make sure that your data is clearly and unambiguously defined so all know what it is and what it means. There is a story of a satellite launched into orbit and lost in space because the wrong definition of data was applied to the design and building of the rocket.
The data (specifications on the engineering diagram) said the rocket should be built to send a 225-pound satellite into space at a certain altitude. The problem was that the satellite weighed 225 kilos, not 225 pounds! This error caused all the trajectory calculations to be wrong, and the expensive satellite was lost in space.
Analyze the Measurement System
Once we’ve assured that the definition, process, and procedures for collecting measurements are clear, we then test the measurement system for performance. All measurement systems have errors. Some errors are significant and some are not. For example, most home weighing scales are not perfectly accurate, but they do meet the needs of the users. (Unless, of course, you purposefully set the scale to always read 10 pounds lighter!)
The makers of home scales know that customers can live with an inaccuracy of plus or minus half a pound. On the other hand, a scale used at the local butcher shop to measure filet mignon or lobster tails must be much more accurate. These scales have better accuracy built into them because this is demanded by customers and regulators.
But back to our key point that all measurement systems have errors. Like people, no one is perfect. Your job is to figure out how perfect your measurement system needs to be to accomplish your business goals, and the goals of your Lean Six Sigma project.
Validating the amount of error in a scale is called Measurement Systems Analysis, or MSA. If you want to be world-class in the way you go about making improvements in your organization, you have to conduct an MSA before you proceed. Otherwise you’re introducing performance-improvement risk, and you don’t want that.
Therefore, conduct one of two types of MSAs based on the type of data you have, either attribute or variable in nature. Attribute data is discreet in nature and is gathered into categories, such as large/small, on/off, red/blue, pass/fail, and so on. Variable data is also known as continuous data, and it is gathered according to a scale, such as time, weight, length, etc.

Your test for whether data is attribute or variable in nature is this: can it be divided in two? If yes, then it is variable. If no, then it is attribute.
Attribute MSA
MSA for attribute data is the easiest to understand and conduct. The process is simple: multiple people collect data on the same process, then compare their answers to each other and to the actual verifiable value, or “truth.” The two important dimensions we are trying to verify are repeatability (the same person can get the same measurement result more than once) and reproducibility (different people can get the same measurement result at different times).
The spreadsheet example here gives you a nice view of how you might go about capturing and calculating gage repeatability and reproducibility for an attribute measurement system.
The correct answer is recorded in the column named Attribute (column D in the spreadsheet). Then operators 1, 2, and 3 each do two separate measurements of the process at different times and record their answers (repeatability). The last two columns are used to capture whether all the operators agree (reproducibility), and whether all the operators agree with the standard (accuracy).
An attribute Gage R&R enables you to test for the repeatability, reproducibility, and accuracy of your measurement system.

As we move to the bottom of the worksheet, shown in the example that follows, we calculate the various dimensions of system performance, as follows:
♦ The Appraiser Score shows us how many times an individual operator agreed with himself when taking a measure of the same thing.
♦ The Score vs. Attribute is the calculated percentage of times the operator agreed with himself and the known truth, or correct answer.
♦ The Screen Effective Score calculates the percentage of times all the operators agreed with themselves as well as each other.
♦ The Screen Effective Score vs. Attribute is a total system metric that is the percentage of times all operators agreed with themselves, each other, and the truth. This cumulative analysis is how often you can expect all operators using the same measurement system to get it all right.
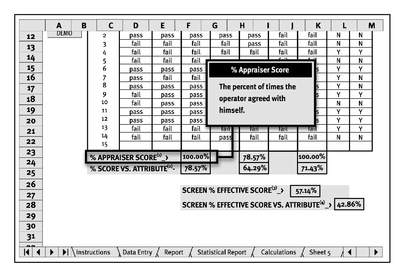
The percentage scores on the bottom of the worksheet tell you how effective your attribute measurement system is. Obviously, the closer to 100 percent, the better.
At this stage, the process improvement team must make a decision about the usefulness of the current system. Generally, a system with a 90 percent overall effectiveness score is considered acceptable. However, if the process and data are critical or related to life-and-death issues, then this may not be good enough. Your specific circumstances will dictate just how good your attribute measurement system needs to be.
Variable MSA
The next type of MSA is for variable data, which have five key dimensions of performance, listed here. As we said previously, performing MSAs for variable data is more difficult and complex than it is for attribute data. Therefore, make sure your variable MSA meets these five criteria:
1. Accuracy—Measurement system outcomes are, on average, close to the truth.
2. Precision—Measurement system outcome variation.
3. Stability—Measurement system performance over time.
4. Linearity—Measurement system error at the various points along its scale (accuracy at various points along a scale).
5. Reproducibility and Repeatability—Performance of the measurement system for more than one person (reproducibility), and measurement system consistency when used again by the same person (repeatability). (Both are components of precision.)
Accuracy. Accuracy is perhaps the easiest to understand and measure. The concept is simple: how do the values you get from the measurement system compare with the truth? In evaluating accuracy, you want to take several measurements, then find out how far the average of all measurements varies from the truth. The less they vary, the more accurate your measurement system is.

Technically Speaking
Manual accuracy and precision calculations can be very time-consuming and onerous. The good news is that you can quickly perform these calculations with a desktop statistics package like Minitab.
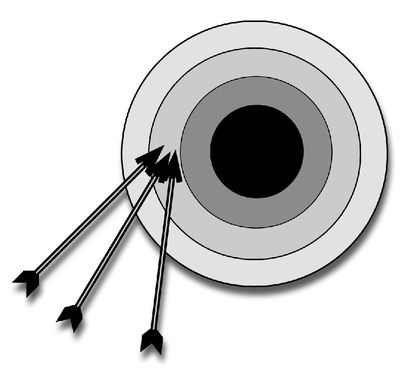
Precision. Precision is the quantification of measurement-system variation independent of its accuracy. Using a bulls-eye analogy, precision is how closely grouped your measurements are using the same system. In evaluating precision, you want to take several measurements, then determine how widely those measurements vary from each other. The less they vary, the more precise your measurement system is.
In this scenario, the measurements taken from the system are accurate because, on average, they are close to the truth (the bulls-eye). But the measurements are not very precise.

Stability. Stability is the quantification of measurement error over time, and one real-world example of this is measuring swim meet times all over the country. Specifically, in all places where the pool is not equipped with a touchpad electronic measuring system, the times are recorded the old-fashioned way.
In this scenario, the measurements taken from the system are precise because they are clustered in the very same area (they have little variation). But the measurements are not very accurate.
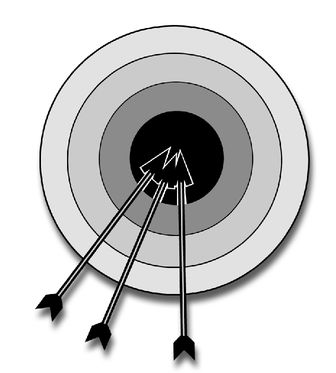
In this scenario, the measurements taken from the system are accurate and precise, because they are clustered together and their average is very close to the truth (bulls-eye).
Three parents standing at the end of the pool dutifully start their stopwatches at the same time the starting gun is fired. They watch the swimmer come to the end of the pool and then, leaning over the edge, stop their watches when the swimmer touches the side.
The stability problem is not easy to solve. As the morning wears on and parents get tired of standing in the sun, how are their measurements impacted? Are their reflexes slower? Are they faster? Who knows? This illuminates the concept of measurement system stability and explains why we use touchpads in the Olympics. In any case, you need to make sure your measurement system is stable over time.
Linearity. Another type of accuracy issue is called linearity, which is the difference in the bias of a gage through the expected range of the gage. Huh? Let’s look at an example that we’ll all understand.
Let’s assume we have a scale that measures human weight. It is said to work for children that are over 25 pounds and adults as heavy as 250 pounds. We could test if, in fact, this weight scale works as well for measuring children as it might for measuring adults.
We could select one child whose true weight is 48 pounds and put him on the scale. If we put him on the scale and measure him 5 or 10 times, we may obtain an average value of about 50 pounds. That would suggest that at the lower end of our measurement system, our scale has a bias of 2 pounds.
In the same manner, we can take an adult whose true weight is 145 pounds. If we measure that adult 5 or 10 times, we may observe that his average weight on our scale reads at 150 pounds. That would mean the offset or bias of our measurement system at the higher end of the device is actually 5 pounds.
Because the bias at the higher end of the scale is larger, we imply that our measurement system has a linearity issue. The offset is not linear—it is not the same throughout the range of readings.
Reproducibility and Repeatability. Reproducibility and repeatability are essentially the same for variable data as they are for attribute data. The point is to determine what amount of variation is introduced by having two or more people take the same measurement (reproducibility), and to determine the amount of variation from the same person taking the measurement more than once (repeatability).
Remember the parents at the swim meet? Typically, when any two of the three parents get the exact same time on their stop watches, a celebration ensues. Most of the time, all three values are different, and the solution is to take the middle time as the correct time.
Remember that with attribute data the observers or operators could either get the measurement right or wrong with no in-between. With variable data, the observers are unlikely to get exactly the same answer very often. For instance, one observer may say the measurement is 13.6 centimeters, while the next observer may say the measurement is 13.65 centimeters.
The good news is that variable data always has the potential to tell us much more about the process than does attribute data.
Improve the Measurement System
The outcome of analyzing your measurement system is to determine how well it works and how much you can rely on it. A reasonable rule of thumb is that if more than 20 percent of the total variation in your process is due to the measurement system, you need a new or improved measurement system.
Before embarking on a massive data collection effort or MSA study and improvement project, the team should carefully scrutinize the process for additional changes made viable by the Process Mapping and procedure studies done earlier. Substantial rework of the MSA system, or creation of a data collection system with statistically reliable data, should only be undertaken when the need for good, clean data is concrete.
This is one advantage of the merger of Lean and Six Sigma into one methodology. Classically, when employing the DMAIC method, practitioners would sometimes expend Herculean effort to get clean, useable data, first by expending great time, effort, and resources to generate that data, and second by improving the measurement systems to make them more reliable and usable.
All this is good when it is absolutely necessary to solve your problem or make your designated improvement. But this more statistically driven Six Sigma mentality can sometimes give way to the more immediate and practical value of the classic Lean approach. Even so, you still need good data, typically. But you may not need as much as you otherwise would to implement such Lean solutions as Pull, Flow, or Mistake Proofing systems.
But if these won’t work and you need clean, reliable data, then you will need to improve your measurement system. And you do this just like you do any other Lean Six Sigma project: you move through the DMAIC process for your measurement system.
Therefore, you define what you are trying to measure. You measure how your current measurement system is performing. You analyze why the system is failing. You improve the system to meet the 20 percent rule. And you control the system so it remains accurate, precise, and reliable over time.
Doing this entails analyzing the entire data collection and measurement process, looking for ways to make it give you solid data. A good place to start is with a Fishbone Diagram, or Cause-and-Effect Diagram. This powerful tool, an example shown here, helps teams visually see what may be causing the problems in any process.

Lean Six Sigma Lingo
The 20 percent rule says that when more than 20 percent of the variation in your process is due to measurement error, you may need to improve the measurement system.
This simple example shows how the Fishbone Diagram can be used to brainstorm possible causes of measurement system failure.

Validate Customer Requirements
Hopefully, everything a Lean Six Sigma practitioner does and thinks is based on customer requirements. You examine these requirements when you generate ideas for your project funnel. You look at what your customers want when you separate the good project ideas from the not-so-good ones. You consider your customers when writing your problem statement and your project objective statement.
Further, you identify your customers and their requirements when creating a SIPOC Map, as we covered in Chapter 7. Then when you draw your Process Flow, you have your customers in mind. In fact, many steps in your process entail handing off work outputs from one department or person to another. Each time, you experience a transition that requires you understand the needs of the next step in the process—your customer.
Don’t forget: customers are internal as well as external. That means the person paying you for your product or service is only the last customer (external) in a long chain of customers (internal). All customer requirements have to be met all along the chain—starting with the requirements of the external customer and working backwards through the system from those ultimate requirements all the way back through the interim requirements of everyone in the process.
As far as we’re concerned here, we go back to our original question, the one we asked in the last chapter: is your improvement project based on decreasing defects, or time?
Defect-Based Requirements
If your process and project are focused on defects, then you confirm that your measurement system is capable of detecting your defects of concern. But you also confirm that the customer requirements on which your project is based are valid. Think of it as a double check at this point, or as further refinement of your project focus.
Therefore, what are the CTs (Critical-To’s) that your project addresses? Are you measuring exactly the right characteristics? Do you have the right performance target identified? You have to make certain you know the answers to these questions before moving on and collecting even more data on your process performance.
Therefore, the rule of thumb is to operationalize your customer requirements. It’s okay to know that you want to increase customer satisfaction by 30 percent for your coffee product by June 30. That is your project objective. But now that you have defined your process and validated your measurement system, what exactly are the dimensions of that satisfaction? In other words, on what exactly are you going to focus all your data collection and analysis activities?
“Hot.” “On time.” “Served with a smile.” Those are certainly a few dimensions, or characteristics, you may have surfaced from your Voice of the Customer analysis (refer to Chapter 7, the section, “The Kano Model”). So if “hot” is a big priority for the customer, you have to operationalize this; you have to move it from a lofty notion to an executable specification.
Therefore, you test the meaning of “hot” with a wide and representative range of customers to come up with a specific definition, say, between 168 and 172 degrees. Now you know exactly where to focus your remaining Measure, Analyze, and Improve activities.
Time-Based Requirements
If your primary project metric is time, then you confirm that your measurement system is capable of quantifying this. And you also confirm that the customer requirements on which your time metric is based are valid. To do this you will need to understand a very important Lean Six Sigma formula called Takt Time.
Think of Takt Time as the underlying rhythm of a process that beats to the drum of customer demand. While the customer has his or her terms for how that time is defined and guided, the business has its terms. At a high level, the formula looks like this:
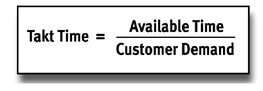
Takt Time is available time divided by customer demand.
So your customers tell you they want five applications completed every morning. Or they want one manufactured unit per day. Or they want to be fully checked into their hotel rooms in 10 minutes. Once you know what the customer needs, then you can determine how that need translates into your process Takt Time.
Let’s take an example. Customers demand that you make 100 personal computers every day. There are 8 hours in a work day, or 480 minutes. To meet the customers’ needs, the process will have to deliver 100 computers in 480 minutes, or 480/100 = 4.8 (one computer in 4.8 minutes). The Takt Time for the whole process, then, is 4.8 minutes.

Lean Six Sigma Lingo
Takt Time means to “keep in step,” or “keep time,” as in keeping up with customer demand. Of German origin, the word takt literally means “beat” or “rhythm.”
What does this mean? Anyone? Anyone? It’s very simple. You have to make one computer every 4.8 minutes to keep pace with customer demand. This means that if every person in the process were to have a balanced amount of work, they would each spend no more than 4.8 minutes before handing off their output to the next person in the process.
This simplistic example calculation assumes that the process pipeline is filled when the day begins and, of course, that all handoffs are seamless and immediate. More on Takt Time in Chapter 14. Here, all you need to know is how to calculate it for the purpose of translating your customer requirements into your process requirements.
The Least You Need to Know
♦ To do a Lean Six Sigma project, you must have a valid and reliable measurement system in place. This means it gives you good data consistently over time.
♦ Any data you collect is either attribute or variable in nature. The former refers to discreet categories, while the latter refers to a continuous scale.
♦ You have to treat your measurement system like anything in your organization: a process or system to be improved using the DMAIC methodology.
♦ Like the focus of your processes and your projects, the main focus of your measurement system is either on monitoring defects or time.
♦ Takt Time is an important Lean Six Sigma formula. It tells you how fast you have to be to meet customer demand.
..................Content has been hidden....................
You can't read the all page of ebook, please click here login for view all page.