Chapter 8
Set the Goal
In This Chapter
♦ Know your scope
♦ Know your Y outputs
♦ Baselining performance
♦ Be very, very SMART
♦ Project your savings
We pick up in this chapter with the more quantitative aspects of the Define phase of DMAIC. Specifically, we’ll look at some issues around scoping Lean Six Sigma projects, defining output metrics (Y-related), and verifying that those metrics are aligned with the key objectives of the organization.
Further, we’ll show you how to establish your performance expectations and script out an objective statement for your Lean Six Sigma project. Finally, we’ll give you some guidelines around how to calculate the expected financial benefits for your projects.
A Note About Scope
Having documented your performance problem or issue, you’re still a long way off from solving it. In fact, you’re still pretty far from even properly defining it. Before you can do this, you have to be sure your project is properly scoped—and that you know which Lean Six Sigma approach and tools to apply to which types of projects.
In general, projects are either “a mile wide and an inch deep” or an “inch wide and a mile deep.” Of course, most higher-level business goals are supported by a mix of both types of projects. In other words, it’s not uncommon to encounter a big, long process that is a mile wide and an inch deep, but that also has several inch-wide, mile-deep problems that need to be solved.
For example, an auto manufacturer needed to reduce its cycle time for chassis assembly to meet market demand. The scope of this process was very broad, and improving it was primarily handled with Lean techniques and Kaizen Events that identified and eliminated non-value-added steps. But Six Sigma tools were also needed to solve deep, complex, Y-x relationships within the welding and milling processes.
In other cases, the performance objective at hand is more clearly broad and not deep, so more Lean-like tools and Kaizen Events come into play. One grocery store chain, for instance, set out to reduce the cycle time for building new stores. As you can imagine, the lost revenue from just one day of nonoperation can be very sizeable. So in this case the project scope was very wide.

Lean Six Sigma Wisdom
Some project scoping tools include Pareto Charts, Affinity Diagrams, and Cause-and-Effect Diagrams. These tools are also useful in the Analyze phase, and for this reason we cover them in Chapters 13 and 16.
Finally, you have many problems that require mostly Six Sigma analytics because they are not so much related to cycle time, lead time, or work in process. Instead, they are related to complex defect or quality issues.
One aerospace engine manufacturer, for example, was having trouble with the reliability of its aircraft-engine combustors. But there were several types of combustors from several different suppliers, and you can’t try to boil the ocean by trying to figure out such inch-wide, mile-deep problems at one time.
Therefore, the manufacturer focused its project on just one type of combustor at one supplier. It then further narrowed down the problem to a certain laser drilling machine operating in a certain process. When it was all done, the original complex problem was narrowly scoped by supplier, location, machine, and process type.
Define Project Metrics
At this point, we take the next step in clarifying and defining the key metrics that you want to impact. Remember, no project is worth its effort if it doesn’t do something significant for your business or organization. Therefore, defining and validating your project metrics will make it certain that your efforts are worth their time.
Lean Six Sigma is about impacting your organization’s performance indicators. Lean Six Sigma, therefore, is about tracing the chain of causation down from your strategic priorities to your operational excellence indicators to your process performance to the specific features and functions of whatever it is your organization provides to customers.
One Project, One Y
Generally speaking, whether the scope of your project is wide or narrow, it addresses only one output feature (Y) at a time. If you try to address more than one output feature with one project, you are likely to run into the problem of “scope creep.”
Here in the Define phase, the key is to figure out which outcomes or features (Ys) your project directly addresses, remembering the rule of thumb that no more than one Y per project is a good policy. Given this, what are some project metrics that might be appropriate for a Lean Six Sigma project? Maybe you can refer to the sample problem statements we provided in the section “Write Problem Statement” in Chapter 7, to get you going:
♦ Reduce customer complaints (Y) in the Midwest region.
♦ Increase equipment availability (Y) for Urgent Care.
♦ Reduce document errors (Y) in Billing.
Other Y-related project metrics might be along these lines:
♦ Increase customer retention for product line A.
♦ Reduce scrap rates of countertop installations.
♦ Lower processing time for indexed mortgage loans.
♦ Improve win rate for sales proposals in China.
♦ Reduce supplier cost for calcium dioxide product.
♦ Decrease engine noise in the riding lawnmower.
♦ Reduce falling injuries among the tree-trimming crew.
♦ Decrease abandoned customer calls for new service.
♦ Improve delivery time for groceries ordered on line.
Of course the whole thrust of Lean Six Sigma—and the remaining phases of Measure, Analyze, Improve, and Control—are geared toward moving from these Ys to the critical xs that influence them. When the xs influencing your Ys are intuitively obvious, and your intuition is correct, you won’t need to use Lean Six Sigma. However, when the factors that cause your Y to perform or not perform are not so obvious, you’ll need to dig deeper and deeper until you uncover the xs that make the Ys do what they do.
Primary, Secondary, Consequential
Your other big concern around developing project metrics is making sure you are aware that for every Y you improve, it is possible you will also improve other Ys. These are called secondary metrics, because they are desirable performance side effects.
For instance, you may have a project that is focused on reducing cycle time for a certain process. As a result of doing this, you may also reduce backorders. Or you could execute a project that reduces defects per unit and, in doing so, also frees up available floor space for use (eliminate the need for a rework staging area).
Consequential metrics are different. Think of these like negative side effects. You “solve” your cost problem by selecting a cheaper vendor, but the product it supplies causes field reliability issues that cost even more money to fix. Oops.

Lean Six Sigma Wisdom
You can run a mini FMEA, or Failure Mode and Effects Analysis, to identify consequential metrics. More on FMEAs in Chapter 13.
Paying attention to consequential metrics is a pessimist’s dream, and we should all be pessimists when it comes to performance improvement. Heed the words of Murphy’s Law: “Whatever can go wrong will go wrong. And George Will’s version: “The unintended consequences of an act will always be greater than the intended consequences.” Or, if you prefer, “No good deed goes unpunished” (Clare Booth Luce).
Verify Alignment to Business Metrics
Recall from Chapter 6 that you often use a CT Tree to generate project ideas, and that a CT Tree is essentially a hierarchical breakdown of an organization’s strategic priorities into lower-level priorities and objectives. In this way, an organization ensures that its lofty goals get translated into actionable operational and process improvements.
At this stage, if you’ve designated an output metric for your project, it’s probably aligned with your organization’s business metrics. But this would not be the case if you haven’t made the effort to ensure this, or haven’t developed your project focus in accordance with your organization’s needs.
In any case, to be sure your project is strategically aligned, and has value to your organization, validate where it fits in the overall performance scheme. For instance, look at the simple Tree Diagrams, which take two business metrics and show how they are broken down into supporting subcategories.
Key business metrics are broken down into more narrow operational metrics, which in turn can be broken down into supporting process metrics that guide the definition of Lean Six Sigma projects.
If you worked in a company that placed a strategic focus on yield or speed, your supporting metric hierarchy might look something like what’s shown in the previous figure. Therefore, you’d have to work in close communication with your manager or Lean Six Sigma Champion to confirm that your project would directly support these improvement goals.
In some cases, even though your project addresses just one output feature, it can impact more than one strategic goal. Note the project shown in the next Tree Diagram—Reduce Changeover Time on Cartoner. Follow the metric breakdown back up the tree and see that this one project supports three strategic priorities.
Using a Tree Diagram is a great way to confirm that your project is a good one. In this case, the identified project at the end of the tree supports three different strategic goals.
Establish Baseline and Entitlement
We’ll assume you have your Y defined now. So what’s next? You’ll have to collect some data on how your Y is performing over time. After all, that’s the game. Remember, the Define phase is all about figuring out what is wrong with your process—at least in terms of its output performance. Therefore, you need to establish your baseline performance, and your Entitlement.

Lean Six Sigma Lingo
Baseline performance is a snapshot of how well your process performs before you implement your Lean Six Sigma project and make your improvements. You always compare your post-project performance with your baseline to verify that you’ve made the difference you intended to make.
Doing this will accomplish four important goals. One, it will show you how bad or good your performance is and how much you need to improve (baseline). Two, it will tell you how much you can improve if you eradicate all the sources of variation (Entitlement). Three, it will tell you whether you’ll need to reach beyond Entitlement to achieve your project objective. Four, it will give you a basis for determining the impact your project makes after it’s completed.
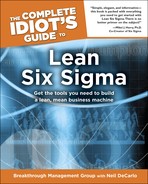
Take a look at the next Time Series Plot related to lead time. You see that the baseline is the average of all the data points, in this case 34 days. You also see that the minimum time, or the best the process has performed, is 22 days. This is your Entitlement.
This plot shows a series of data collected over time that tracks lead time for customer orders. Note that the baseline performance is 34 days (the average) and Entitlement performance is 22 days.
Calculate Your Standard Deviation
Also, you may want to calculate the standard deviation of your process performance, because that, too, is pertinent to your understanding of how your process is performing relative to its output metric. For quick reference, what follows is a simple formula for calculating the standard deviation of a population based on a random sample. (See the section “Sample Size Calculations” in Chapter 15, for some details about statistical sampling).
This formula shows how to estimate the variance of a population based on a sample. Divide the sum of squared deviations by (n-1) rather than by n to create an unbiased estimator for the population variance.
Where:
σ = standard deviation
x = the value of an individual data point in a sample
x-bar is the arithmetic mean of the sample
n is the sample size
x = the value of an individual data point in a sample
x-bar is the arithmetic mean of the sample
n is the sample size
Example: As playground director, Maria wanted to calculate the variation in ages of children using the swings. She sampled eight children at random times of the day and found their ages were 4, 10, 5, 9, 7, 6, 8, and 7. The average age was 7. To calculate the estimated standard deviation of all children using the swings, she used the formula for a sample, first subtracting each age from the average and totaling the squared differences from the average:
Dividing by n-1 (7) gives the sample variance = 4.0. The standard deviation is the square root of the variance = 2.0.
Maria now has an estimate of the variation in ages of the larger population of children who play on the swings.

Technically Speaking
In addition to having a formula for estimating the population standard deviation from a random sample, there is also a formula for determining the population standard deviation if all the population is measured.
Don’t Forget to Benchmark
All done now? Hardly! You still have to determine your baseline and Entitlement for any secondary or consequential metrics. And if you really want to be good you’ll look for benchmarking data around your primary and secondary performance metrics. Benchmarking is the practice of looking outside your own organization to those who are world-class at whatever it is you’re trying to do.
In this case, you might find that a company in your industry has its lead times down to 12 days, whereas the best you’ve ever done is 22 days. This might give you the gold standard for how high you want to aim. It’s one thing to know how well you’ve done in the past, and even another to aspire to greatness in the future. But on what basis can you reasonably set a performance goal for your process? Finding out how well others have performed your same process, or a very similar process, can help you do this.
Develop an Objective Statement
With your performance metrics defined, you can now develop an objective statement for your project. Here is the template for doing so:
Improve [primary metric] from [baseline average] to [target] by [date].
It’s as simple as that! You’ve done so much to understand your process, your customers, and the needs of your organization. And now that you’ve measured the performance of your process and collected some benchmarking data, you are ready to simply write your project objective statement, which will guide and drive you the rest of your way through the Lean Six Sigma process.
To do this properly, all you have to do is be SMART: Specific, Measurable, Aggressive (yet Achievable), Relevant, and Time-bound. For example:
♦ Increase the first-pass yield for the new client billing process from 81 to 90 percent by January 31.
♦ Decrease falling injuries among the tree-trimming crew from six per quarter to zero by October 31.
♦ Decrease changeover time for the milk production line from 96 minutes to 33 minutes by June 30.
So do we need to tell you that a bad project objective statement wouldn’t be SMART? “Reduce billing errors” or “decrease injuries” aren’t specific enough, or measurable, or aggressive, or time-bound—although they may be relevant. And one more thing: don’t forget about your secondary metrics, and always keep an eye on your consequential metrics, too.

Lean Six Sigma Wisdom
If your organization has project tracking software, it’s time to enter this information and begin using the tool to document and communicate the status of your project.
Estimate Financial Benefits
Of course, the reason you do a Lean Six Sigma project at all is to ultimately impact one of the two most important metrics of your organization: cost and revenue. Even if you are a nonprofit or government organization, and your main concern is serving customers or citizens, you still want to do this in the most efficient and cost-effective way possible. At the end of the day, these efficiencies translate directly into higher resource utilization and cost savings.
Therefore, the question becomes, will your project impact revenue or cost? And by how much? So if your project involves reducing inventory, how will this affect the costs associated with housing inventory? If your project deals with increasing capacity, and that capacity is then utilized, how much more revenue will you enjoy as a result? Same for projects focused on yield increases, defect reductions, safety, scrap, waste, and so on.

Performance Pitfall
The requirement of estimating annual savings and benefits from your Lean Six Sigma projects is just that: an estimate. Don’t spend oodles of time struggling to come up with exact, certain predictions. You only need a good first-order prediction now because your exact financial benefit will become much clearer as you move into the Analyze and Improve phases.
Your task is to estimate the savings or benefits that you expect to derive from your project and, ideally, go over these with your manager, boss, or Project Champion. You’ll want to project your savings 12 months out so you can speak in terms of annualized savings and benefits to your organization.
The way to do this is to assume your project will enable your process to perform at its targeted level as per your objective statement. You’ll have to get your finance department involved to help you estimate your projected savings, and to validate that you are on track to deliver your estimated benefits after you’ve implemented your process changes in the Improve phase of Lean Six Sigma.
Savings, Cost Avoidance, and Revenue
There are many categories of savings and benefits you should know before estimating what your project will achieve. You can use these categories and scenarios as guides. And if you work in a company that is deploying Lean Six Sigma on a large scale, you’ll surely need to work with your finance department to verify and approve your projections.
Hard savings are the quantifiable savings that result directly from a Lean Six Sigma project. Examples of hard savings could include savings in materials, man-hours, or overhead. Because of the method Lean Six Sigma Belts use to calculate Cost of Poor Quality (COPQ), not all of these savings will be reflected on existing accounting or financial reports.
Soft savings are intangible benefits derived from a Lean Six Sigma project, such as increased employee satisfaction. Soft savings are also tangible benefits that cannot be directly attributed to the project. For example, a customer can be happy and place two more orders, but you don’t know that this was necessarily a result of your project, even though it could have been.
Potential savings are by-products of the process improvement that require subsequent action to be realized. Potential savings can include capacity (manpower/ equipment/space) created as a result of a Lean Six Sigma project. Savings remain potential if the resources are not applied to another productive use. For example, if a piece of equipment is made surplus but it is not disposed, the savings are potential until the equipment is placed into productive service.
Cost avoidance is typically not a separate category on a Lean Six Sigma financial worksheet. Project benefits classified as cost avoidance will require evidence that the anticipated cost appeared in a current budget for spending or hiring. Once the cost is removed from the budget or hiring plan, the savings can be recharacterized as hard savings. If the amount was not budgeted, it becomes a management decision whether or not to include the amount.
Revenue growth is when your project directly impacts sales. This is often very difficult to establish scientifically. For instance, you may implement a Lean Six Sigma project to better target your advertising. But unless you can show that the new campaigns directly and solely caused increased sales, you are only making inferences.
The Least You Need to Know
♦ Knowing if your improvement objective is “mile wide and inch deep” or “inch wide and mile deep” will help you scope your projects.
♦ Use your knowledge of business priorities to select the one output metric (Y) that your project will improve.
♦ Do some preliminary data collection regarding how your process and output metric is currently performing.
♦ Use your baseline performance, Entitlement, and benchmarking data to set the right performance target for your project.
♦ Make sure you write a formal objective statement for your project that is Specific, Measurable, Aggressive, Relevant, and Time-bound.
♦ Your project must return benefits to the organization in the form of hard savings, soft savings, potential savings, cost avoidance, or revenue growth.
..................Content has been hidden....................
You can't read the all page of ebook, please click here login for view all page.