
Fuzzy logic and its application to textile technology
Abstract:
Fuzzy logic uses terms similar to human language to describe values of parameters and relations. These ‘linguistic rules’ thus allow an easy transfer of human expert knowledge onto a computer-based control system. The term ‘fuzzy’ indicates the difference to Boolean logic as not only the numbers ‘0’ and ‘1’ but also, for example, ‘0.3’ are possible. Fuzzy logic is used today in many technical devices and machines. This chapter gives an overview of the method and concludes with selected examples of successful applications of fuzzy logic to solve textile-related problems.
4.1 Introduction
The term fuzzy logic in its true sense means ‘imprecise logic’. At first glance, this appears to be a contradiction in itself as in classic logic, only clearly defined states represented by either ‘0’ or ‘1’, true or wrong, etc. are considered. In fuzzy logic, there are also intermediate states, the so-called ‘degrees of truth’, represented, for example, by ‘0.2’ or ‘rather wrong’ or ‘rather big’. Fuzzy logic is therefore an all-encompassing logic concept in which classical logic can be regarded as a border case.
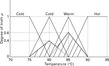
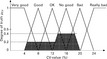
A typical example is the measurement of the temperature of ambient air. Let ‘hot’ be defined as ϑ = 40 °C. In classic logic, a temperature above 40 °C would be regarded as ‘hot’ and any temperature below would be considered as ‘not hot’ (or ‘cold'). A temperature of v = 39.9 °C would therefore be considered ‘not hot’. In fuzzy logic, there are also other states, such as ‘quite hot’ and ‘warm’. A temperature of v = 49.9 °C would then be assigned to ‘quite hot’ with a degree of truth of 99% and to ‘cold’ by only 1%. A temperature of v = 36 °C could then be ‘hot’ with a degree of truth of 60% and be ‘warm’ with a degree of truth of 40% as shown in Fig. 4.1. Hence, fuzzy logic mirrors the way of human thinking much better than classical logic.

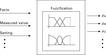
The curves that assign degrees of truth to the input values are the membership functions. In most cases, they are triangular (as in Fig. 4.1), but they can also follow the Gaussian curve or any other mathematical function that is suitable (see Section 4.2.1). Fuzzy logic is usually applied in order to solve controller-related problems by formulating so-called linguistic rules. These linguistic rules are closely related to the human way of thinking, hence allowing ‘imprecise’ definitions and terms. It is therefore not necessary to know the mathematical background behind the relations of input and output parameters. This makes fuzzy logic controllers a very powerful tool which can easily be employed to solve a wide range of technical problems. Figure 4.2 shows the principle of a fuzzy logic controller with the three stages: fuzzification (assigning the degrees of truth to the input), inference (applying the rules) and defuzzification (calculating the output).
The concept of fuzzy logic was developed in the 1960s by Professor Lotfi A. Zadeh, University of Berkeley, USA (Zadeh, 1965). He introduced the term ‘fuzzy’ in the meaning of ‘imprecise’. Since then, fuzzy logic has been used in a wide range of applications. Typical examples are ‘intelligent’ washing machines and other household appliances (Nitta, 1993). The washing machine fuzzy controller was designed to determine the required amount of washing powder and washing time depending on, for example, the mass of the clothes to be washed, the type of dirt and the hardness grade of water. Other successful applications include ABS systems in cars (Mauer, 1995; Yazicioglu, 2008) and medical diagnosis systems (Stadnik, 1986; Hayashi, 1994).
4.1.1 Development in recent years
Fuzzy logic was initially not taken seriously by many scientists and sometimes even fought against. In the 1980s and 1990s, many Japanese companies successfully employed fuzzy control systems in many applications (Nitta, 1993). In Germany, in particular Professor H.-J. Zimmermann of RWTH Aachen University, was a major contributor to the development of fuzzy controllers (Meier et al., 1994; Zimmermann and Sebastian, 1994; Zimmermann, 2001, 2010). Japanese and German companies are still predominant in the industrial applications of these systems.
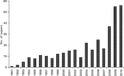
In contrast to neural networks, there were only a few publications about new developments of fuzzy controlled systems in textile technology up to 2007 (as can be seen in Fig. 4.3). One of the reasons was widespread disappointment caused by too high expectations with regard to the performance of these systems. Without a distinctive knowledge of the basic rules governing a certain control engineering problem, fuzzy systems cannot be applied successfully. In recent years though, the number of papers on this subject has increased, which shows that this concept has been taken up again to solve current problems.
4.1.2 Typical application
A typical example of a fuzzy logic application is the control of the water influx into a colouring bath depending on the amount of water already in the vessel and the temperature of both the water in the vessel and the water gushing out of the tap. If the vessel is ‘quite full’, the temperature of the water in the vessel is ‘rather warm’ and the water coming out of the tap is ‘very hot’, then the amount of water added into the vessel should be decreased ‘rather quickly’ and its temperature should be set to ‘warm’. To achieve this with a conventional proportional-integral-derivative (PID) controller is very difficult as complex differential equations need to be devised and solved. Fuzzy logic allows this problem to be solved in a very easy and efficient way (see Section 4.6).
4.2 Imprecise mathematics
Imprecise mathematics is an extension of classical mathematics. The rules that apply are as precisely phrased as in classical mathematics. The fundamental difference is the ability to carry out calculations with imprecise values and imprecise sets.
4.2.1 Terms and definitions
This section introduces the basic definitions used in fuzzy logic and gives typical examples.
• Imprecise value: a value which has a certain degree of uncertainty due to, for example, measurement inaccuracy: 40 cN ± 0.3 cN.
• Imprecise set: consists of elements that cannot be assigned solely to a certain set but only to a certain degree (0–100%). A typical example is the set of thick books. A lexicon normally belongs to the set of ‘thick’ books with a degree of truth of 90% and to the set of ‘rather thick’ books with a degree of truth of 10%. A tourist leaflet normally belongs to the set of ‘thin’ books with a degree of truth of 99% and to the set of ‘rather thick’ books with a degree of truth of 1%.
• Linguistic variable: term for an imprecise set, e.g. ‘thick’, ‘rather thick’, ‘not thick’.
• Degree of truth: a quantitative measure for the degree of membership of an element to an imprecise set. Normally, values between 0 and 1 are used. A degree of truth of μ = 0.7 means that an element belongs to a certain set by 70%.
• Membership function: this function is used to calculate the degree of truth of a variable to a certain set depending on its value. Usually, linear functions (e.g. triangular) are used, sometimes also Gaussian functions, as shown in Fig. 4.4.

• Normalized set: when using a normalized set, all values for the truth values are in the interval [0; 1]. A normalized set can be obtained from an unnormalized set by dividing all degree of truth values by the highest value.
4.2.2 Graphic representation in diagrams
Figure 4.1 shows the graphic representation of five imprecise sets and their membership functions. Normally, the y-axis is the degree of truth and the x-axis represents the absolute value of the variable in question. A single element can belong to different sets, e.g. ‘warm’ and ‘hot’. The sum of its degrees of truth is normally Σiμi = 1. It is also possible that an element belongs to more than two sets and that its sum of degrees of truth μi exceeds the value 1.
4.2.3 Numerical representation
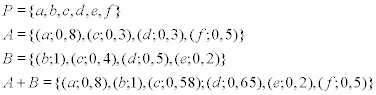
The elements of a set and their degree of truth values can also be described numerically. A common definition is
In equation [4.1], x1, x2 stand for the elements and μ1, μ2 for the respective degrees of truth to the set A. The set A in turn is a subset of the population P. Variables xi with values for the degree of truth with μi = 0 are normally not listed. There is a wide range of other numerical representations of fuzzy sets which are not mentioned here but can be found, e.g. in Ross (2010), Nguyen and Walker (2005), and Zimmermann (2001).
4.3 Set operations
In order to formulate rules, the sets have to be linked. This can be done using terms such as ‘and’, ‘or’, ‘and not’, ‘or not’.
4.3.1 Terms
| x | element |
| A, B | imprecise, normalized sets |
| μA(x), μB(x) P |
degree of truth of element x to the imprecise sets A and B set of all elements x (population) |
| min {…} | minimum operator; the lowest degree of truth m from the variables within the brackets |
| max {…} | maximum operator; the highest degree of truth m from the variables within the brackets |
4.3.2 Or operator
The ‘or’ operator is defined as the unification operator of A and B: A ∪ B.

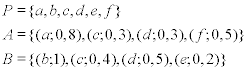
4.3.3 And operator
The ‘and’ operator is defined as the intersecting set.
Minimum function
In fuzzy logic, the ‘and’ operator is normally represented by the minimum function (also called Mamdani implication). As an example:

Elements with a degree of truth μ = 0, are not listed. When applying the minimum operator, we get
Note: Elements not existing in any of the sets A and B have a degree of truth of μ = 0 for the intersecting set. Hence, when applying the minimum operator, these elements are not listed.

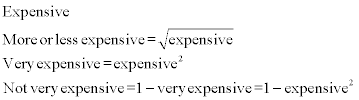
4.3.5 Modifier
Modifiers can be used to slightly change the degree of truth. In spoken language, this corresponds to terms such as ‘very’ and ‘more or less’.
Very
The modifier ‘very’ can be expressed mathematically by taking the square of the membership function of the truth value. For complex problems, there are also a range of so-called compensating operators to express ‘and’ and ‘or’ but they are only rarely used. A comprehensive list can be found in Zimmermann (2001).
4.4 Fuzzy logic versus probabilistic logic
The truth values in fuzzy logic are not probabilities. A probability is a measure for the likelihood of a certain event to happen. It does not give any information about the actual condition. In contrast, the degree of truth represents the real condition of a certain element. A degree of truth of μA(x) = 0.8 means that the element x belongs with a degree of 80% to the imprecise set A and with a degree of 20% to other sets. It does not mean that the probability of x belonging to A is 80%.
Probability pA(x) = 0.8: when considering x ten times, it will belong on average eight times to A and twice not. This also means that in the future, the truth value (probability) of x belonging to A is 80%.
Degree of truth μA(x) = 0.8: when considering x, each time x will belong to the set A by a degree of 80%. This is valid for every single consideration. In the future, x will always meet the required properties to belong to set A by a degree of 80%.
4.5 Ultra-fuzzy logic
So far, x was attributed to the imprecise set A with a degree of truth of μA(x). The degree of truth itself was a precise value (e.g. 0.2). It is also possible to define the degree of truth imprecisely, e.g. within an interval. This can be helpful when taking into account rules described by different people. As an example, depending on personal preferences, the term ‘hot’ and the respective boundary values separating it from the next set can be defined differently. Also the degree of truth can be different for different points of view. Hence, when taking into account expert knowledge of different people, ultra-fuzzy can be a powerful and very effective tool to overcome this difficulty.
4.6 Fuzzy control
The main area of application of fuzzy logic is control engineering. As mentioned previously, when using fuzzy logic, a clearly defined mathematical model describing the process is no longer necessary. More or less simple rules that describe the relation between the variables in question are fully sufficient. Hence, these systems are often named ‘expert systems’ as the knowledge of experts is taken into account when defining these rules. As depicted in Fig. 4.2, fuzzy control can be divided into three stages:
1. Fuzzification (assigning of values to imprecise sets).
4.6.1 Fuzzification
During the fuzzification stage, the problem at hand is assigned to imprecise sets using membership functions and truth values. Hence, it is determined by which degree an element (e.g. measurement value) possesses a certain property (e.g. temperature, price). See Fig. 4.5. The procedure is as follows:
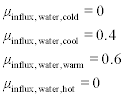
As an example, the water temperature in a colouring bath is to be controlled. The imprecise sets of the water temperature are ‘cool’, ‘warm’ and ‘hot’. The membership functions are defined in such a way that the sum of the degrees of truth for each variable is always Σμi = 1. Hence, the temperature v = 92 °C belongs with a degree of truth of 60% to ‘warm’ (μwarm = 0.6) and with a degree of truth of 40% to ‘hot’ (μhot = 0.4) and not at all to ‘cool’ (Fig. 4.6).

4.6.2 Inference
During this stage, rules have to be defined to process the imprecise data. These are normally formulated in the form ‘if ..then’. The rules are then combined and applied to the data. This results in degrees of truth to the previously defined output sets as shown in Fig. 4.7. Hence, we have the following procedure:

1. Define the processing rules.
2. Define the operators ‘and’, ‘or’, etc.
3. Calculate the degree of truth values of the output set values.
As an example, the temperature of water entering the colouring bath shall be controlled depending on the temperature of water already in the bath.
1. Definition of a simple set of rules:
a. If water in bath is cool, then influx water is hot.
b. If water in bath is warm, then influx water is warm.
c. If water in bath is hot, then influx water is cool.
d. If water in bath is warm or hot, then influx water is cool.
It is of crucial importance to have at least one rule for each condition that may occur during the process! Otherwise, a un-defined state would result which in turn could lead to completely wrong output with catastrophic consequences in the worst case.
2. Definition of the operators ‘and’, ‘or’, etc. When selecting proper operators for ‘and’ and ‘or’, there are many possibilities of which some were described earlier. Normally, minimum and maximum operators are used as the respective calculations are simple and do therefore not require much computing time.
3. Calculation of the truth values of the output sets. From the rules mentioned earlier, only the rules b, c and d apply. Hence:

In this example, different rules lead to different results, which is not uncommon in fuzzy logic. In the case of a similar result (in this case the result ‘cool’ according to rules c and d), normally the degrees of truth are connected by either taking their maximum or their arithmetic mean value. Another possibility is to summarize the two imprecise sets according to
The resulting sum is always greater than the greatest single degree of truth. The various degrees of truth are used in the next step to determine an area which is then used during defuzzification to calculate the final result.
Max/Min method
The membership functions of each imprecise set are clipped at the respective degree of truth parallel to the x-axis. This results in several areas that are then superimposed. As an example, we have:
The result area can then be determined according to Fig. 4.8.

Max/Prod method
The membership function of each imprecise set is multiplied with the respective truth value. The resulting areas are again superimposed (Fig. 4.9). As an example:

The actual temperature of the influx water can then be determined in the last stage, the defuzzification.
4.6.3 Defuzzification
The imprecise result of the inference is transformed into an exact value. This leads to clearly defined instructions, such as ‘set temperature of influx water to 37.8 °C’. The method of defuzzyfication (Fig. 4.10) to be used depends on the problem. There are a wide range of possibilities of which only a few are described here. The principal approach is divided into two steps:

Mean of maximum
This method is suitable only for rough estimations. The mean x-value of the maximum value of the output set is taken as the value for the output variable as the shown in Fig. 4.11. the maximum value in this example is μ = 0.6 and the mean x-value of this membership function is 40 °C, which is then taken as output value.

Centre of gravity
This method is more accurate than the mean-of-maximum method but also more complex. The x-value of the centre of gravity of the result area is taken as the output value. this can be done graphically as shown in Fig. 4.12. the output value for the influx water in this example is v = 37 °C. A numerical solution can be derived with


xc = x-coordinate of the centre of gravity
xB = starting value x of the area
f(x) = function (boundary curve) of the area
In Fig. 4.12, we have xB = 75, xE = 90 and xc = 82.8. Overlapping sections of the result areas are only counted once. If the centre of gravity is located outside all of the result areas, the principal approach is unchanged as is shown in Fig. 4.13. For many applications, it is not overly important to have an exact output value as the fuzzy control loop is calculated frequently thus always leading to a stable condition within a very short period of time.

4.7 Fuzzy control with four input and one output variable
To illustrate the advantages of fuzzy logic to solve engineering problems, we now look at a typical example in ring spinning.
4.7.1 Fuzzification
Assume we want to predict the evenness value of a ring spun yarn depending on the fineness of the flyer roving, the preliminary draft, the yarn count and the number of operating hours of the traveller. The respective triangular membership functions are shown in Figs 4.14–4.18.


4.7.2 Inference
A set of rules for this example is defined as shown in Table 4.1. In this example, only a few rules are formulated. In general, all possible situations that may occur must be assigned to a rule. Using the operator ‘or’ does significantly reduce the number of necessary rules as is shown in Fig. 4.19. In this example, when using the operator ‘and’, 18 rules are necessary. Instead, when using the operator ‘or’, only 3 rules are required to describe the whole universe of discourse.


4.19 Reducing the number of necessary rules to describe the universe of discourse by using the operator ’or’ (bottom) instead of ’and’ (top).
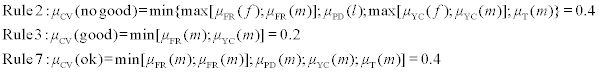
In order to illustrate the usefulness of fuzzy logic systems, typical data for the example above are given in Table 4.2. As is obvious, for example (a), only rules 2, 3 and 7 of Table 4.1 apply. For example (b), only rules 2, 3, 6 and 7 apply and for example (c), only the rules 3 and 4 apply. The inference results for (a) are hence:

4.7.3 Defuzzification
When the Max/Min method is used for the defuzzification as depicted in Fig- 4.20, we get as the final result CV = 13-5- In a similar way, we get the results for (b) CV = 14–5 and for (c) CV = 8- It is apparent from Fig. 4.20 that a slight inaccuracy of the rules and the respective μ-values does not affect the final result considerably. This shows the great advantage of fuzzy logic- If this method is used as a real-time controller, the final result is recalculated permanently thus leading quickly to a stable process even if the single parameters that are taken into account consist of inaccurate values. As can be seen from Fig. 4.21, is also possible to include the component content of yarns into such a system. this kind of control mechanism can easily be implemented into a control circuit and is very fast, making it often superior to classic control approaches.

4.8 Applications of fuzzy logic in textile technology
Fuzzy control systems have been widely used since the 1990s. Many applications have set standards in control technology. In general, fuzzy logic systems offer a promising approach where expert knowledge is available and formulated in rules and a classic PID control systems is too complex to use. For an easier handling of fuzzy controllers, there is a wide range of software available on the market which simplifies its usage considerably- A selection is shown at the end of this chapter.
4.8.1 Intelligent diagnosis system for fabric inspection
Lin et al. (1995) developed a system to determine the breakdown causes of fabric defects of woven fabrics. Based on the experience of weavers, they defined rules relating 18 symptoms (e.g. broken end, pick-out mark, slack weft, hole) with 44 causes (e.g. poor quality of warp yarn, improper let-off, low weft tension). The causes comprised electrical problems, the weaving mechanism as such and quality grading aspects. For each different rule, sets were defined. A typical rule for a defect caused by the weaving process was ‘ if (fabric defect is incorrect let-off) and (weaving density of fabrics is big) then (decrease the let-off length of fabrics)’.
The operator fed the symptoms that were observed into the fuzzy system, which then came up with a range of up to three probable causes based on the predefined fuzzy rules. When the operator then inspected the machine and found additional defects, these could also be fed into the system to narrow the breakdown cause down. This system can also be used to teach untrained personnel the relation between fabric defects and improper machine function. In a later paper (Lin, 2009), a genetic algorithm according to Holland was employed to help find the best solution quicker.
4.8.2 Modelling of colour yield in polyester (PET) dyeing
Tavanai et al. (2005) developed a fuzzy system to model the colour yield (k/s) of polyester (PET) yarns as a function of time, temperature and disperse dye concentration. They applied triangular as well as exponential coefficients, and both led to acceptable results. A typical rule for the colour yield was ‘if (temperature is low) and (time is low) and (concentration is low), then (colour yield is very low)’. Only a small number of rules was necessary to create a viable model. This paper also compares the derived models with the classic approach of statistical regression and clearly shows in this example that fuzzy inference systems (FIS) are superior. Nasiri and Berlik (2009) further improved the model by applying evolutionary algorithms to further tune the fuzzy sets. This led to a slight improvement of the prediction with regard to colour yield (see Fig. 4.22).
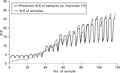
4.22 Predicted vs. actual colour yield for PET fabrics. (adapted from Nasiri and Berlik, 2009)
In a later paper, Nasiri et al. (2011) developed this model further and compared knowledge-driven versus data-driven and rule-based versus tree-based fuzzy systems. They developed a system that offers a compromise between the accuracy of classic Takagi–Sugeno systems and the interpretability of Mamdani models.
4.8.3 Modelling of false-twist texturing yarn
Nasiri (2005) developed a fuzzy regression model to predict the percentage of yarn contraction of false twist textured polyester yarns depending on the texturing temperature. She proved that this approach is superior to conventional statistical regression when only a small number of data sets is available.
4.8.4 Classification of fabric lustre
Hadjianfar and Semnani (2010) propose a fuzzy system to classify the lustre of textile fabrics. They use triangular membership functions for all fuzzy sets. The input consisted of a lustre index which is determined using digital image processing. Thirteen rules converted this input into one of six output classes ranging from ‘very matt’ to ‘very bright’. A typical rule was as follows: ‘if (lustre index is in interval 2) then output is ‘very matt’ to a degree of truth of 0.05’. The classification results of the fuzzy system were compared with the classification of 10 observers. As Fig. 4.23 shows, the correlation between reality and model is excellent.

4.23 Predicted vs. observed lustre. (adapted from Hadjianfar and Semnani, 2010)
4.8.5 Determination of warp tension in weaving
A simple model to determine the warp tension during weaving was proposed by Dayik et al. (2008). They used the shed height (5–60 mm), yarn elasticity (0–20%) and weft yarn density (10–60 cm-1) to accurately predict warp tension (35–60 cN). All membership functions were triangular and only 10 rules were needed, e.g. ‘if (shed height is very low) and (yarn density is very low) and (yarn elongation is normal) then (warp yarn tension is very low)’. A comparison between calculated and measured warp tension in this example showed an excellent correlation (Fig. 4.24). This system can be used to determine optimized settings for these three parameters quickly without carrying out time-consuming trials. The idea is related to a concept derived 10 years earlier and published in Osthus (1997).
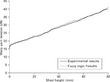
4.24 Predicted vs. measured warp tension. (adapted from Dayik et al., 2008)
4.8.6 Classifying dyeing defects
Huang and Yu (2001) used a fuzzy approach to improve the classification of dyeing defects when using a neural network. After extracting the critical data that define a dyeing defect with digital image processing, these values were converted into fuzzy sets. These were fed into a neural network (backpropagation) thus increasing the dimensions of the feature space. The output of the neural network was then converted into the number of the defect class, e.g. filling band in shade, dye and carrier spot, oil stain.
4.8.7 Predicting garment drape
Fan et al. (2001) developed a neuro-fuzzy system applying a classic approach to predict the garment drape of women's dresses. The input of the backpropagation network consisted of fabric properties and garment feature dimensions, the output was the expected drape chosen from an available range of images that were taken from actual garments. The fuzzy module was designed to choose the correct drape image from those that were calculated by the neural network as principally possible. A comparison between predicted and actual drape image shows that this idea does basically work.
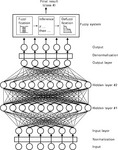
This approach can be used to improve the output of a pure ANN considerably, thus making the results more reliable. Figure 4.25 shows the principle for the classification of input data which was developed by Hormes and Bergmann and successfully applied to the classification of trash particles in carded webs (Veit et al., 1996). There, the output of the ANN is fed into a fuzzy system. In most cases, the output of an ANN as shown in Fig. 4.25 would not consist of a vector such as, for example, (1 0 0 0 0) but rather a vector such as (0.5 0.2 0.1 0.1 0.1). The output of the ANN is therefore not clearly class #1. The fuzzy system is able to ‘translate’ this fuzzy output into an accurate classification, e.g. class #1. The system used in Fan et al. (2001) and Su et al. (2008) is very similar.
4.8.8 Prediction of yarn properties in melt-spinning
Kuo et al. (2004) designed a fuzzy system that could determine tensile strength and yarn count of as-spun polypropylene fibres in the melt-spinning process from extruder screw speed, gear pump speed and winder speed. Although this approach is questionable as there are many more parameters influencing the tensile strength of melt-spun fibres, this system worked very well. They used triangular membership functions to describe the input and output parameters as shown in Fig. 4.26 for extruder screw speed and winding speed. Although the exact linguistic expressions and fuzzy rules are not elaborated, this approach appears worth pursuing further by including other possible relevant parameters in order to predict the characteristics of melt-spun filament yarns in general.

4.26 Membership functions for extruder screw speed and winding speed. (adapted from Kuo et al., 2004)
4.8.9 Prediction of fibre and yarn relationships
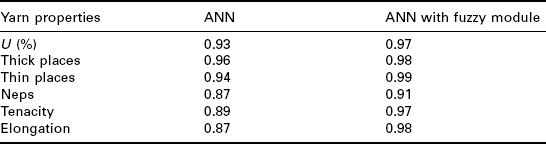
A very interesting approach to relate cotton fibre properties to yarn characteristics was designed by Admuthe and Apte (2010). They used a neural network-type system that contained adaptive nodes assigning membership function values to input data and propagating output to the subsequent layer. After a training with 450 data sets from 30 different varieties of Indian cotton, this system was able to determine, for example, yarn tenacity very accurately and even better than a conventional ANN as is shown in table 4.3.
Table 4.3
Correlation between actual and predicted values
Source: adapted from Admuthe and Apte, 2010.
4.8.10 Other applications
Vachtsevanos et al. (1994) and Vachtsevanos and Sungshin (1999) describe the classic application of a fuzzy-based control system to improve several textile processes in a weaving mill. They describe the principle behind the system in detail and show that the use of a fuzzy control improves the overall performance of the weaving mill. This paper is recommended reading for everyone interested in applying fuzzy control to textile machines.
Other interesting papers include Huang and Chang (2001) who designed a fuzzy system to smooth the linear density deviation in a drawing frame. Liu et al. (2010) developed a neuro-fuzzy system to predict the fabric hand. An approach to determine the uniformity of nonwovens using a fuzzy neurosystem was published by Liu et al. (2010). A comparatively early paper on a fuzzy application was published by Zhao et al. (1996). they designed a tool to help with cotton allocation: if a certain type of cotton was running out, this system helped to decide by which type of cotton to replace it by keeping quality high and costs low. A comprehensive literature review on other fuzzy applications in textiles, which is recommended reading, was published by Cimilli and Candan (2008).
4.9 Practical advice in applying fuzzy logic
In general, the performance of a fuzzy system is only as good as the rules on which it is based. in order to be able to describe a process accurately with rules, it is therefore highly recommended to base the model not only on statistical data gathered through laboratory trials but especially on the knowledge of experts, preferably from industry. As explained above, it is an absolute requirement that to all possible states of the system at least one rule must be assigned. The membership functions also have an influence on the result, but are not crucial in terms of whether the fuzzy controller works in the first place. Fuzzy modules can be used to further improve the output of an artificial neural network, especially for classification problems. in publicly available literature, there are few papers on fuzzy applications for textile machine control, although the system is perfectly suited for this kind of task. it remains to be seen whether this changes in the near future as fuzzy logic experiences a renaissance in science.
4.10 Web references for software tools
There is a wide range of software tools and general information on the world wide web. the following links are a selection of useful websites.
Free fuzzy software
http://fuzzy.cs.uni-magdeburg.de/nefcon/
http://www.trollynet.de/en/open-source/fuzzy-software-samt-fuzzy
4.11 References
Admuthe, L.S., Apte, S. Adaptive neuro-fuzzy inference system with subtractive clustering: a model to predict fiber and yarn relationship. Textile Research Journal. 2010; 80(9):841–846.
Cimilli, S., Candan, C., Fuzzy logic and its usage in textile. Proceedings of the 4th International Textile, Clothing and Design Conference, 2008:724–729.
Dayik, M., Kayacan, M.C., Acar, M., Calis, H. Modeling of warp tension variation during shedding operation using fuzzy logic. Journal of the Textile Institute. 2008; 99(6):505–514.
Fan, J., Newton, E., Au, R. Predicting garment drape with a fuzzy-neural network. Textile Research Journal. 2001; 71(7):605–608.
Hadjianfar, M., Semnani, D., Fuzzy classification of luster of textile fabrics. Textile Research Journal, 2010;(81):649–656. [2011].
Hayashi, Y. Neutral expert system using fuzzy teaching input and its application to medical diagnosis. Information Sciences Applications. 1994; 1(1):47–58.
Huang, C.-C., Chang, K.-T. Fuzzy self-organizing and neural network control of sliver linear density in a drawing frame. Textile Research Journal. 2001; 71(11):987–992.
Huang, C.-C., Yu, W.-H. Fuzzy neural network approach to classifying dyeing defects. Textile Research Journal. 2001; 71(11):100–104.
Kuo, C.-F.J., Hsiao, K.-I., Wu, Y.-S. Using fuzzy theory to predict the properties of a melt spinning system. Textile Research Journal. 2004; 74(3):231–235.
Lin, J.-J. A genetic algorithm-based solution search to fuzzy logical inference for breakdown causes in fabric inspection. Textile Research Journal. 2009; 79:394–409.
Lin, J.-J., Lin, C.-H., Tsai, I.-S. Applying expert system and fuzzy logic to an intelligent diagnosis system for fabric inspection. Textile Research Journal. 1995; 65:697–709.
Liu, J., Zuo, B., Vromen, P., Rabenasolo, B., Zeng, X. Identification of nonwoven uniformity using generalized Gaussian density and fuzzy neural network. Journal of the Textile Institute. 2010; 101(12):1080–1094.
Mauer, G. Fuzzy logic controller for an ABS braking system. IEEE Transactions on Fuzzy System. 1995; 3(4):381–388.
Meier, W., Weber, R., Zimmermann, H.-J. Fuzzy data analysis. Methods and industrial applications. Fuzzy Sets and Systems. 1994; 61(1):19–28.
Nasiri, M. Fuzzy regression modelling of false twist texturing yarn. Proceedings of International Fuzzy Systems Association World Congress. 2005; 142–146. [2005].
Nasiri, M., Berlik, S. Modeling of polyester dyeing using an evolutionary fuzzy system. Proceedings of IFSA-EUSFLAT. 2009; 1246–1251. [2009].
Nasiri, M., Hüllermeier, E., Senge, R., Lughofer, E. Comparing methods for knowledge-driven and data-driven fuzzy modeling: a case study in textile industry. Proceedings of International Fuzzy Systems Association World Congress/Asian Fuzzy Systems Society. 2011; 103. [2011].
Nguyen, H.T., Walker, E.A. A first course in fuzzy logic, 3rd edition, CRC Press Inc, 2005.
Nitta, T. Applications of neural networks to home appliances. Proceedings of the International Joint Conference on Neural Mateworks. 1993; 1:1056–1060.
Osthus, T. Prozessoptimierung in der Weberei durch automatische Einstellung von Streichbaum und Kettwächterkorb. Dissertation, RWTH Aachen University; 1997.
Ross, T. Fuzzy Logic with Engineering Applications, 3rd edition, John Wiley & Sons, 2010.
Stadnik, O.E. Fuzzy decision rules in medical diagnosis and prognosis. Automation and Remote Control 47, (3) pt. 1986; 2:406–411.
Su, T.-L., Kung, F.-C., Kui, Y.-L., Applicatoin of back-propagation neural network fuzzy clustering in textile texture automatic recognition system. Proc. of International Conference on Wavelet Analysis and Pattern Recognition, 2008:4–49.
Tavanai, H., Taheri, S.M., Nasisi, M. Modelling of colour yield in polyethylene terephthalate dying with statistical and fuzzy regression. Iranian Polymer Journal. 2005; 14(11):954–967.
Vachtsevanos, G.J., Sungshin, K. An intelligent approach to integratoin and control of textile processes. Information Sciences. 1999; 123(2000):181–199.
Vachtsevanos, G.J., Dorrity, J.L., Kumar, A., Kim, S. Advanced application of statistical and fuzzy control to textile processes. IEEE Transactions on Industry Applications. 1994; 30(3):510–516.
Veit, D., Hormes, I., Bergmann, J., Wulfhorst, B. Image processing as a tool to improve machine performance and process control. International Journal of Clothing Science and Technology. 1996; 8(1/2):66–72.
Yazicioglu, Y. A fuzzy logic controlled anti-lock braking system (ABS) for improved braking performance and directional stability. International Journal of Vehicle Design. 2008; 48(3–1):299–315.
Zadeh, L.A. Fuzzy sets’, Inf. Control. 1965; 8:338–353.
Zhao, L., Peng, C.-S., Cheng, S.-C. An application of fuzzy dynamic integrated judgement to cotton allocation. Information Sciences. 1996; 94:277–290.
Zimmermann, H.-J. Fuzzy Set Theory − and its applications, 4th edition, Springer, 2001.
Zimmermann, H.-J. Fuzzy set theory. Wiley Interdisciplinary Reviews: Computational Statistics. 2010; 2(3):317–332.
Zimmermann, H.-J., Sebastian, H.-J. Fuzzy design − integration of fuzzy theory with knowledge-based system-design. Proceedings of the IEEE International Conference on Fuzzy Systems. 1994; 1:352–357.