Performing Index Maintenance and Using Performance Tools
Now that you have indexes defined for the tables in your database, the next step is to see how to maintain them. Because indexes are constantly changing, their structure must be inspected every so often to make sure that they are still working efficiently. In addition, you have also learned how to create two very different types of indexes. The first type includes the indexes that are contained within the SQL Server, and the second includes the full-text indexes that are outside of the server.
In this section, you will learn how to use several of the tools available in SQL Server 2000 to investigate how the indexes are performing. In addition, you will see how to set up automatic, scheduled maintenance for both of these index types.
Full-Text Indexing Scheduling
To maintain a full-text index, two separate tasks must be performed. These are
Populating the catalog where the index is stored
Populating the index that is defined on the table
To add a job to the SQL Server Agent to populate the index, right-click the table in Enterprise Manager, display the table properties form, and then click the Schedules tab to display the form shown in Figure 9.21. If there are any tasks already scheduled, they will be listed here.
Figure 9.21. Defining a scheduled task for a table's full-text index.

Click the New Table Schedule button to display the form shown in Figure 9.22. On this form, enter a name for this job and then specify the update you want performed. Finally, enter the frequency of when you want to run this job.
Figure 9.22. Defining a new job to SQL Server Agent.

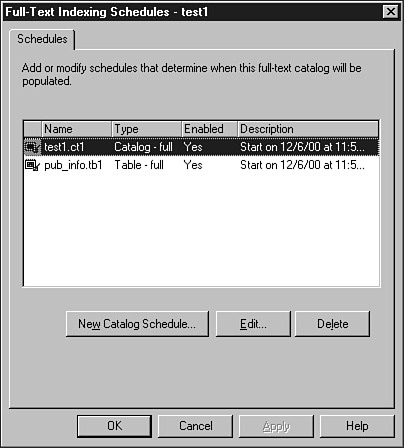
When you are satisfied with your entries, click OK to finish the definition. Now that you have added a job for the table, you also want to add one for the catalog. Highlight the Full-Text Catalogs for the Pubs database, and then right-click the catalog and select schedules from the pop-up menu. This will display the form shown in Figure 9.23. As you can see, it is the same form displayed when you started to add a schedule for the table. In fact, you should see the job you previously added in this list.
Figure 9.23. Displaying the jobs defined for the full-text index on the pub_info table.

When you click the New Catalog Schedule button, you will see the same definition form that was used for the table. Complete this form the same way and click the OK button.
Now, the SQL Server Agent will run these jobs at the times you have specified. This will keep your full-text index current with the information in the table, taking into account any updates, deletes, or inserts that might have been performed.
Using Server Statistics
SQL Server can record statistical information about your data and store this information in a special object in the database. This object, which I will call a statistics object, contains information about how the data is distributed throughout each table and also calculates the average number of duplicates for the indexed columns. When you create an index, if any data exists in the table, a statistics blob will be created and populated with information about the columns that you are indexing. If you create an index on a table and then add the data, and did not turn off the recording of the statistics, a statistics blob will be created for you. If you have turned off the recording of the statistics about an index, this statistics blob won't be created. SQL Server used this information to determine the proper index to use for any given query. The more current the statistics, the better job SQL Server will do selecting the proper index.
To turn these automatic statistics off or on, you would use the following system stored procedure:
Sp_Autostats <table name>, 'Off'| 'On'
If you want to know the last time that the statistics were recorded, you can use the function STATS_DATE() as shown in the following example:
use pubs
declare @tabid int
declare @indid int
select @tabid = object_id('titles')
select @indid = 2  /* non clustered index */
Select Stats_date(@tabid,@indid)
When you execute this script, you should see the following:
Using the Query Analyzer Tools
When executing a query in the Query Analyzer, you have the ability not only to work with T-SQL, but also to view the result sets interactively. You can also analyze the query plan, and receive assistance to improve the performance of the query. The Execution Plan options will graphically display the data retrieval methods chosen by the server. This enables you to examine the plan being used and to make changes to the query itself or possibly to the indexes of the query, if the performance of the query is inefficient. The server investigates all the different plans that are available to execute the query.
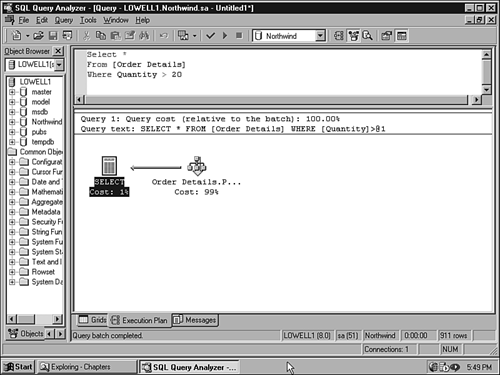
When you run the query, you can display the execution plan for the query by selecting Show Execution Plan from the Query menu in Query Analyzer. Then, when you run the query, an additional tab will be available. To see how this works, start the Query Analyzer and execute the following SQL statement after turning on the Execution Plan option:
Select *
from [order details]
Where Quantity > 20
After execution, click the Execution Plan tab to see how the query was executed as shown in Figure 9.24.
Figure 9.24. Accessing the execution plan for a query in the Query Analyzer.

While you are displaying the Execution Plan, you can display detailed information about any of the objects displayed by simply placing and holding the mouse over the object. Figure 9.25 shows the information about the clustered index used for the query.
Figure 9.25. Displaying the execution statistics for the current query.

Another feature of the Query Analyzer is being able to capture statistics about the query, such as the number of rows affected. You can turn on this option in the same way as the Execution Plan, from the Query menu. Figure 9.26 shows the statistics for the query we have been working with.
Figure 9.26. Displaying the client statistics for the current query.

The information displayed in these forms will help you decide whether you need another index or maybe need to modify an existing one. The following SQL statement accesses the Invoices view in the Northwind database. Figure 9.27 shows the execution plan after executing the view.
Figure 9.27. Displaying the execution plan for a view.

Select * from Invoices
