
Chapter 6. Storing and Manipulating Data: Where to Put Your Data

Sooner or later, you’ll need to safely store your data somewhere.
And when it comes to storing data, Python has you covered. In this chapter, you’ll learn about storing and retrieving data from text files, which—as storage mechanisms go—may feel a bit simplistic, but is nevertheless used in many problem areas. As well as storing and retrieving your data from files, you’ll also learn some tricks of the trade when it comes to manipulating data. We’re saving the “serious stuff” (storing data in a database) until the next chapter, but there’s plenty to keep us busy for now when working with files.
Doing Something with Your Webapp’s Data
At the moment, your webapp (developed in Chapter 5) accepts input from any web browser (in the form of a phrase and some letters), performs a search4letters call, and then returns any results to the waiting web browser. Once done, your webapp discards any data it has.

There are a bunch of questions that we could ask of the data our webapp uses. For instance: How many requests have been responded to? What’s the most common list of letters? Which IP addresses are the requests coming from? Which browser is being used the most? and so on, and so forth.
In order to begin answering these (and other) questions, we need to save the webapp’s data as opposed to simply throwing it away. The suggestion above makes perfect sense: let’s log data about each web request, then—once we have the logging mechanism in place—go about answering any questions we have.
Python Supports Open, Process, Close
No matter the programming language, the easiest way to store data is to save it to a text file. Consequently, Python comes with built-in support for open, process, close. This common technique lets you open a file, process its data in some way (reading, writing, and/or appending data), and then close the file when you’re done (which saves your changes).
Here’s how to use Python’s open, process, close technique to open a file, process it by appending some short strings to it, and then close the file. As we’re only experimenting for now, let’s run our code at the Python >>> shell.
Geek Bits

To access the >>> prompt:
run IDLE on your computer;
run the
python3command in a Linux or Mac OS X terminal; oruse
py -3at a Windows command line.
We start by calling open on a file called todos.txt, using append mode, as our plan is to add data to this file. If the call to open succeeds, the interpreter returns an object (known as a file stream) which is an alias for the actual file. The object is assigned to a variable and given the name todos (although you could use whichever name you wish here):

The todos variable lets you refer to your file in your code (other programming languages refer to this as a file handle). Now that the file is open, let’s write to it using print. Note how, below, print takes an extra argument (file), which identifies the file stream to write to. We have three things to remember to do (it’s never-ending, really), so we call print three times:

As we have nothing else to add to our to-do list, let’s close the file by calling the close method, which is made available by the interpreter to every file stream:
If you forget to call close, you could potentially lose data. Remembering to always call close is important.
Reading Data from an Existing File
Now that you’ve added some lines of data to the todos.txt file, let’s look at the open, process, close code needed to read the saved data from the file and display it on screen.
“Reading” is the “open” function’s default mode.
Rather than opening the file in append mode, this time you are only interested in reading from the file. As reading is open’s default mode, you don’t need to provide a mode argument; the name of the file is all you need here. We’re not using todos as the alias for the file in this code; instead, we’ll refer to the open file by the name tasks (as before, you can use whichever variable name you want to here):

Let’s now use tasks with a for loop to read each individual line from the file. When we do this, the for loop’s iteration variable (chore) is assigned the current line of data as read from the file. Each iteration assigns a line of data to chore. When you use a file stream with Python’s for loop, the interpreter is smart enough to read a line of data from the file each time the loop iterates. It’s also smart enough to terminate the loop when there’s no more data to read:

As you are merely reading from an already written-to file, calling close is less critical here than when you are writing data. But it’s always a good idea to close a file when it is no longer needed, so call the close method when you’re done:
Geek Bits
The first argument to open is the name of the file to process. The second argument is optional. It can be set to a number of different values, and dictates the mode the file is opened in. Modes include “reading,” “writing,” and “appending.” Here are the most common mode values, where each (except for 'r') creates a new empty file if the file named in the first argument doesn’t already exist:
'r'Open a file for reading. This is the default mode and, as such, is optional. When no second argument is provided,'r'is assumed. It is also assumed that the file being read from already exists.'w'Open a file for writing. If the file already contains data, empty the file of its data before continuing.'a'Open a file for appending. Preserve the file’s contents, adding any new data to the end of the file (compare this behavior to'w').'x'Open a new file for writing. Fail if the file already exists (compare this behavior to'w'and to'a').
By default, files open in text mode, where the file is assumed to contain lines of textual data (e.g., ASCII or UTF-8). If you are working with nontextual data (e.g., an image file or an MP3), you can specify binary mode by adding “b” to any of the modes (e.g., 'wb' means “write to a binary data”). If you include “+“ as part of the second argument, the file is opened for reading and writing (e.g., 'x+b' means “read from and write to a new binary file”). Refer to the Python docs for more details on open (including information on its other optional arguments).

The with statement is more convenient.
Although using the open function together with the close method (with a bit of processing in the middle) works fine, most Python programmers shun open, process, close in favor of the with statement. Let’s take some time to find out why.
A Better Open, Process, Close: “with”
Before we describe why with is so popular, let’s take a look at some code that uses with. Here is the code we wrote (two pages ago) to read in and display the current contents of our todos.txt file. Note that we’ve adjusted the print function call to suppress the extra newline on output:

Let’s rewrite this code to use a with statement. These next three lines of code use with to perform exactly the same processing as the four lines of code (above):

Notice anything missing? The call to close does not make an appearance. The with statement is smart enough to remember to call close on your behalf whenever its suite of code ends.
This is actually much more useful than it initially sounds, as lots of programmers often forget to call close when they’re done processing a file. This is not such a big deal when all you’re doing is reading from a file, but when you’re writing to a file, forgetting to call close can potentially cause data loss or data corruption. By relieving you of the need to remember to always call close, the with statement lets you concentrate on what it is you’re actually doing with the data in the open file.
Python supports “open, process, close.” But most Python programmers prefer to use the “with” statement.
The “with” statement manages context
The with statement conforms to a coding convention built into Python called the context management protocol. We’re deferring a detailed discussion of this protocol until later in this book. For now, all you have to concern yourself with is the fact that when you use with when working with files, you can forget about calling close. The with statement is managing the context within which its suite runs, and when you use with and open together, the interpreter cleans up after you, calling close as and when required.

Let’s put what you now know about working with files to use. Here is the current code for your webapp. Give it another read before we tell you what you have to do:

Your job is to write a new function, called log_request, which takes two arguments: req and res. When invoked, the req argument is assigned the current Flask request object, while the res argument is assigned the results from calling search4letters. The log_request function’s suite should append the value of req and res (as one line) to a file called vsearch.log. We’ve got you started by providing the function’s def line. You are to provide the missing code (hint: use with):

Your job was to write a new function, called log_request, which takes two arguments: req and res. When invoked, the req argument is assigned the current Flask request object, while the res argument is assigned the results from calling search4letters. The log_request function’s suite should append the value of req and res (as one line) to a file called vsearch.log. We got you started—you were to provide the missing code:

Invoking the logging function
Now that the log_request function exists, when do we invoke it?
Well, for starters, let’s add the log_request code into the vsearch4web.py file. You can put it anywhere in this file, but we inserted it directly above the do_search function and its associated @app.route decorator. We did this because we’re going to invoke it from within the do_search function, and putting it above the calling function seems like a good idea.
We need to be sure to call log_request before the do_search function ends, but after the results have been returned from the call to search4letters. Here’s a snippet of do_search’s code showing the inserted call:

A Quick Review
Before taking this latest version of vsearch4web.py for a spin, let’s check that your code is the same as ours. Here’s the entire file, with the latest additions highlighted:

Take your webapp for a spin...
Start up this version of your webapp (if required) at a command prompt. On Windows, use this command:
C:webapps> py -3 vsearch4web.pyWhile on Linux or Mac OS X, use this command:
$ python3 vsearch4web.pyWith your webapp up and running, let’s log some data via the HTML form.

Use your web browser to submit data to it via the webapp’s HTML form. If you want to follow along with what we’re doing, submit three searches using the following values for phrase and letters:
hitch-hikerwithaeiou.life, the universe, and everythingwithaeiou.galaxywithxyz.
Before you begin, note that the vsearch.log file does not yet exist.


Data is logged (behind the scenes)
Each time the HTML form is used to submit data to the webapp, the log_request function saves details of the web request and writes the results to the log file. Immediately after the first search, the vsearch.log file is created in the same folder as your webapp’s code:

It’s tempting to consider using your text editor to view the vsearch.log file’s contents. But where’s the fun in that? As this is a webapp, let’s provide access to the logged data via the webapp itself. That way, you’ll never have to move away from your web browser when interacting with your webapp’s data. Let’s create a new URL, called /viewlog, which displays the log’s contents on demand.
View the Log Through Your Webapp
You’re going to add support for the /viewlog URL to your webapp. When your webapp receives a request for /viewlog, it should open the vsearch.log file, read in all of its data, and then send the data to the waiting browser.
Most of what you need to do you already know. Start by creating a new @app.route line (we’re adding this code near the bottom of vsearch4web.py, just above the dunder name dunder main line):

Having decided on the URL, next we’ll write a function to go with it. Let’s call our new function view_the_log. This function won’t take any arguments, and will return a string to its caller; the string will be concatenation of all of the lines of data from the vsearch.log file. Here’s the function’s def line:

Now to write the function’s suite. You have to open the file for reading. This is the open function’s default mode, so you only need the name of the file as an argument to open. Let’s manage the context within which our file processing code executes using a with statement:

Within the with statement’s suite, we need to read all the data from
the file. Your first thought might be to loop through the file, reading each line as you go.
However, the interpreter provides a read method, which, when invoked, returns the
entire contents of the file “in one go.” Here’s the single
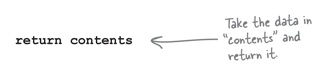
line of code that does just that, creating a new string called contents:

With the file read, the with statement’s suite ends (closing the file), and you are now ready to send the data back to the waiting web browser. This is straightforward:
With everything put together, you now have all the code you need to respond to the /viewlog request; it looks like this:

With the new code added and saved, your webapp should automatically reload. You can enter some new searches if you like, but the ones you ran a few pages ago are already logged. Any new searches you perform will be appended to the log file. Let’s use the /viewlog URL to take a look at what’s been saved. Type http://127.0.0.1:5000/viewlog into your browser’s address bar.
Here’s what we saw when we used Safari on Mac OS X (we also checked Firefox and Chrome, and got the same output):

Where to start when things go wrong with your output
When your output doesn’t quite match what you were expecting (which is the case above), it’s best to start by checking exactly what data the webapp sent you. It’s important to note that what’s just appeared on screen is a rendering (or interpretation) of the webapp’s data as performed by your web browser. All the major browsers allow you to view the raw data received with no rendering applied. This is known as the source of the page, and viewing it can be a useful debugging aid, as well as a great first step toward understanding what’s going on here.
If you are using Firefox or Chrome, right-click on your browser window and select View Page Source from the pop-up menu to see the raw data as sent by your webapp. If you are running Safari, you’ll first need to enable the developer options: open up Safari’s preferences, then switch on the Show Develop menu in the menu bar option at the bottom of the Advanced tab. Once you do this, you can return to your browser window, right-click, and then select Show Page Source from the pop-up menu. Go ahead and view the raw data now, then compare it to what we got (on the next page).
Examine the Raw Data with View Source
Remember, the log_request function saves two pieces of data for each web request it logs: the request object as well as the results of the call to search4letters. But when you view the log (with /viewlog), you’re only seeing the results data. Does viewing the source (i.e., the raw data returned from the webapp) offer any clue as to what happened to the request object?
Here’s what we saw when we used Firefox to view the raw data. The fact that each request object’s output is colored red is another clue that something is amiss with our log data:
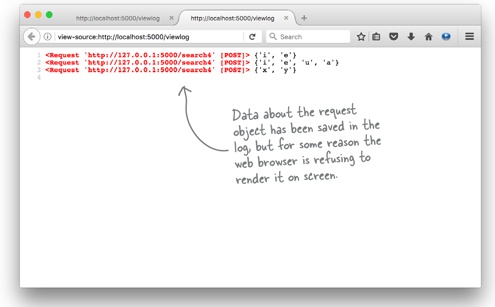
The explanation as to why the request data is not rendering is subtle, and the fact that Firefox has highlighted the request data in red helps in understanding what’s going on. It appears there’s nothing wrong with the actual request data. However, it seems that the data enclosed in angle brackets (< and >) is upsetting the browser. When browsers see an opening angle bracket, they treat everything between that bracket and the matching closing angle bracket as an HTML tag. As <Request> is not a valid HTML tag, modern browsers simply ignore it and refuse to render any of the text between the brackets, which is what’s happening here. This solves the mystery of the disappearing request data. But we still want to be able to see this data when we view the log using /viewlog.
What we need to do is somehow tell the browser not to treat the angle brackets surrounding the request object as an HTML tag, but treat them as plain-text instead. As luck would have it, Flask comes with a function that can help.
It’s Time to Escape (Your Data)
When HTML was first created, its designers knew that some web page designers would want to display angle brackets (and the other characters that have special meaning to HTML). Consequently, they came up with the concept known as escaping: encoding HTML’s special characters so that they could appear on a webpage but not be interpreted as HTML. A series of translations were defined, one for each special character. It’s a simple idea: a special character such as < is defined as <, while > is defined as >. If you send these translations instead of the raw data, your web browser does the right thing: it displays < and > as opposed to ignoring them, and displays all the text between them.
Flask’s Markup object is text that has been marked as being safe within an HTML/XML context. Markup inherits from Python’s built-in unicode string, and can be used anywhere you’d use a string.
Flask includes a function called escape (which is actually inherited from Jinja2). When provided with some raw data, escape translates the data into its HTML- escaped equivalent. Let’s experiment with escape at the Python >>> prompt to get a feel for how it works.
Begin by importing the escape function from the flask module, then call escape with a string containing none of the special characters:

The escape function returns is a Markup object, which—for all intents and purposes—behaves just like a string. When you pass escape a string containing any of HTML’s special characters, the translation is done for you, as shown:

As in the previous example (above), you can also treat this markup object as if it’s a regular string.
If we can somehow arrange to call escape on the data in the log file, we should be able to solve the problem we currently have with the nondisplay of the request data. This should not be hard, as the log file is read “in one go” by the view_the_log function before being returned as a string:

To solve our problem, all we need to do is call escape on contents.
Viewing the Entire Log in Your Webapp
The change to your code is trivial, but makes a big difference. Add
escape to the import list for the flask module (at the top of
your program), then call escape on the string in
contents:

Amend your program to import and call escape as shown above, then save your code (so that your webapp reloads). Next, reload the /viewlog URL in your browser. All of your log data should now appear on screen. Be sure to view the HTML source to confirm that the escaping is working. Here’s what we saw when we tested this version of our webapp with Chrome:

Learning More About the Request Object
The data in the log file relating to the web request isn’t really all that useful. Here’s an example of what’s currently logged; although each logged result is different, each logged web request is showing up as exactly the same:

We’re logging the web request at the object level, but really need to be looking inside the request and logging some of the data it contains. As you saw earlier in this book, when you need to learn what something in Python contains, you feed it to the dir built-in to see a list of its methods and attributes.
Let’s make a small adjustment to the log_request function to log the output from calling dir on each request object. It’s not a huge change...rather than passing the raw req as the first argument to print, let’s pass in a stringified version of the result of calling dir(req). Here’s the new version of log_request with the change highlighted:

Let’s try out this new logging code to see what difference it makes. Perform the following steps:
Amend your copy of
log_requestto match ours.Save
vsearch4web.pyin order to restart your webapp.Find and delete your current
vsearch.logfile.Use your browser to enter three new searches.
View the newly created log using the /viewlog URL.
Now: have a good look at what appears in your browser. Does what you now see help at all?
Here’s what we saw after we worked through the five steps from the bottom of the last page. We’re using Safari (although every other browser shows the same thing):

What’s all this, then?
You can just about pick out the logged results in the above output. The rest of the output is the result of calling dir on the request object. As you can see, each request has a lot of methods and attributes associated with it (even when you ignore the dunders and wonders). It makes no sense to log all of these attributes.
We took a look at all of these attributes, and decided that there are three that we think are important enough to log:
req.form: The data posted from the webapp’s HTML form.req.remote_addr: The IP address the web browser is running on.req.user_agent: The identity of the browser posting the data.
Let’s adjust log_request to log these three specific pieces of data, in addition to the results of the call to search4letters.
Logging Specific Web Request Attributes
As you now have four data items to log—the form details, the remote IP address, the browser identity, and the results of the call to search4letters—a first attempt at amending log_request might result in code that looks like this, where each data item is logged with its own print call:

This code works, but it has a problem in that each print call appends a newline character by default, which means there are four lines being logged per web request. Here’s what the data would look like if the log file used the above code:

There’s nothing inherently wrong with this as a strategy (as the logged data is easy for us humans to read). However, consider what you’d have to do when reading this data into a program: each logged web request would require four reads from the log file—one for each line of logged data. This is in spite of the fact that the four lines of data refer to one single web request. As a strategy, this approach seems wasteful. It would be much better if the code only logged one line per web request.
Log a Single Line of Delimited Data
A better logging strategy may be to write the four pieces of data as one line, while using an appropriately selected delimiter to separate one data item from the next.
Choosing a delimiter can be tricky, as you don’t want to choose a character that might actually occur in the data you’re logging. Using the space character as a delimiter is next to useless (as the logged data contains lots of spaces), and even using colon (:), comma (,), and semicolon (;) may be problematic given the data being logged. We checked with the programmers over at Head First Labs, and they suggested using a vertical bar (|) as a delimiter: it’s easy for us humans to spot, and it’s unlikely to be part of the data we log. Let’s go with this suggestion and see how we get on.
Geek Bits
Think of a delimiter as a sequence of one or more characters performing the role of a boundary within a line of text. The classic example is the comma character (,) as used in CSV files.
As you saw earlier, we can adjust print’s default behavior by providing additional arguments. In addition to the file argument, there’s the end argument, which allows you to specify an alternate end-of-line value over the default newline.
Let’s amend log_request to use a vertical bar as the end-of-line value, as opposed to the default newline:

This works as expected: each web request now results in a single line of logged data, with a vertical bar delimiting each logged data item. Here’s what the data looks like in our log file when we used this amended version of log_request:

One Final Change to Our Logging Code
Working with overly verbose code is a pet peeve of many Python programmers. Our most recent version of log_request works fine, but it’s more verbose than it needs to be. Specifically, it feels like overkill to give each item of logged data its own print statement.
The print function has another optional argument, sep, which allows you to specify a separation value to be used when printing multiple values in a single call to print. By default, sep is set to a single space character, but you can use any value you wish. In the code that follows, the four calls to print (from the last page) have been replaced with a single print call, which takes advantage of the sep argument, setting it to the vertical bar character. In doing so, we negate the need to specify a value for end as the print’s default end-of-line value, which is why all mentions of end have been removed from this code:


Yes, this line breaks a PEP 8 guideline.
Some Python programmers frown at this last line of code, as the PEP 8 standard specifically warns against lines longer than 79 characters. At 80 characters, our line of code is pushing this guideline a little, but we think it’s a reasonable trade-off given what we’re doing here.
Remember: strict adherence to PEP 8 is not an absolute must, as PEP 8 is a style guide, not an unbreakable set of rules. We think we’re good to go.
Let’s see what difference this new code makes. Adjust your log_request function to look like this:
def log_request(req: 'flask_request', res: str) -> None:
    with open('vsearch.log', 'a') as log:
        print(req.form, req.remote_addr, req.user_agent, res, file=log, sep='|')
Then perform these four steps:
Save
vsearch4web.py(which restarts your webapp).Find and delete your current
vsearch.logfile.Use your browser to enter three new searches.
View the newly created log using the /viewlog URL.
Have another good look at your browser display. Is this better than before?

From Raw Data to Readable Output
The data displayed in the browser window is in its raw form. Remember, we perform HTML escaping on the data as read in from the log file but do nothing else before sending the string to the waiting web browser. Modern web browsers will receive the string, remove any unwanted whitespace characters (such as extra spaces, newlines, and so on), then dump the data to the window. This is what’s happening during our Test Drive. The logged data—all of it—is visible, but it’s anything but easy to read. We could consider performing further text manipulations on the raw data (in order to make the output easier to read), but a better approach to producing readable output might be to manipulate the raw data in such a way as to turn it into a table:


If our webapp could perform this transformation, then anyone could view the log data in their web browser and likely make sense of it.
Does This Remind You of Anything?
Take another look at what you are trying to produce. To save on space, we’re only showing the top portion of the table shown on the previous page. Does what you’re trying to produce here remind you of anything from earlier in this book?
Form Data | Remote_addr | User_agent | Results |
ImmutableMultiDict([(‘phrase’, ‘hitch-hiker’), (‘letters’, ‘aeiou’)]) | 127.0.0.1 | Mozilla/5.0 (Macintosh; Intel Mac OS X 10_11_2) AppleWebKit/537.36 (KHTML, like Gecko) Chrome/47.0.2526 .106 Safari/537.36 | {‘e’, ‘i’} |

Yes. That does look like something we’ve seen before.
At the end of Chapter 3, recall that we took the table of data below and transformed it into a complex data structure—a dictionary of dictionaries:
Name | Gender | Occupation | Home Planet |
Ford Prefect | Male | Researcher | Betelgeuse Seven |
Arthur Dent | Male | Sandwich-Maker | Earth |
Tricia McMillan | Female | Mathematician | Earth |
Marvin | Unknown | Paranoid Android | Unknown |
The shape of this table is similar to what we’re hoping to produce above, but is a dictionary of dictionaries the right data structure to use here?
Use a Dict of Dicts...or Something Else?
The table of data from Chapter 3 fit the dictionary of dictionaries model because it allowed you to quickly dip into the data structure and extract specific data. For instance, if you wanted to know Ford Prefect’s home planet, all you had to do was this:

When it comes to randomly accessing a data structure, nothing beats a dictionary of dictionaries. However, is this what we want for our logged data?
Let’s consider what we currently have.
Take a closer look at the logged data
Remember, every logged line contains four pieces of data, each separated by vertical bars: the HTML form’s data, the remote IP address, the identity of the web browser, and the results of the call to search4letters.
Here’s a sample line of data from our vsearch.log file with each of the vertical bars highlighted:

When the logged data is read from the vsearch.log file, it can arrive in
your code as a list of strings if you use the readlines
method (as readlines converts a file’s text to a list of strings on input). Because you probably
won’t need to randomly access individual data items from the logged data, converting the data
to a dictionary of dictionaries seems like a bad move. However, you need to process each line
in order, as well as process each individual data item within each line
in order. You already have a list of strings, so you’re half- way there,
as it’s easy to process a list with a for loop. However, the line of data
is currently one string, and this is the issue. It would be easier to process each line if it were a
list of data items, as opposed to one large string. The question is: is it possible to
convert a string to a list?
What’s Joined Together Can Be Split Apart
You already know that you can take a list of strings and convert them to a single string using the “join trick.” Let’s show this once more at the >>> prompt:

Thanks to the “join trick,” what was a list of strings is now a single string, with each list item separated from the next by a vertical bar (in this case). You can reverse this process using the split method, which comes built in to every Python string:

Getting to a list of lists from a list of strings
Now that you have the split method in your coding arsenal, let’s return to the data stored in the log file and consider what needs to happen to it. At the moment, each individual line in the vsearch.log file is a string:

Your code currently reads all the lines from vsearch.log into a list of strings called contents. Shown here are the last three lines of code from the view_the_log function, which read the data from the file and produce the large string from the list:

The last line of the view_the_log function takes the list of strings in contents and concatenates them into one large string (thanks to join). This single string is then returned to the waiting web browser.
If contents were a list of lists instead of a list of strings, it would open up the possibility of processing contents in order using a for loop. It should then be possible to produce more readable output than what we’re currently seeing on screen.
When Should the Conversion Occur?
At the moment, the view_the_log function reads all the data from the log file into a list of strings (called contents). But we’d rather have the data as a list of lists. The thing is, when’s the “best time” to do this conversion? Should we read in all the data into a list of strings, then convert it to a list of lists “as we go,” or should we build the list of lists while reading in each line of data?

The fact that the data is already in contents (thanks to our use of the readlines method) shouldn’t blind us to the fact that we’ve already looped through the data once at this point. Invoking readlines may only be a single call for us, but the interpreter (while executing readlines) is looping through the data in the file. If we then loop through the data again (to convert the strings to lists), we’re doubling the amount of looping that’s occurring. This isn’t a big deal when there’s only a handful of log entries...but it might be an issue when the log grows in size. The bottom line is this: if we can make do by only looping once, then let’s do so!
Processing Data: What We Already Know
Earlier in this chapter, you saw three lines of Python code that processed the lines of data in the todos.txt file:

You’ve also seen the split method, which takes a string and converts it to a list of strings based on some delimiter (defaulting to a space, if none is provided). In our data, the delimiter is a vertical bar. Let’s assume that a line of logged data is stored in a variable called line. You can turn the single string in line into a list of four individual strings—using the vertical bar as the delimiter—with this line of code:

As you can never be sure whether the data you’re reading from the log file is free of any characters that have special meaning to HTML, you’ve also learned about the escape function. This function is provided by Flask, and converts any string’s HTML special characters into their equivalent escaped values:

And, starting way back in Chapter 2, you learned that you can create a new list by assigning an empty list to it ([]). You also know that you can assign values to the end of an existing list by calling the append method, and that you can access the last item in any list using the [-1] notation:

Armed with this knowledge, see if you can complete the exercise on the next page.

Here is the view_the_log function’s current code:
@app.route('/viewlog')
def view_the_log() -> str:
    with open('vsearch.log') as log:
       contents = log.read()
    return escape(contents)
This code reads the data from the log file into a string. Your job is to convert this code to read the data into a list of lists.
Make sure that the data written to the list of lists is properly escaped, as you do not want any HTML special characters sneaking through.
Also, ensure that your new code still returns a string to the waiting web browser.
We’ve got you started—fill in the missing code:

Here is the view_the_log function’s code:
@app.route('/viewlog')
def view_the_log() -> str:
    with open('vsearch.log') as log:
       contents = log.read()
    return escape(contents)
Your job was to convert this code to read the data into a list of lists.
You were to ensure that the data written to the list of lists is properly escaped, as you do not want any HTML special characters sneaking through.
You were also to ensure that your new code still returns a string to the waiting web browser.
We’d started for you, and you were to fill in the missing code:

Don’t worry if this line of code from the above rewrite of the view_the_log function has your head spinning:

The trick to understanding this (initially daunting) line is to read it from the inside out, and from right to left. You start with the item from the enclosing for loop, which gets passed to escape. The resulting string is then appended to the list at the end ([-1]) of contents. Remember: contents is itself a list of lists.
Go ahead and change your view_the_log function to look like this:
@app.route('/viewlog')
def view_the_log() -> str:
    contents = []
    with open('vsearch.log') as log:
        for line in log:
            contents.append([])
            for item in line.split('|'):
                contents[-1].append(escape(item))
    return str(contents)
Save your code (which causes your webapp to reload), then reload the /viewlog URL in your browser. Here’s what we saw in ours:

Take a closer look at the output
At first glance, the output produced by this new version of view_the_log looks very similar to what you had before. But it isn’t: this new output is a list of lists, not a list of strings. This a crucial change. If you can now arrange to process contents using an appropriately designed Jinja2 template, you should be able to get pretty close to the readable output required here.
Generate Readable Output With HTML
Recall that our goal is to produce output that looks better on screen than the raw data from the last page. To that end, HTML comes with a set of tags for defining the content of tables, including: <table>, <th>, <tr>, and <td>. With this in mind, let’s take another look at the top portion of the table we’re hoping to produce once more. It has one row of data for each line in the log, arranged as four columns (each with a descriptive title).
You could put the entire table within an HTML <table> tag, with each row of data having its own <tr> tag. The descriptive titles each get <th> tags, while each piece of raw data gets its own <td> tag:
Geek Bits
Here’s a quick review of the HTML table tags:
<table>: A table.<tr>: A row of table data.<th>: A table column heading.<td>: A table data item (cell).
Each tag has a corresponding end tag: </table>, </tr>, </th>, and </td>.

Whenever you find yourself needing to generate any HTML (especially a <table>), remember Jinja2. The Jinja2 template engine is primarily designed to generate HTML, and the engine contains some basic programming constructs (loosely based on Python syntax) that you can use to “automate” any required display logic you might need.
In the last chapter, you saw how the Jinja2 {{ and }} tags, as well as the {% block %} tag, allow you to use variables and blocks of HTML as arguments to templates. It turns out the {% and %} tags are much more general, and can contain any Jinja2 statement, with one of the supported statements being a for loop construct. On the next page you’ll find a new template that takes advantage of Jinja2’s for loop to build the readable output from the list of lists contained in contents.
Embed Display Logic in Your Template
Below is a new template, called viewlog.html, which can be used to transform the raw data from the log file into an HTML table. The template expects the contents list of lists to be one of its arguments. We’ve highlighted the bits of this template we want you to concentrate on. Note that Jinja2’s for loop construct is very similar to Python’s. There are two major differences:
There’s no need for a colon (
:) at the end of theforline (as the%}tag acts as a delimiter).The loop’s suite is terminated with
{% endfor %}, as Jinja2 doesn’t support indentation (so some other mechanism is required).
Note
You don’t have to create this template yourself. Download it from http://python.itcarlow.ie/ed2/.
As you can see, the first for loop expects to find its data in a variable called the_row_titles, while the second for loop expects its data in something called the_data. A third for loop (embedded in the second) expects its data to be a list of items:


Producing Readable Output with Jinja2
As the viewlog.html template inherits from base.html, you need to remember to provide a value for the the_title argument and provide a list of column headings (the descriptive titles) in the_row_titles. And don’t forget to assign contents to the the_data argument.
The view_the_log function currently looks like this:

You need to call render_template on viewlog.html, and pass it values for each of the three arguments it expects. Let’s create a tuple of descriptive titles and assign it to the_row_titles, then assign the value of contents to the_data. We’ll also provide an appropriate value for the_title before rendering the template.
Remember: a tuple is a read-only list.
With all of that in mind, let’s amend view_the_log (we’ve highlighted the changes):

Go ahead and make these changes to your view_the_log function and then save them so that Flask restarts your webapp. When you’re ready, view the log within your browser using the http://127.0.0.1:5000/viewlog URL.
Here’s what we saw when we viewed the log using our updated webapp. The page has the same look and feel as all our other pages, so we are confident that our webapp is using the correct template.
We’re pretty pleased with the result (and we hope you are too), as this looks very similar to what we were hoping to achieve: readable output.
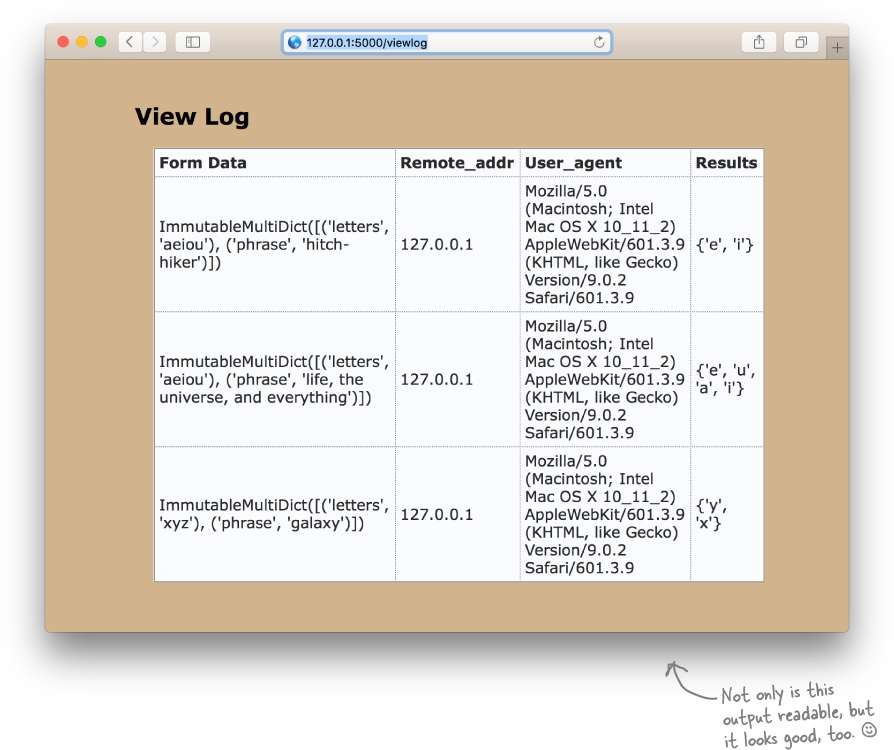
If you view the source of the above page—right-click on the page, then choose the appropriate option from the pop-up menu—you’ll see that every single data item from the log is being given its own <td> tag, each line of data has its own <tr> tag, and the entire table is within an HTML <table>.
The Current State of Our Webapp Code
Let’s pause for a moment and review our webapp’s code. The addition of the logging code (log_request and view_the_log) has added to our webapp’s codebase, but everything still fits on a single page. Here’s the code for vsearch4web.py displayed in an IDLE edit window (which lets you review the code in all its syntax-highlighted glory):

Asking Questions of Your Data
Our webapp’s functionality is shaping up nicely, but are we any closer to answering the questions posed at the start of this chapter: How many requests have been responded to? What’s the most common list of letters? Which IP addresses are the requests coming from? Which browser is being used the most?
The last two questions can be somewhat answered by the output displayed by the /viewlog URL. You can tell where the requests are coming from (the Remote_addr column), as well as see which web browser is being used (the User_agent column). But, if you want to calculate which of the major browsers is used most by users of your site, that’s not so easy. Simply looking at the displayed log data isn’t enough; you’ll have to perform additional calculations.
The first two questions cannot be easily answered either. It should be clear that further calculations must be performed here, too.

Only write more code when you have to.
If all we had available to us was Python, then, yes, we’d need to write a lot more code to answer these questions (and any others that might arise). After all, it’s fun to write Python code, and Python is also great at manipulating data. Writing more code to answer our questions seems like a no-brainer, doesn’t it?
Well...other technologies exist that make it easy to answer the sort of questions we’re posing without us having to write much more Python code. Specifically, if we could save the log data to a database, we could take advantage of the power of the database’s querying technology to answer almost any question that might arise.
In the next chapter, you’ll see what’s involved in amending your webapp to log its data to a database as opposed to a text file.
