
3.10 The Dodd–Frank Executive Compensation Reform Act (2010–2011)
In July 2010, President Obama signed into law the Dodd–Frank Wall Street Reform and Consumer Protection Act or Dodd–Frank Act, which was the culmination of the President and Congress’s controversial and wide-ranging efforts to regulate the financial services industry. In spite of its enormous length—the bill itself spans 848 pages—the Act leaves most of the details to be promulgated by a variety of government entities. Indeed, attorneys at DavisPolk (2010) calculate that the Act requires regulators from at least nine agencies to create 243 new rules, conduct 67 studies, and issue 22 periodic reports.
3.10.1 Pay Restrictions for Financial Institutions
While the pay restrictions in the TARP legislation apply only to banks receiving government assistance, the Dodd–Frank Act goes much further by regulating pay for all financial institutions (public or private, TARP recipients and non-recipients) including broker-dealers, commercial banks, investment banks, credit unions, savings associations, domestic branches of foreign banks, and investment advisors. Specifically, Part (a) of Section 956 of the Dodd–Frank Act requires all financial institutions to identify and disclose (to their relevant regulator) any incentive-based compensation arrangements that could lead to material financial loss to the covered financial institution, or that provides an executive officer, employee, director, or principal shareholder of the covered financial institution with excessive compensation, fees, or benefits. In addition, Part (b) of Section 956 of the Dodd–Frank Act prohibits financial institutions from adopting any incentive plan that regulators determine encourages inappropriate risks by covered financial institutions, by (1) providing an executive officer, employee, director, or principal shareholder of the covered financial institution with excessive compensation, fees, or benefits; or (2) that could lead to material financial loss to the covered financial institution.
Since at least the early 1990s, there has always been a tension between shareholders (the firm’s legal owners) concerned about CEO incentives, and uninvited guests (such as politicians and labor unions) concerned about high levels of pay. After the TARP bailouts in the financial crisis, the analogous tension was between taxpayers (who wanted to be protected from excessive risks while receiving an appropriate return on their investment) and politicians who were outraged about perceived excesses in banking bonuses. Section 956(b) of the Dodd–Frank Act deliberately conflates these tensions, by explicitly defining excessive compensation as an inappropriate risk. Moreover, Section 956(a) of the Dodd–Frank Act requires banks to inform their regulators of compensation plans that provide excessive compensation, delegating to the regulators the Herculean task of defining what compensation is excessive (or, indeed, which risks are inappropriate).
The responsibility for implementing Section 956 of the Dodd–Frank Act fell jointly to seven agencies: the Securities and Exchange Commission (SEC), the Federal Reserve System, the Office of the Comptroller of the Currency, the Office of Thrift Supervision, the Federal Deposit Insurance Corporation, the National Credit Union Administration, and the Federal Housing Finance Agency. In March 2011, the seven agencies issued a joint proposal for public comment, modeled in part on Section 39 of the Federal Deposit Insurance Act. While the proposal stops short of explicitly limiting the level of executive compensation, it prohibits compensation that is unreasonable or disproportionate to the amount, nature, quality, and scope of services performed. In addition, the proposal calls for firms to identify individuals who have the ability the expose the firm to substantial risk, and demands that (for the larger institutions) such individuals have at least 50% of their bonuses deferred for at least three years; deferred amounts would be subject to forfeiture if subsequent performance deteriorates. Final rules were expected in late 2012.
3.10.2 Pay and Governance Reforms for all Publicly Traded Companies
While ostensibly focused on regulating firms in the financial services industry, the authors of the Dodd–Frank Act seized the opportunity to pass a sweeping reform of executive compensation and corporate governance imposed on all large publicly traded firms across all industries. The new rules include:
Say-on-Pay (Section 951). Shareholders will be asked to approve the company’s executive compensation practices in a non-binding vote occurring at least every three years (with an additional vote the first year and every six years thereafter to determine whether the Say-on-Pay votes will occur every one, two, or three years). In addition, companies are required to disclose, and shareholders are asked to approve (again, in a non-binding vote), any golden parachute payments in connection with mergers, tender offers, or going-private transactions.
In January 2011 – and effective for the 2011 proxy season – the SEC adopted rules concerning shareholder approval of executive compensation and “golden parachute” compensation arrangements. Shareholders of 98.5% of the 2532 companies reporting 2011 results by July 2011 approved the pay plans; over 70% of the companies received more than 90% favorable support.143Similarly, shareholders of 98.2% of the 1875 companies reporting 2012 results by June 2012 approved the pay plans; 72% of the companies received more than 90% favorable support.144Twenty six of the 30 companies receiving less than 50% positive votes in 2011 passed in 2012, and year-over-year favorable votes increased by 14% for companies receiving between 50% and 70% favorable votes in 2011.
Clawbacks (Section 954).
Companies must implement and report policies for recouping payments to executive based on financial statements that are subsequently restated. The rule applies to any current or former executive officer (an expansion of Sarbanes-Oxley, where only the CEO and CFO were subject to clawbacks), and applies to any payments made in the three-year period preceding the restatement (Sarbanes-Oxley only applied for the twelve months following the filing of the inaccurate statement).
The SEC had neither adopted nor proposed rules regarding the recovery of executive compensation by August 2012. However, Equilar reports that 86% of the Fortune 100 companies issuing proxy statements in 2012 had publicly disclosed clawback arrangements; in half of the companies the clawback triggers were related to financial restatements and ethical misconduct.145
Additional Disclosures (Sections 953, 955, 972).
Companies must report the ratio of CEO compensation to the median pay for all other company employees. Companies must analyze and report the relation between realized compensation and the firms financial performance, including stock-price performance. In addition, companies must disclose its policies regarding hedging by employees to protect against reductions in company stock prices. Finally, the Dodd–Frank Act requires companies to disclose their policies and practices on why the company chooses either to separate the Chairman and CEO positions, or combine both roles.
The SEC had neither adopted nor proposed rules regarding the disclosure of pay ratios, pay-for-performance, hedging and CEO/Chair combinations by August 2012.
Compensation Committee Independence (Section 952).
Following Sarbanes-Oxley (2002) requirements for Audit Committees, publicly traded companies are required to have compensation committees comprised solely of outside independent directors (where independence takes into account any financial ties the outside directors might have with the firm. In addition, companies must assess the independence of compensation consultants, attorneys, accountants, and other advisors to the compensation committees.
In June 2012, the SEC adopted final rules directing exchanges to establish listing standards guaranteeing that members of the compensation committee (or directors who oversee executive compensation matters in the absence of a committee) to be independent. While leaving the precise definition of “independence” to the exchanges, the final rule required exchanges to consider the director’s source of compensation (including consulting or advisory fees) paid by the issuer, and whether the director is affiliated with the issuer, a subsidiary of the issuer, or an affiliate of a subsidiary of the issuer.
In addition, the new SEC rules require firms to ensure that compensation committees have authority and funding to retain compensation consultants. While neither the Act nor the June 2012 Final Rule issued by the SEC required compensation advisors to be independent, the SEC imposed a list of independence criteria that boards must consider in retaining a consultant. Finally, proxy statements issued in connection with annual shareholder meetings in 2013 and after must disclose whether the work of the consultant has raised any conflict if interest and, if so, the nature of the conflict and how the conflict is being addressed.
Proxy Access (Section 971).
The Dodd–Frank Act authorized the SEC to issue rules allowing certain shareholders to nominate their own director candidates in the company’s annual proxy statements.
The SEC issued its rules on Proxy Access in August 2010, but delayed implementation after lawsuits by the Business Roundtable and the US Chamber of Commerce claimed that the rules would distract management and advance special-interest agendas. In July 2011, the US Circuit Court of Appeals (Washington, DC) ruled in favor of the business groups and rejected the SEC’s rule. As of August 2012, the SEC had not announced whether it would attempt to rewrite the rule in a way that would be acceptable to the Court.
It is too early to assess the ultimate effect of Dodd–Frank on executive compensation, since many of the rules have just been implemented or are still being written. However, based on experiences with similar rules, I can speculate on the ultimate impact.
Say on Pay. In mandating Say-on-Pay, the Dodd–Frank Act follows similar rulings for non-binding shareholder votes enacted in the United Kingdom in 2002 and later in Australia, Denmark, France, Portugal, Spain, and Sweden; the Netherlands and Norway went a step further by allowing binding shareholder votes. Say-on-Pay had long been a favorite objective of Democrats in Congress, and the Say-on-Pay Bill passed the House in April 2007 by a 2:1 margin. While the companion bill introduced in the Senate by then-Senator Obama was shelved prior to a vote, Say-on-Pay was widely expected to become law following the 2008 presidential election, especially after Say-on-Pay was mandated for TARP recipients as part of the Dodd Amendments.
In spite of the support, however, there is modest evidence that Say-on-Pay results in important changes to compensation practices. In the United Kingdom (where we have the most data), there is some evidence that negative Say-on-Pay votes have led to some reductions in salary continuation periods in severance agreements and some changes in performance-based vesting conditions in equity plans, but no evidence that the votes have affected compensation levels (Ferri and Maber, 2010). In the United States, where shareholders voted on the compensation for TARP executives for the first time in early 2009, the plans were passed at all firms, with an average of 88.6% of the votes cast in favor of management. Among the TARP recipients garnering the strongest support were the Wall Street firms whose compensation systems allegedly fostered the financial crisis, including Goldman Sachs (98%), AIG (98%), JPMorgan (97%), Morgan Stanley (94%), Citigroup (84%), and Bank of America (71%).146
As emphasized in this chapter, regulation inevitably produces unintended consequences. The most obvious (and most negative) unintended consequence associated with Say-on-Pay reflects the increasing influence of proxy-advisory firms (primarily Institutional Shareholder Service (ISS)). To fulfill their required fiduciary duties to vote proxies, institutional investors routinely rely on ISS and other proxy-advisory firms for recommendations on how to vote on Say-on-Pay and other proxy matters. In turn, the proxy-advisory firms rely on a limited (and controversial) set of quantitative criteria to determine whether to offer positive or negative voting recommendations.147 In a broad sample of Russell 3000 firms, Larcker, McCall, and Ormazabal (2012) show: (1) the recommendations of the proxy-advisory firms do, indeed, affect voting outcomes; (2) anticipating this result, firms change their compensation policies to avoid negative recommendations; and (3) the market reaction to these changes is statistically negative.
Firms inherently face different competitive and incentive challenges, and there is neither a “one-size-fits-all” solution to these challenges, nor a limited set of quantitative criteria that can substitute for a careful and holistic assessment of compensation plans that takes into account company-specific situations and objectives. Ultimately, the benefits of adhering to the ISS criteria must be weighed against the cost associated with reduced innovation and flexibility in the provision of compensation and incentives.
Compensation Committee and Advisor Independence. The Dodd–Frank provisions on the independence of the compensation committee will have little practical effect for large companies, since the listing requirements of the NYSE and NASDAQ have required independent compensation committees since 2003, and the IRS has required independent compensation committees (for Section 162(m) purposes) since 1994. The provision related to the independence of compensation consultants, in combination with SEC disclosure rules introduced in December 2009, will encourage more committees to retain their own independent consultant in addition to the consultants engaged by management.148
Clawback Provisions. The Sarbanes-Oxley experience shows that companies rarely try to recover erroneously awarded compensation from their CEO and CFO, often citing potential litigation costs and the feasibility of recouping money that has already been paid and taxed. The Dodd–Frank provision makes it more difficult for boards to shirk their responsibility to recovery erroneously awarded pay, and indeed likely subjects boards to shareholder litigation if they fail to even try.
Ratio of CEO-to-Worker Pay. The most mischievous and controversial compensation provision in Dodd–Frank is the required disclosure of the ratio of CEO pay to the median pay of all employees. The calculation costs alone can be immense for large multinational or multi-segment corporations where payroll is decentralized: to compute the median the company needs an often non-existent single compensation database with all employees worldwide. More importantly, however, is what shareholders are supposed to do with this new information, or how they should determine whether a ratio is too high or too low. Ultimately, this provision reflects a belief in Congress that CEO pay is excessive and its sole purpose is the hope that disclosing the ratio will shame boards into lowering CEO pay.
Proxy Access. Finally, potentially most important is the Proxy Access rule allowing shareholders to include their director nominees on the proxy alongside with the board’s nominees. In issuing its rule in August 2010, the SEC limited access to shareholders who have held at least 3% of the company’s stock for at least three years. One view is that Proxy Access will provide shareholders with a critical mechanism to replace poor directors with better ones. A more-cynical view—expressed by the Wall Street Journal and others—is that 3% was chosen as the sweet spot for labor unions and other politically motivated organizations who will use their leverage over the proxy statement to force companies to support political causes rather than increasing shareholder value.149 In its July 2011 ruling rejecting the SEC’s rule, the US Circuit Court of Appeals (Washington, DC) issued a sharp rebuke to the SEC, saying that the SEC failed in analyzing the cost the rule imposes on companies and in supporting its claim that the rule would improve shareholder value and board performance.150
4 International Comparisons: Are US CEOs Still Paid More?
4.1 The US Pay Premium: What We Thought We Knew151
Among the best-known “stylized facts” about executive compensation is that CEOs in the United States are paid significantly more than similarly situated CEOs in foreign corporations (e.g. Abowd and Bognanno, 1995; Abowd and Kaplan, 1999; Murphy, 1999). However—although widely accepted by academics, regulators, and the media—this stylized fact has not generally been based on consistent and comprehensive pay data across a large number of countries with controls for cross-country differences in firm characteristics. In particular, while the United States has required detailed disclosures on executive compensation since the 1930s, the majority of other countries have historically required reporting (at most) the aggregate cash compensation for the top-management team, with no individual data and little information on the prevalence of equity or option grants.
In fact, prior to 2000, only Canada (which mandated pay disclosures in 1993) and the United Kingdom (based on disclosure recommendations issued in 1995) required US-style full disclosure of CEO compensation (including details on equity grants). Based on data from 1993 to 1995, Zhou (2000) shows that US CEOs earned more than double their Canadian counterparts. Conyon and Murphy (2000) show that US CEOs earned almost 200% more than British CEOs in 1997, after controlling for industry, firm size, and a variety of firm and individual characteristics. Conyon, Core, and Guay (2011) show that the US versus UK Pay Premium had fallen to 40% by 2003 and plausibly disappears after adjusting for the risk associated equity-based compensation.
Other multi-country pay comparisons have typically relied on aggregate or average executive pay across groups of executives, usually excluding equity-based pay).152 For example, Conyon and Schwalbach (2000)’s comparison of UK and German compensation from 1968 to 1994 focused on only cash compensation for the United Kingdom (because the study predated the UK recommendations on disclosing stock options) and average cash compensation for Germany (because German rules required only disclosing the total cash paid across the group of top managers). Similarly, Muslu (2008)’s study of the largest 158 European companies from 1999 to 2004 (based on hand-collected annual reports) presents a mixture of individual and aggregated compensation data. Bryan, Nash, and Patel (2006) relied on SEC Form 20-F filings from 1994 to 2004 for foreign companies cross listing in the United States; however, cross-listed companies are only required to disclose compensation for individual executives if such disclosure is required in the home country, and as a result most of their analysis was based on average compensation for the management group.
Beyond the comparisons with Canada and the United Kingdom, and the handful of studies based on aggregate cash compensation data, much of what we know (or thought we knew) about international differences in CEO pay has been based on Towers Perrin’s biennial Worldwide Total Remuneration reports, utilized (for example) by Abowd and Bognanno (1995), Abowd and Kaplan (1999), Murphy (1999), and Thomas (2008) (not coincidentally, the same cites as in the first paragraph). These international comparisons—which have typically suggested that US CEOs are paid more than twice the “going rate” for CEOs in other countries—are not based on “data” per se, but rather depict the consulting company’s estimates of “typical” or “competitive” pay for a representative CEO in an industrial company with an assumed amount in annual revenues, based on questionnaires sent to consultants in each country. While crudely controlling for industry and firm size (by design), it is impossible using these surveys to control for other factors that might explain the US “pay premium”, such as ownership and board structure or individual CEO characteristics.
The disclosure situation has improved markedly over the past decade. Regulations mandating disclosure of executive pay were introduced in Ireland and South Africa in 2000 and in Australia in 2004. In May 2003, the European Union (EU) Commission issued an “Action Plan” recommending that all listed companies in the EU report details on individual compensation packages, and that EU member countries pass rules requiring such disclosure. By 2006, six EU members (in addition to the United Kingdom and Ireland) had mandated disclosure: Belgium, France, Germany, Italy, Netherlands, and Sweden. In addition, although not in the EU, Norway also adopted EU-style disclosure rules, and Switzerland demanded similar disclosure for the “highest-paid” executive.
4.2 New International Evidence
In my joint work with Nuno Fernandes, Miguel Ferreira and Pedro Matos (Fernandes et al., 2012)—based on recently available data from 14 countries with mandatory pay disclosures—we show that the stylized fact that US CEOs earn substantially more than foreign CEOs is wrong, or at least outdated. In particular, we show that the “US Pay Premium” became statistically insignificant by 2007 and largely reflects a risk premium for stock-option compensation (which remains more prevalent in the United States than in other countries).
In reaching our conclusion that the US Pay Premium has become modest (or insignificant), we control not only for the “usual” firm-specific characteristics (e.g. industry, firm size, volatility, and performance) but also for governance characteristics that systematically differ across countries: ownership and board structure. Compared to non-US firms, US firms tend to have higher institutional ownership and more independent boards, factors associated with both higher pay and increased use of equity-based compensation. In addition, shareholdings in US firms tend to be less dominated by “insiders” (such as large-block family shareholders), factors associated with lower pay and reduced use of equity-based compensation.
Figure 23 traces the evolution of the US pay premium from 2003 to 2008 (based on results in Table 8 of Fernandes et al., 2013). The premium is defined as eβ1 − 1 in the following regression, estimated annually for a pooled sample of US and non-US CEOs:
![]()
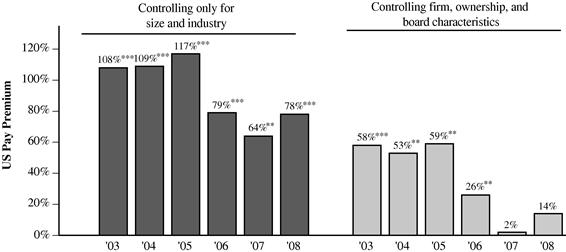
Figure 23 The evolving (and disappearing) US Pay Premium. Note: The figure shows the US Pay Premium implied by regression Ln(CEO Pay) on a US dummy variable plus controls for industry and company revenues (left-hand panel) and also other firm characteristics, ownership structure, and board structure (right-hand panel) for each year from 2003 to 2008. ***, **, * indicates that the coefficient on the US premium on each underlying regression depicted above is significant at the 1, 5, and 10% levels, respectively. Source: Fernandes et al. (2013), Table 8.
The sample consists of between 1426 and 1532 US firms and between 781 and 1480 non-US firms per year. US data are extracted from ExecuComp, while non-US data are based primarily on BoardEx and supplemented with hand-collected data from filings.
The “Firm Characteristics” in the left-hand panel of Figure 23 include only controls for company size (Ln(Revenues)) and industry (fixed effects for 12 Fama-French industries). As shown in the figure, the implied US Pay Premium fell significantly from over 100% in 2003–2005 to less than 80% in 2006–2008. The right-hand panel includes additional controls for leverage, Tobin’s Q, stock volatility, stock returns, ownership structure (the fraction of shares held by insiders and institutions) and board structure (board size, independence, the average number of board positions held by each board member, and a dummy variable indicating that the CEO also holds the title of Chairman). As shown in the figure—after including these additional controls—the implied US Pay Premium declined from nearly 60% in 2003 to only 26% in 2006 and 2% in 2007.
Figure 24 shows the international distribution of predicted 2006 CEO pay for a hypothetical firm with $1 billion sales, based on the specification used for Figure 23 with the “US dummy” replaced by a set of 14 country dummies. Panel A, in the spirit of the Towers Perrin estimates, controls only for firm size and industry, while Panel B controls for industry, firm characteristics, ownership, and board characteristics. The pay composition percentages are defined as the average composition across all CEOs for each country. The figure shows that US CEOs earn substantially more than non-US CEOs controlling only for size and industry. However, after controlling for firm, ownership, and board characteristics, we find effective parity in CEO pay levels among Anglo-Saxon nations (United States, United Kingdom, Ireland, Australia, and Canada) and also Italy.
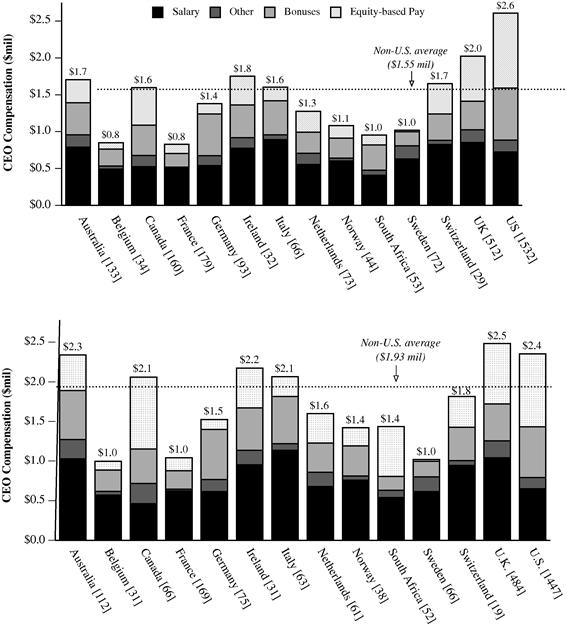
Figure 24 2006 CEO pay after controlling for firm characteristics, ownership, and board structure Panel A. Controlling only for sales and industry Panel B. Controlling for sales, industry, and firm, ownership, and board characteristics Note: The figure compares 2006 CEO pay in each country controlling for firm size (sales) and industry in Panel A, and controlling for size, industry, and firm, ownership, and board characteristics in Panel B. We regress the logarithm of total compensation on the logarithm of sales and 12 industry and 14 country dummies. For each country, we estimate the pay for a CEO running a hypothetical firm with $1 billion in sales using the estimated coefficient for pay-size sensitivity and controlling for the “average” industry. The non- US average is weighted by the number of firms in each country. The pay composition percentages are defined as the average composition across all CEOs for each country. Source:Fernandes, et al. (2013), Figure 1.
As an extension to the results in Figures 23 and 24, we also compare international differences in risk-adjusted pay, using methodologies similar to that used above in Section 2.1.2 and Figure 7.153 Consistent with the conclusions of Conyon et al. (2013) (who use a different methodology and consider only US–UK comparisons), we find that the risk-adjusted US pay premium for 2006 is statistically insignificant after controlling for governance (but remains significant before such controls), and that risk-adjusted pay in the US is significantly less than CEO pay in the United Kingdom and Australia, and insignificantly different from CEO pay in Canada, Italy and Ireland.
In addition, we show that both the level and structure of 2006 pay for US CEOs is insignificantly different from that of non-US CEOs of “internationalized” firms, which we define as firms above the 75th percentile ranked by foreign institutional ownership, foreign sales (as a fraction of total sales), or board international diversity (defined as the number of different nationalities represented on the board of directors divided by the total board size). We also find insignificant differences between US CEOs and non-US CEOs in firms included in the 1500-firm Morgan Stanley Capital International All Country World Index (routinely used as a benchmark for global equity mutual funds and used here as a proxy for foreign investor demand).
Finally, we find no significant differences in the level or structure of pay when US CEOs are compared to non-US CEOs of “Americanized” firms, which we define as firms cross-listed on US exchanges (as a proxy for demand by US investors) or above the 75th percentile ranked by US institutional ownership, total acquisitions of US companies between 1996–2005 (as a proxy for exposure to US product and labor markets), and the fraction of directors who also sit on boards of companies headquartered in the United States (as a proxy for exposure to US pay practices).
Overall, our evidence is inconsistent with the view that US CEO pay is “excessive” when compared to that of their foreign counterparts, but rather reflects tighter links between CEO pay and shareholder performance in US firms. First, we show that the US pay premium is modest after controlling for firm, ownership, board, and CEO characteristics. Second, we demonstrate that it is misleading to examine cross-sectional or cross-country differences in the level of pay in isolation, without also examining differences in the structure of pay, namely the use of equity-based compensation. In fact, the firm, ownership, and board characteristics associated with higher pay are those associated with a larger fraction of equity-based pay. Third, we find that CEO pay levels and the use of equity-based compensation are positively related to variables routinely used as proxies for better monitoring and better governance, namely institutional ownership and board independence. Fourth, our findings suggest that the observed US CEO pay premium reflects compensating differentials for the equity-based pay increasingly demanded by internationally diverse boards and shareholders. We find evidence that foreign and US institutional shareholders are linked to a greater use of equity-based pay and higher pay levels in non-US firms in which they invest. Finally, the convergence of US and non-US CEO pay levels since 2003 seems to be explained by the convergence of ownership structures and globalization of capital markets.
4.3 Why do US CEOs Receive More Options?
Our finding that the US pay premium largely disappears after controlling for the relative riskiness of US pay packages potentially “explains” the pay differences but naturally leads to another question: Why do US executives receive more equity-based compensation than their foreign counterparts?
While equity-based compensation has been a staple of US compensation contracts for more than a half-century, the use of equity-based pay outside the United States is a relatively recent phenomenon. Panel A ofTable 3 shows how the importance of equity-based pay has changed over time in the United States and in nine European countries using Towers Perrin’s Worldwide Total Remuneration (WWTR) surveys for the selected years 1984, 1988, 1992, 1996, 1999, 2001, and 2003. The data for the years 1992–1996 are based on the Abowd and Kaplan (1999) analysis of the WWTR surveys. As shown in Panel A, only France and the UK made extensive use of stock or options in the 1980s, and equity-based pay did not become common across Europe until the end of the 1990s. By 2003, Towers Perrin reports that equity-based pay accounts for between 10% and 20% of competitive pay for European CEOs, and for about half the pay of American CEOs.
Table 3 Stock-based pay (as a percentage of total pay) in Europe and the United States
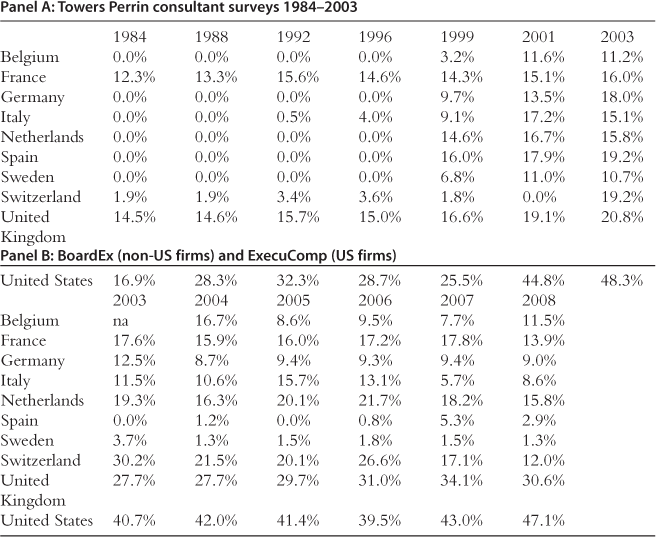
Note: Data in Panel A are from Towers Perrin’s Worldwide Total Remuneration reports (various issues), including 1984–1992 data reported by Abowd and Kaplan (1999). Data reflects Towers Perrin’s estimate of competitive CEO pay for industrial companies with approximately US $300 million in annual revenues. Stock-based pay includes the grant-date expected value of option grants and annualized targets from performance share plans. Data in Panel B are from BoardEx and ExecuComp. The percentages in Panel B are constructed by first computing the average ratio of equity-based pay to total compensation for each CEO, and then averaging across CEOs.
As discussed earlier, the data in Panel A of Table 3 are not CEO pay “data” per se, but rather consulting company’s estimates of “typical” or “competitive” pay for a representative CEO in an industrial company, based on questionnaires sent to consultants in each country. In Panel B of Table 3, I provide my own estimates of equity-based pay for 2003–2008 based on actual grant-date values extracted from BoardEx (for Europe) and ExecuComp (for the United States). The actual averages for 2003 in Panel B are generally consistent with the consultant surveys in Panel A for the same year, increasing my confidence in both data sources. As shown in Panel B, the use of equity-based compensation has generally declined in continental Europe between 2003 and 2008, and has remained relatively constant in the United Kingdom at just under a third of total compensation. In contrast, the use of equity-based pay has increased in the United States.
Traditional agency theory suggests a finite number of factors that might explain a greater use of incentive-based pay among US executives. First, US CEOs may be less risk averse or have steeper marginal costs of effort than their non-US counterparts, but to our knowledge there is no theory or empirical work suggesting such international differences in risk-aversion coefficients. Second, performance of non-US firms might be measured with substantially more noise than for US firms, leading to lower pay-performance sensitivities and lower expected levels of pay. However, we find no evidence that cash flows or shareholder returns are systematically more variable in our sample of non- US firms than in US firms. Extensions of the traditional model to incorporate differences in both ability and in the marginal productivity of CEO effort might help reconcile the data, but only given the additional assumptions that executives are more able and more productive in the United States. Overall, there are no compelling agency-theoretic explanations for the relative reliance on equity-based compensation in the United States.154
In unreported analysis, we attempt to explain international differences in the use of equity-based compensation by a variety of country-level variables routinely used in international studies of corporate governance to measure differences in the economic, law, and institutional environment of each country.155 We find that CEO equity-based pay (and total pay) is more prevalent in common-law countries (La Porta et al., 1998) which in turn is largely defined by the United Kingdom and its former colonies, including (in our sample) Australia, Canada, Ireland, South Africa, and the United States, and countries with stronger investor protections and private control of self-dealing (Djankov et al., 2008). We also consider different aspects of a country’s regulatory environment. We find a positive association between CEO equity-based pay and the levels of compensation disclosure and director liability (La Porta, Lopez-De-Silanes, and Shleifer, 2006); note that the United States scores high in both indices. We find that equity-based pay is lower in countries with friendlier collective labor laws and countries where labor unions are more powerful (Botero et al., 2004), such as in Continental European countries (e.g. France and Germany). In contrast, differences in CEO pay are not explained by GDP per capita levels.
Ultimately, the cross-country differences in the prevalence of equity-based compensation may be driven by idiosyncratic events that in some cases encouraged, and in others discouraged, the use of stock options and restricted stock. For example, as documented in Section 3, America’s reliance on stock options as the primary form of long-term compensation began in the 1950s as a result of tax policies designed to promote options, and declined in the late 1960s when the government reduced tax benefits. The early 1990s created a “perfect storm” for an explosion of option grants for not only executives but also lower-level managers and employees. The explosion in option grants continued unabated until the burst of the Internet bubble in 2000, followed by a series of accounting scandals that re-focused attention on the accounting treatment of options. Eventually, FASB mandated expensing, and companies moved away from options toward restricted stock.
Conyon et al. (2013) provide an analogous description of the evolution of equity-based pay in Europe. For example, the widespread adoption of stock-option plans in Europe initially emerged as governments provided tax incentives to encourage their use in the United Kingdom (in 1982), France (1984), and Italy (1998). Controversies in the United Kingdom in the 1990s involving perceived option excesses at recently privatized utilities led to a shift from options to restricted stock; concerns over excessive executive pay led France to revoke its tax subsidies on options in 1995, and Italy to revoke its tax subsidies in 2006. In Germany, option plans were not even legalized until 1996, and were still challenged in a series of high-profile lawsuits brought by a maverick college professor. In 1999, the Spanish government increased taxes on stock options after it was revealed that the CEO of the recently privatized telephone company was about to make a fortune exercising options.
In each country, ebbs and flows in option grants followed government intervention, usually reflecting tax or accounting policies and often reactions to isolated events or situations. Since the triggering events vary across countries, the nature of the government intervention—and the subsequent use of stock options—has also varied. The “perfect storm” that triggered the US option explosion (i.e. the “six factors” explored in Section 3.7 above) has not been repeated elsewhere in the world, and therefore the use of options (and equity-based pay in general) continues to be much higher in the United States.
5 Towards a General Theory of Executive Compensation
The academic literature focused on explaining cross-sectional differences and time-series trends in executive compensation is roughly divided into two camps: the “efficient contracting” camp and the “managerial power” camp. The efficient contracting camp maintains that the observed level and composition of compensation reflects a competitive equilibrium in the market for managerial talent, and that incentives are structured to optimize firm value. The managerial-power camp maintains that both the level and composition of pay are determined not by competitive market forces but rather by powerful CEOs, often working through or influencing captive board members. Most papers in the literature have adopted one approach or the other (often implicitly), and an increasing number of papers have treated the two approaches as competing hypotheses, attempting to distinguish between them empirically.
Ultimately, viewing efficient contracting and managerial power as competing hypotheses to “explain” executive compensation has not been productive. First, the hypotheses are not mutually exclusive; indeed, the same institutions that have evolved to mitigate conflicts of interest between managers and shareholders (i.e. efficient contracting) have simultaneously allowed executives to extract rents (i.e. managerial power). For example, the first “line of defense” against agency problems are the outside members of the board of directors, elected by shareholders and responsible for monitoring, hiring, firing, and setting top-executive compensation. However, these outside board members—who pay executives with shareholder money and not their own—are in no sense perfect agents for the shareholders who elected them. Instead of viewing efficient contracting and managerial power as competing hypotheses, it is more productive to acknowledge that outside-dominated boards mitigate agency problems between managers and shareholders but create agency problems between shareholders and directors. Rigidly adopting either extreme hypothesis—that director incentives are fully aligned with shareholder preferences or with those of incumbent CEOs—will inevitably result in less interesting and less realistic conclusions.
More importantly, viewing executive compensation as a “horse race” between efficient contracting and managerial power ignores other forces that may be even more important in explaining trends in pay. A central theme of this study is that government intervention into executive compensation—largely ignored by researchers—has been both a response to and a major driver of time trends in CEO pay. The reason political influence on CEO pay adds an important new dimension to the agency problem is because the interests of the government differ significantly from those of shareholders, directors, and executives. In particular, Congressional (and, more generally, populist) outrage over executive pay is almost always triggered by perceived excesses in the level of compensation without regard to incentives and company performance, and the regulatory responses have also fixated on pay levels (albeit with little effect). In contrast, while shareholders have a legitimate concern over pay levels, their primary concern is whether executives have incentives to take actions that increase firm value, while avoiding value-destroying actions. Self-interested CEOs naturally prefer higher pay to lower pay. Directors, who are elected by shareholders but often selected by CEOs, appear to prefer better-aligned incentives but are not particularly interested in restraining pay levels.
5.1 Agency Problems: Solutions and Sources
The early 1900s witnessed the emergence of large publicly traded corporations with complex management structures that competed with and often displaced owner-managed and family-founded enterprises. Accompanying the rise in the “American Corporation” was the emergence of “professional executives”—non-owners hired to manage the firm’s assets on behalf of passive and dispersed owner-shareholders (Wells, 2010). As noted by Smith (1776) in the context of 18th-century British “joint-stock” companies:
“Being managers rather of other people’s money than of their own, it cannot well be expected, that they should watch over it with the same anxious vigilance with which the partners in a private copartnery frequently watch over their own…Negligence and profusion, therefore, must always prevail, more or less, in the management of the affairs of such a company.”
The conflicts identified by Smith (1776) arising between the owners of large publicly traded corporations and their hired executives is the quintessential “agency problem” explored by Berle and Means (1932) and Jensen and Meckling (1976). There are at least three versions of this agency problem:
• The Agency Cost of Equity, reflecting the fact that executives who own less than 100% of the shares of an all-equity firm will not make the same decisions (or “watch over it with the same anxious vigilance”) they would if they owned 100% of the shares. Executives (usually assumed to be risk averse) want to be paid more and to take actions that increase their own utility, while shareholders (usually assumed to be risk neutral, or close to it) are primarily concerned with providing executives with incentives to take actions that increase the value of their shares.
• A variant of the Agency Cost of Equity is the “Agency Cost of Free Cash Flow” proposed by Jensen (1986a), reflecting the conflict of interest between executives and financial claimants on the disposition of cash flows in excess of those required to fund all positive net-present-value projects. While value is maximized by returning free cash flow to shareholders in the form of dividends or repurchases, empire-building executives prefer to retain and reinvest free cash flow unproductively in projects that destroy shareholder value. Debt financing mitigates free cash flow problems by pre-committing executives to pay out rather than retain future cash flows.
• The Agency Cost of Debt, reflecting the potential conflict of interest that exists between a company’s shareholders and its debtholders: shareholders in a leveraged firm prefer riskier investments than those that would maximize firm value, while debtholders prefer safer investments than those that would maximize firm value.156 In addition, dividends and other payouts to shareholders may harm debtholders by jeopardizing the company’s ability to service its debt. While the Agency Cost of Debt is clearly valid conceptually, there is little empirical evidence that leverage indeed leads to excessive risk taking, for several reasons. First, precisely because these conflicts are well understood, the potential problem is mitigated through debt covenants and constraints on how the proceeds from debt financing can be used. Moreover, since the problem is “priced” into the terms of the debt (with debtholders charging higher interest råtes in situations where executives have incentives to take higher risks), firms anticipating repeat trips to the bond market are directly punished for their risky behavior. The potential for conflicts are exacerbated, however, when the debtholders (or other fixed claimants, such as depositors) are protected against losses by the government. Such government guarantees can be explicit (such as FDIC insurance on deposits) or implicit (such as “Too Big To Fail” (TBTF) guarantees)). In these situations, the debtholders (or depositors) have little incentive to monitor management or enforce debt covenants, since the government is expected to cover losses.
While the labels on the various agency problems may be useful, they are all examples of the underlying agency conflict that arises when decision makers do not bear 100% of the wealth consequences of their decisions. As emphasized by Jensen (1993) there are four forces that mitigate agency problems between executives and the owners of large publicly traded corporations: (1) boards of directors; (2) capital markets; (3) the legal/political/regulatory system; and (4) product markets. However, while each of these forces can (and have) played a productive role in reducing agency conflicts, they also can (and have) created new problems, as follows.
5.1.1 Boards of Directors
The first line of defense against agency problems is the board of directors, elected by shareholders and responsible for monitoring, hiring, firing, and setting the compensation of the CEO and top-management team. For most of the prior century, boards were dominated by current executives and other corporate insiders. However, beginning with the shareholder movement in the 1980s (Section 3.6.2 above), firms have faced pressures for increased outsider representation on boards. By the end of the 1990s, the fraction of outside directors serving on the average board had increased to 80%, and the CEO was the sole insider in nearly half of all firms (Horstmeyer, 2011).
Conceptually, outside directors reduce agency problems by threatening errant executives with termination and by implementing incentive contracts that tie pay to value creation. The contracts that evolve from this setting will typically tie CEO pay to the creation of shareholder value, thus providing the theoretical justification for stock options, restricted stock, and other forms of equity-based compensation. Under the efficient contracting hypothesis, the contracts will be those that maximize shareholder value, while paying the CEO enough “expected” compensation or utility to get him to take the job, and recognizing that CEOs will respond predictably to the incentives provided by the contract.157
However, outside directors—who often own only a trivial fraction of their firm’s common stock—are in no sense perfect agents for the shareholders who elected them. Board members are “reluctant to terminate or financially punish poor-performing CEOs because [board members] personally bear a disproportionately large share of the non-pecuniary costs [of such terminations], but receive essentially none of the pecuniary benefits” (Baker, Jensen, and Murphy, 1988, p. 614). Similarly, board members are willing to over-compensate adequately performing CEOs, since they are paying with shareholder money and not their own. As documented by Fracassi and Tate (2012), even “outside” board members often share important social ties with incumbent CEOs, especially in cases with powerful CEOs who presumably influence the director-nomination process. This agency problem between shareholders and their elected representatives forms the basis of the “managerial power hypothesis”, in which powerful CEOs are able to influence both the level and composition of their own compensation packages. However, as discussed in Section 5.2.1 below, the agency problem is perhaps even more apparent in situations not involving powerful incumbents, such as directors overpaying CEOs hired from the outside.
5.1.2 Capital Markets
As discussed in Section 3.6.1, the executive compensation practices of the 1970s provided few incentives for executives to pursue value-increasing reductions in excess capacity and disgorgements of excess cash. However, pressures to improve performance, disgorge cash, and create wealth were ultimately introduced by the capital markets. The takeovers in the 1980s—often financed with newly available high-yield debt—provided credible competition for poorly performing incumbent managers. Wealth was created by both the post-merger activities of the acquiring firms (such as firing incompetent incumbent managers) and by responses to the takeover threat (such as excess spending cash to repurchase shares). Debt created value by providing commitments that the firm would pay its cash flows to debtholders, reducing the amounts available for executives to waste.
Capital markets—in particular, shareholder activists and large-block institutional stockholders—have mitigated agency problems by pressuring companies to strengthen links between CEO wealth and company stock-price performance. Fernandes et al. (2013), for example, show that the fraction of CEO pay delivered in the form of stock or options increases with institutional ownership. Hartzell and Starks (2003) show that CEO pay-performance sensitivities increase with the concentration of institutional ownership. In an international study, Aggarwal et al. (2011) find that the performance-related CEO turnover also increases with institutional ownership.
Capital markets have also, however, contributed to agency problems by providing executives with incentives to take actions to meet or beat analyst and market earnings expectations. As discussed in Section 2.4 and shown in Figure 12, executives have incentives to beat analysts forecasts by a small amount but not by too much because the abnormal stock-price response from beating the forecast by a lot is not much higher than the response for beating it by a little. Moreover, if an executive is going to miss the forecast, the executive may as well miss it by a lot since the negative abnormal stock-price response for a large miss is not much higher than for a small miss.
More generally, as argued by Jensen and Murphy (2012) and Martin (2011), capital-market pressures teach executives to focus on the “expectations market” (in which investors bet on expectations of future performance) rather than the “real market” (in which goods and services are produced and sold, and value is created or destroyed). Focusing on the expectation market is problematic because executives inherently have access to information about future prospects that are not publicly known and incorporated into stock prices. Executives with such a focus will be tempted to take actions that increase short-run stock prices at the expense of long-run value.
Temptations to manipulate the expectations market will clearly be higher for executives holding large quantities of stock and options that can be sold or exercised before markets adjust to the “real” information. As discussed in Section 2.4, there is substantial evidence that executive option and equity holdings are indeed higher in companies that restate their earnings or are accused of accounting fraud.158 There is less evidence, however, that executives actually exercise and sell large fractions of their exercisable options or sell large fractions of their unrestricted stock holdings prior to restatements or indictments. The ominous hypothesis is that executives focused on the expectations market are not following a “pump and dump” strategy (which can be controlled by imposing longer holding requirements for shares), but rather that they are legitimately confused about the difference between increases in the short-run stock price and true value creation.
5.1.3 The Political, Legal, and Regulatory System
Agency costs are mitigated by laws prohibiting embezzlement, corporate theft, and fraudulent conveyance, as well as securities rules, regulations, and listing requirements designed to protect shareholders and other financial claimants. For example, the Securities Act of 1933—which regulated new securities issues—sought to protect shareholders by mandating full disclosure of all information that a “reasonable shareholder” would require in order to make up his or her mind about the potential investment. The Securities Act of 1934—which regulated secondary trading of securities—introduced in Section 16(b) the “short swing” profit rule (discussed above in Section 3.5.4) requiring executives to return any profits realized from buying and selling (or selling and buying) shares of their company’s stock within any period of less than six months. More sweeping (at least in its interpretation) was the anti-fraud provision Section 10(b) (and the corresponding SEC 10b-5 rule), which restricts insider trading, earnings manipulation, and price fixing. More recently, Regulation FD (August 2000) requires publicly traded companies to disclose material information to all investors at the same time (rather than favoring certain investors). While there are substantive arguments for allowing trading on material nonpublic information (since new information is more quickly introduced into the market), insider-trading rules are generally believed to benefit shareholders by reducing self-dealing by unscrupulous executives.
In addition to the general Securities Acts, the government has directly regulated the composition of the board of directors. Since 1994, companies have been required to have compensation committees consisting solely of independent directors in order for any pay to be exempt from the $1 million deductibility cap. In 1999, full independence of the auditing committee was required for all NYSE-listed firms; this requirement was extended to all firms in the 2002 Sarbanes-Oxley Act. In 2003, NYSE and NASDAQ listing requirements tightened the definition of independence and mandated that boards of listed firms have a majority of outside directors; the NYSE further required full independence for the compensation and nominating committees.
Critics hoping that independence requirements would reduce levels of executive pay have been disappointed. Both the level of pay and the use of equity-based compensation increase with the fraction of outsiders on the board; Fernandes et al. (2013) show that pay levels increase with board independence even after controlling for the risk associated with higher incentives. The evidence is therefore consistent with the hypothesis that directors—paying with shareholder money and not their own—prefer better-aligned incentives but are not particularly interested in restraining pay levels. The evidence is also consistent with directors not fully understanding (or believing) the opportunity cost of equity-based compensation (see Section 5.2.3 below).
Moreover, evidence that board independence “improves” pay is elusive. Bizjak and Anderson (2003) analyze the level and structure of compensation for CEOs who sit on their companies’ compensation committees (a relatively common occurrence before the early 1990s). Most critics of CEO pay (including Bebchuk–Fried and many shareholder activists) are horrified by the idea that the CEO could be a member of his own compensation committee, and would predict that such CEOs would inflate their own pay with few constraints.159 And yet, Bizjak and Anderson (2003) find that the CEOs sitting on their own compensation committees earn substantially less (and not more) than other CEOs, have significant shareholdings and are typically company founders or their family members. These CEOs sit on their compensation committees not to inflate their own salaries, but rather to influence the level and structure of pay for their subordinates. Prohibiting such CEOs from sitting on (or chairing) their compensation committees harms shareholders, and illustrates a cost of the “one-size-fits-all” nature of corporate governance regulation.
In addition to general securities laws and independence requirements, this study has chronicled the history of government intervention into executive compensation. Over the past 80 years, Congress has imposed tax policies, accounting rules, disclosure requirements, direct legislation, and other rules designed explicitly to address perceived abuses in executive compensation. With few exceptions, the regulations have been either ineffective or counterproductive, typically increasing (rather than reducing) agency problems and pay levels, and leading to a host of unintended consequences. For example, the 1984 laws introduced to reduce golden parachute payments led to a proliferation of change-in-control arrangements, employment contracts, and tax gross-ups. Similarly, a variety of rules implemented in the early 1990s are largely responsible for fueling the subsequent option explosion, and the enhanced disclosure of perquisites in the 1970s is generally credited with fueling an escalation in the breadth of benefits offered to executives.
The emerging conclusion is that the myriad attempts to regulate CEO pay have been mostly unblemished by success. Part of the problem is that regulation—even when well intended—inherently focuses on relatively narrow aspects of compensation allowing plenty of scope for costly circumvention. An apt analogy is the Dutch boy using his fingers to plug holes in a dike, only to see new leaks emerge. The only certainty with pay regulation is that new leaks will emerge in unsuspected places, and that the consequences will be both unintended and costly.
Another part of the problem—as suggested above in the context of CEOs sitting on their firm’s compensation committees—is that government regulation inevitably imposes a “one-size-fits-all” solution to a perceived problem. For example, as I emphasize in Murphy (2012), claims (unfounded or not) that the banking bonus culture created incentives to take excessive risks were relevant at most for a relatively small number of large publicly traded Wall Street security brokers and dealers (along with some large commercial banks with significant investment banking operations). And yet, the Dodd–Frank provisions designed to reduce such incentives in the future were imposed on all public and private financial institutions, including broker-dealers, commercial banks, investment banks, credit unions, savings associations, domestic branches of foreign banks, and investment advisors.
A larger part of the problem is that the regulation is often mis-intended. The regulations are inherently political and driven by political agendas, and politicians seldom embrace “creating shareholder value” as their governing objective. While the pay controversies fueling calls for regulation have touched on legitimate issues concerning executive compensation, the most vocal critics of CEO pay (such as members of labor unions, disgruntled workers and politicians) have been uninvited guests to the table who have had no real stake in the companies being managed and no real interest in creating wealth for company shareholders. Indeed, a substantial force motivating such uninvited critics is one of the least attractive aspects of human beings: jealousy and envy. Although these aspects are seldom part of the explicit discussion and debate surrounding pay, they are important and impact how and why governments intervene into pay decisions.
5.1.4 Product Markets
While competition in the product market can theoretically either reduce or increase agency problems (see Hart, 1983; Scharfstein, 1988 respectively), companies that cannot compete in the product market cannot survive. The product market, therefore, provides inevitable discipline for value-destroying managers, but only after most of the value has been destroyed. Moreover, relying on product markets to discipline managers encourages managers to view “survival” rather than value-creation as their governing objective.
5.2 “Competing” Hypotheses to Explain the Increase in CEO Pay
The unparalleled rise in CEO pay from the mid-1980s through 2001—propelled primarily by increases in the grant-date value of option awards—generated a great deal of academic, popular, and political attention. As noted, most papers in the literature have offered either the “managerial power” or “efficient contracting” explanations for the increase; see Frydman and Jenter (2010) for a useful and thoughtful review. A third set of explanations—most closely associated with Murphy (2002)—maintains that options exploded in the 1990s because decisions over options were made based on the “perceived cost” of options rather than on their economic cost. This section summarizes and critiques all three approaches, focusing on salient features of CEO pay that can, and cannot be explained under the approach. In addition, I explore the government’s role in pursuing social policy that favored stock options for both top-level executives and lower-level employees.
Before assessing how well the various theories explain the recent trends in CEO pay, it is useful to summarize what those trends are (that is, what the theories need to explain):
• Median expected pay for CEOs in the S&P 500 increased an average of 4.3% annually (after inflation) from 1983-1991, and by an average of 15.7% annually between 1991 and 2001.
• Most of the increase in pay between 1991 and 2001 reflects increases in the value of stock options granted.
• The “stock option explosion” was not limited to CEOs: 95% of the option grants went to lower-level executives and employees, and the trends in CEO options mirrored trends for options to lower levels.
• Median CEO pay has largely leveled-off since 2001. Over the same time period, firms have reduced their reliance on stock options and greatly increased their use of restricted stock and performance shares.
Therefore, any compelling theory of trends in CEO compensation must not only explain the increase in pay levels but must also address explicitly its most prominent feature: the escalation in stock options from the mid-1980s through 2001. Better still, the theory should be consistent with the explosion in broad-based option programs, the leveling of pay after 2001 and the emerging dominance of restricted stock.
5.2.1 Managerial Power
The “managerial power” approach begins with the self-interested executives envisioned by Berle and Means (1932) and Jensen and Meckling (1976) and adds a new element: the ability of these executives to influence both the level and composition of their own compensation packages, often (if not invariably) at the expense of shareholders. One of the early contributors to this view is David Yermack, who has argued that CEOs extract rents from shareholders by timing their option grants to occur just before the release of good news (Yermack, 1997), by insider trading through their family charitable foundations (Yermack, 2009), through lucrative severance and change in control provisions (Hartzell, Ofek, and Yermack, 2004; Yermack, 2006b; Dahiya and Yermack, 2008), and by consuming excessive perquisites (Yermack, 2006a).
The researchers most closely associated with the managerial power approach are Lucian Bebchuk and Jesse Fried, who have argued in a series of papers that both the level and composition of pay are determined not by competitive market forces but rather by captive board members catering to rent-seeking entrenched CEOs.160 In addition, the authors argue that the CEO’s ability to extract rent is limited by outside scrutiny and criticism (the “outrage constraint”), and CEOs respond by extracting rents through difficult-to-observe or assess forms of compensation rather than through increased base salaries. They use their model to explain several common features of executive compensation plans, including the use (and misuse) of compensation consultants, the prevalence of stealth compensation (pensions, deferred pay, perquisites, and loans), gratuitous severance payments, and stock options that are uniformly granted at the money and not indexed for the market or industry.
Can managerial power explain the trends in CEO pay? There is no doubt that executives (like the rest of us) are self-interested and would prefer higher compensation to lower compensation. There is also little doubt that—while CEOs are never explicitly involved in setting their own pay (even those sitting on their own compensation committees)—CEOs have subtle ways of influencing the compensation committee and the pay-setting process.161 However, as emphasized by Holmstrom and Kaplan (2003) and Frydman and Jenter (2010), there is no evidence that boards have become weaker or more captive over time. Indeed, every measure of board independence has improved since the mid-1980s. As discussed in Sections 5.1.1, the fraction of outside directors serving on the average board had increased to 80% by the end of the 1990s, and the CEO was the sole insider in nearly half of all firms. Since IRS Section 162(m) in 1993 (which required independence as a prerequisite for deductibility), most compensation committees have been fully independent. The 2003 NYSE listing requirements and 2010 Dodd–Frank Section 952 are appropriately characterized as tightening the definition from “independent” to “really independent” to “really, really independent”, reflecting a mistaken belief that true independence can be measured by an objective standard applicable across all publicly traded companies without regard to the individual director. The increase in board independence during the 1990s should reduce managerial influence over pay, suggesting that the trends in CEO pay over the period were not driven by managerial power. In addition, the secular increase in disciplinarily firings of poorly performing CEOs (Kaplan and Minton, 2011; Huson, Parrino, and Starks, 2001) offers no evidence that boards are becoming systematically more passive over time.
Moreover, it is worth noting that many of the most generous and widely criticized option and severance payouts over the past two decades have been the direct result of formal employment agreements negotiated with external candidates, and not deals reached with powerful incumbents. Indeed, Murphy and Zábojník (2008) attribute the increase in executive pay to the increased prevalence of hiring CEOs from outside the firm. During the 1970s, under 15% of newly appointed CEOs were hired externally. By, the late 1990s, nearly a third of all CEO appointments came from outside of the firm, suggesting increasing competition in the managerial labor market. While the Murphy–Zábojník results (discussed in the next section) are often cited as evidence for the “efficient-contracting” approach, they are also consistent with directors systematically overpaying (and over-protecting) CEOs brought in from outside the firm.
In fact, compensation committees almost invariably pay “too much” for newly appointed CEOs, especially for those hired from outside the firm. Corporate directors seeking new CEOs from outside typically hire a professional search firm to identify qualified candidates for the position (Khurana, 2002a, 2002b). The pool of qualified candidates is narrowed through extensive research, background and reference checks, and interviews until a single individual is selected for the position. Negotiations over pay typically begin only after the favored candidate is identified and told that he or she is to be the new CEO. Indeed, many times negotiations are still on-going when the appointment is announced publicly. At this point the board is effectively locked in to the particular candidate CEO, which dramatically shifts the bargaining power to the seller (the candidate) rather than the buyer (the firm). This procedure is a reasonable way to identify top candidates when “price” is not an issue, but is clearly a recipe for systematically paying too much for managerial talent.
The tendency to pay too much and to pay it in the wrong way is exacerbated by potential CEOs who hire skilled contracting agents to negotiate on their behalf. In contrast, compensation committees rarely retain their own expert negotiators. The outcome is what one would expect in a game where there is such a clear mismatch: no matter how well intentioned, the typical compensation committee is no match against a professional negotiator, and overly generous pay packages become ubiquitous. But often the problem is worse: the incoming CEO (and his professional agent) negotiate not with the compensation committee but rather with the company’s general counsel or head of human resources, knowing they will report to the CEO when the contracting is complete.
Overpaying newly hired CEOs is an agency problem caused by directors paying the new hires with shareholder money rather than their own. It is not, however, a “managerial power” problem, since the board is not captive and these are arms’ length negotiations with a non-incumbent CEO candidate. The distinction is important because the policy prescriptions are different: the solution to overpaying new hires is to strengthen the negotiation process, while the solution to managerial power is to weaken the incumbent CEO’s influence. More importantly, the “problem” of overpaying (and over-protecting) new hires may be small compared to the costs of selecting the wrong CEO.
In any case, hiring managerial talent from either inside or outside the firm is expensive, and the price of talent increased significantly during the 1990s and early 2000s. Kaplan and Rauh (2010) and Kaplan (2008), for example, present evidence that the increased pay for top executives is comparable to pay trends for top lawyers, investment bankers, hedge-fund managers, venture capitalists, private-equity managers, and athletes. The rise in incomes for top talent in these disparate sectors—most with active and mobile labor markets—cannot plausibly be explained by managerial power. It seems unproductive to attribute gains in these other sectors to competitive market forces while inventing a different explanation for the rise in CEO pay. Indeed, the secular increase in external CEO appointments documented by Murphy and Zábojník (2008) suggests that the managerial labor market is becoming more rather than less competitive.
Can managerial power explain the growth in the use of stock options?Bebchuk, Fried, and Walker (2002) suggest that firms can “camouflage” excessive pay by substituting stock options for cash compensation, under the theory that such grants are difficult to value and are easy to hide in annual disclosures. Under disclosure rules effective before 1992, information on option grants was indeed difficult to obtain.162 However, the centerpiece of the sweeping new disclosure rules introduced in October 1992 focused on option grants, and two new tables were added to the proxy statements to describe the details of both the grant and the number and value of options held at the end of the year. Bebchuk, Fried, and Walker (2002) would predict that options grants would fall as the amount of information increased. However, option grants escalated (rather than fell) following the new rules.
Bebchuk and Grinstein (2005) attempt to provide a managerial power explanation for the 1990s increase in stock options as follows. First, they argue that the stock market boom weakened the outrage constraint, giving executives more latitude to increase their own pay. Second, they argue that increasing compensation in the form of options caused less outrage than increasing base salaries, not because of “camouflage” but because options offered the possibility of improved incentives. When the market declined in 2000–2002, the outrage constraint strengthened as investors became less forgiving of perceived managerial over-reaching, stemming the escalation in both pay and the use of stock options. Bebchuk and Grinstein (2005) use this framework to explain the correlation between CEO pay and general stock-price movements, as illustrated in Figure 18 in Section 3.7.5. Their framework would therefore also predict an increase in pay and options during the 2003–2007 bull market, and yet pay increases were modest and options were declining over this period. They could, of course, provide arguments for the existence of an “outrage constraint” for this period that would explain why pay levels moderated and options were replaced by restricted stock. This points to a basic problem with the Bebchuk and Grinstein (2005) explanation (and the managerial-power hypothesis more generally): there is no principled way to refute any trend in pay given the authors’ flexible (and unmeasurable) definition of both the “outrage constraint” and its importance.
5.2.2 Efficient Contracting
The “efficient contracting” camp maintains that the observed level and composition of compensation reflects a competitive equilibrium in the market for managerial talent, and that incentives are structured to optimize firm value. The survey article by Edmans and Gabaix (2009) considers optimal-contracting explanations for the pay practices criticized under the managerial power camp, and the survey article by Frydman and Jenter (2010) discuss how these theories can predict increases in CEO pay over time.
Unlike the “managerial power” camp, the “efficient contracting” camp is not neatly characterized by a well-defined set of authors or articles. The modern executive compensation literature paralleled the emerging agency theory literature, and the majority of CEO pay papers written since the 1980s have been explicitly or implicitly based on agency or optimal-contracting theories. Indeed, the managerial power approach largely evolved as researchers—perhaps beginning with Jensen and Murphy (1990b) and Yermack (1995)—uncovered anomalies seemingly inconsistent with optimal contracts.
Can efficient contracting explain the trends in CEO pay? Beyond optimal incentive contracts, the efficient contracting approach includes market equilibrium models of managerial productivity, matching, and sorting that predict secular increases in CEO pay. For example, Murphy and Zábojník (2008) and Frydman (2007) offer general equilibrium models attributing the increase in executive pay to the increased prevalence of hiring CEOs from outside the firm. In particular, both papers attribute the trend toward outside hiring as reflecting gradual changes in the nature of the CEO job, modeled as a shift in the relative importance of general “managerial capital” (human capital specific to CEO positions) over firm-specific capital (reflecting skills, knowledge, contacts, and experience valuable only within the organization). The shift in the relative importance of general vs. firm-specific managerial capital leads to fewer promotions, more external hires, and an increase in equilibrium average wages for CEOs relative to the wages of lower-level workers. Ultimately, while it is plausible that the increased prevalence of outside hiring will increase average wages (if nothing else, employers must always pay a premium when hiring from outside compared to promoting from within), it is less plausible that the doubling of outside hiring from the 1970s to the 2000s could lead to such a huge increase in real CEO pay over this time period.
Alternatively, Gabaix and Landier (2008) build an equilibrium model in which the marginal product of managerial ability increases with firm size (so that it is optimal to assign the most talented managers to the largest firms). As shown by Rosen (1981) and Rosen (1982), such assortative matching produces equilibrium wages that are convex in ability, such that small increases in ability can lead to large increases in wages (since the CEO is assigned to a larger firm). Gabaix and Landier (2008)’s key insight is that the wage of a CEO will depend not only on firm size, but also on the size distribution of all firms in the relevant market: as the average firm becomes larger, managerial marginal products increase and competition for scarce managerial talent will bid up compensation. In particular, they show that a shift in the size distribution of firms will lead to a proportional shift in compensation, and conclude that “the six-fold increase in CEO pay between 1980 and 2003 can be fully attributed to the six-fold increase in market capitalization of large US companies”.
Gabaix and Landier (2008)’s results are consistent with the near-perfect correlation between CEO pay and general stock-price movements observed from 1980 to 2002 (see Figure 18 in Section 3.7.5). However (and similar to the critique of Bebchuk and Grinstein (2005) above), their results are not consistent with time trends in CEO pay and the stock market since 2002. In addition, while their insights on the size distribution are potentially important, their focus on market capitalization as the size measure is problematic since it conflates size, stock-price performance, and the vagaries of the market. Few would argue, for example, that Apple was really the largest firm in the world economy in 2012 (and yet their market value in early 2012 eclipsed that of Exxon-Mobil, PetroChina, and Royal Dutch Shell). Similarly, Volkswagen was not the second-largest firm on the planet for a couple of days in late October 2008 after its stock price increased by 350% over a two-day period (before tumbling by 60% over the following week).163 While average CEO pay may have moved roughly proportionately with average market capitalization between 1980 to 2003, it far outpaced the growth in more traditional measures of size. For example, average revenues for the 500 largest US firms ranked by revenue grew only by 50% after inflation from 1980 to 2003, while average employment for the 500 largest US employers grew only by 19%.164
Can efficient contracting explain the growth in the use of stock options? The CEOs in most market-equilibrium models (including Murphy and Zábojník (2008), Frydman (2007), Gabaix and Landier (2008), and the informal model in Kaplan and Rauh (2010)) contribute only ability and not effort. Therefore, there is no role for incentives and thus no obvious reason why the increase in pay would come in the form of increased equity-based compensation (or, in particular, in stock options and why the preferred form of equity incentives would shift to restricted stock after 2002). To “explain” trends in CEO pay, it is not enough to predict increases in the level of pay, independent of dramatic changes in its composition. Indeed, as discussed above in Section 2.1.2, CEOs naturally demand a “risk premium” for accepting stock options in lieu of safer forms of compensation, and this risk premium will increase when the CEO is less diversified (i.e. when holding more shares of stock, or when the value of option portfolios increase relative to other wealth). Therefore, any increase in stock options will naturally be associated with an increase in total compensation, especially in a rising market. As shown in Figure 7 in Section 2.1.2, median risk-adjusted CEO pay actually fell from 1998 to 2001 (at least given the assumptions in the figure), even as the median unadjusted pay was exploding. In fact, the puzzle to be solved in Figure 7 is not why pay levels increased in the late 1990s (because they actually declined after adjusting for risk), but rather why risk-adjusted pay levels increased dramatically from 2002–2007, as companies replaced risky stock options with less risky restricted stock, without substantial declines in the grant-date fair-market value of pay.
Optimal-contracting theory (i.e. the subset of efficient contracting predicting that incentives are structured to optimize firm value) offers few explanations for the increase in option-based pay (i.e. increases in pay-performance sensitivities) in the 1990s. Consider, for example, the benchmark model where firm value is given by y = a + ɛ, where a is executive effort, and ɛ is (normally distributed) uncontrollable noise, ɛ≈N(0,σ2). Moreover, suppose that managerial contracts take the simple linear form w(x) = s + by, where s is a fixed salary and b is the sharing rate (or “pay-performance sensitivity”). Assuming that the executive has exponential utility, U(x) = −er(w-c(a)), where r is the executive’s absolute risk aversion and c(a) is the convex disutility of effort, the optimal sharing rate is given by:165
![]()
Traditional contracting theory therefore suggests a finite number of factors that might explain higher incentives among CEOs in the 1990s. First, perhaps CEOs became less risk or effort averse in the 1990s, but to my knowledge there is no theory or empirical work suggesting such declines in risk- or effort-aversion parameters. Second, perhaps CEO performance became estimated with less noise in the 1990s. While potentially consistent with the increase in director independence (if taken as a proxy for board monitoring), most measures of cash-flow or shareholder-return volatility increased rather than decreased over this time period.
Alternatively, suppose that firm value is given by y = θa + ɛ, where the primary source of uncertainty is variations in θ (i.e. managerial productivity assumed to be observed by the CEO but not by directors or shareholders). Zábojník (1996) and Prendergast (2002) show that optimal pay-performance sensitivites increase with the volatility of θ (incentives are more important when the CEO has private information about his or her marginal productivity). Again, to my knowledge there is no theory or empirical work suggesting that CEO marginal productivity became more volatile during the early 1990s.
Moreover, optimal-contract theories must explain not only the increase in equity-based compensation, but why that increase came almost entirely in the form of stock options as opposed to restricted shares or other equity-based instruments. Several papers have attempted, with only limited success, to provide theoretical justification for stock options. For example, traditional principle-agent models based on constant relative risk aversion and lognormally distributed stock prices (e.g., Hall and Murphy, 2002; Dittmann and Maug, 2007), suggest that—when salaries can be adjusted—contracts with restricted shares or options granted in-the-money are generally are superior to contracts with at-the-money options.166
Ultimately, the most compelling optimal-contracting explanation for the increase in equity-based compensation in the 1990s is that contracts were suboptimal before the 1990s, and got better. As explored above in Sections 3.5.6 and 3.6, year-to-year changes in executive pay in the 1970s largely reflected changes in company revenues (rather than performance), contributing to unproductive diversification, expansion and investment programs. The takeover and LBO market of the 1980s demonstrated vast potential for value creation in previously inefficient firms, leading academics, institutions, and shareholder advocates to demand that pay be more closely tied to shareholder performance. As emphasized by Holmstrom and Kaplan (2001), stock options allowed executives to share in the value created by internal restructurings that reduced excess capacity or reversed ill-advised diversification programs. The growing importance of shareholder activists and large institutional investors (Gompers and Metrick, 2001) increasingly pressured firms to tie pay more closely to stock-price performance. Stock options also became the currency of choice for high-tech start-ups, rich with ideas but (allegedly) short of cash or sources of capital. As a result, the popularity of options soared with the stock market during the 1990s, to the benefit of shareholders and executives alike. In fact, part of the increase in options during the 1990s plausibly reflects the fact that they seemed to be working: corporate boards and top managers began to associate option grants with successful company performance, especially during the high-tech and Internet boom of the late 1990s. Indeed, the increase in options coupled with the renewed focus on shareholder value creation may help explain the overall growth in stock market during this period.
This optimal-contracting explanation for stock options cannot, however, explain the magnitude of the explosion, and why it came in the form of options rather than stock. Consider, for example:
• The increase in stock options for top-level executives was associated with no discernable decrease in other forms of compensation (such as base salaries, bonuses, or benefits). To my knowledge, there is not an efficient contracting theory that predicts stock options to be added “for free” on top of what were presumably competitive compensation packages.
• Most contracting models would predict that the number of options granted would decline as stock prices increase, since the Black–Scholes cost of granting at-the-money options increases proportionately with the stock price. However, the number of options (as a fraction of outstanding common stock) increased rather than decreased during the 1990s, leading to a near-perfect correlation between average option grant-date values and stock-market indices between 1980 and 2002 (see Figure 18).
• Beginning in 2002, and especially since 2006, restricted stock has replaced stock options as the dominant form of equity-based compensation (and, indeed, is now the largest single component of compensation for the typical CEO in S&P 500 firms). To my knowledge, there is not an efficient-contracting theory that predicts this switch.
Even more difficult for the optimal-contracting camp is explaining why so many options were granted to so many employees well below the executive suite (see Figures 19 and 20). Since non-tradable stock options are an unusually inefficient method of conveying compensation (see Section 2.1.2), the incentive benefit from stock options must exceed the substantial difference between the company’s opportunity cost of granting options and the “value” of those options from the perspective of risk-averse undiversified employees. While there may be efficient contracting justifications for granting options to top-level executives and other critical employees who can directly impact company stock prices (such as R&D scientists), there is (to my knowledge) no compelling incentive theory explaining option grants for rank-and-file employees.
Existing theories of broad-based option plans focus not on incentives but on other aspects of the employment relation. Oyer (2004), for example, argues that broad-based options may help satisfy participation constraints when reservation wages are correlated with the “market” and when it is costly to adjust other terms of employee compensation. Oyer and Schaefer (2005) and Bergman and Jenter (2007) argue that it might be optimal to grant options rather than cash when employees are irrationally optimistic about company prospects. Core and Guay (2001) argue that firms grant options to lower-level employees as a substitute for cash compensation, and document a greater use of options for firms facing financing constraints.167 Babenko, Lemmon, and Tserlukevich (2011) argue that financially constrained firms rely on cash inflows from employee option exercises to finance investments.
The common failing in the aforementioned theories of broad-based stock option plans is neither recognizing nor incorporating the substantial difference between the company’s cost and the employee’s value of non-tradable stock options. For example, Oyer (2004) offers no compelling argument or evidence that options are an efficient substitute for flexible employment terms (indeed, he largely ignores the efficiency cost of options, and assumes that contract adjustments are prohibitively costly)168, and Core et al. (2001) and Babenko et al. (2011) implicitly hold but provide no theoretical or conceptual evidence for the implausible assumption that risk-averse undiversified employees are efficient sources of capital. Bergman and Jenter (2007) suggest that firms can reduce compensation costs by paying over-optimistic employees with (potentially overvalued) options, but provide no evidence that options are offered as a substitute for other forms of compensation. Indeed, all these models ignore the fact that most broad-based option plans were layered on top of existing compensation arrangements, and were not substitutes for cash compensation. The dominant option granters in the 1990s were not small cash-poor internet start-ups (where a compelling incentive-based rationale for broad-based options can be made), but rather large cash-rich giants such as Microsoft, Intel, Cisco, and Apple.
5.2.3 Perceived Cost
In a series of papers—admittedly garnering less traction than either the “managerial power” and “efficient contracting” approaches—I’ve suggested an alternative explanation for the growth of option-granting in the 1990s: decisions over options were made based on the “perceived cost” of options rather than on their economic (or “opportunity”) cost.169 When a company grants an option to an employee, it bears an economic cost equal to what an outside investor would pay for the option. But, it bears no outlay of cash, and (prior to the 2006 changes in accounting rules) bears no accounting charge. Moreover, when the option is exercised, the company (usually) issues a new share to the executive, and receives both the exercise price and (for non-qualified stock options) a tax deduction for the spread between the stock price and the exercise price. These factors make the “perceived cost” of an option much lower than the economic cost.
From the perspective of many boards and top executives who perceive options to be nearly costless—or indeed deny that options have value when granted—the only way they can quantify the options they award is by the number of options granted. During the 1990s, the focus on the quantity rather than the cost of options was further solidified by the institutions that monitor option plans. For example (see Section 3.7.5), SEC disclosure rules in place between 1992 and 2006 required companies to report only the number of, rather than the value of, options granted in the “Summary Compensation Table”, the primary or most visible compensation table in the company’s annual proxy statement. Similarly (see Section 3.7.6), under the pre-2003 NYSE listing requirement companies must obtain shareholder approval for the total number of options available to be granted, but not for the cost of options to be granted.170 In addition, advisory firms (such as Institutional Shareholder Services) often base their shareholder voting recommendations primarily on the option “overhang” (that is, the number of options granted plus options remaining to be granted as a percent of total shares outstanding), and not on the opportunity cost of the proposed plan. Therefore, boards and top executives often implicitly admitted that the number of options granted imposes a cost on the company, while at the same time denying that these options have any real dollar cost to the company.
In addition, boards and top executives understand that options, when exercised, dilute the shareholdings of current equity holders. The number of options granted is included in fully diluted shares outstanding and therefore increased grants will decrease fully diluted earnings per share. Thus the negative consequences associated with these reductions in earnings per share also vary with the number of options granted, and not with the dollar-cost of the grants, and are consistent with the observed excessive focus on the number of options awarded and outstanding and not their dollar cost to the firm.
The perceived-cost view of stock options explains why options were granted in such large quantities to large numbers of executives and employees and also explains why the grant-date opportunity cost of options rose dramatically and subsequently declined with the stock market from 1980 to 2003 as shown in Figure 18 in Section 3.7.5. If boards focused only on the number of options granted, and the number of options granted stayed constant or varied positively with stock market performance, then the cost of the annual option grants would rise and fall in proportion to the changes in stock prices.
The perceived-cost view also explains why the relation between executive pay and the S&P 500 Index shown in Figure 18 weakened beginning in 2003. As discussed in Section 3.8.4, while FAS 123R required firms to expense their options beginning in 2006, many firms began voluntarily expensing in early 2003. Expensing options brings the perceived cost of options more in line with their opportunity cost, and companies responded to the robust stock market from 2003 to 2007 by decreasing the number of options granted as stock prices increased (rather than increasing the quantity of options as happened from 1993 to 2001). Moreover, expensing brings the accounting treatment of options in line with the accounting treatment of restricted stock, explaining the shift from options towards restricted stock.
Finally, the perceived-cost view explains many prevalent features of stock options offered by the managerial-power camp as evidence for their position. For example, Bebchuk, Fried, and Walker (2002) cite the scarcity of “indexed options” (i.e., options where the exercise price adjusts over time to market- or industry-wide price indices) as evidence for the managerial power hypothesis. However, prior to the 2006 imposition of FAS 123R, indexed options were subject to an accounting charge while traditional options were not, increasing the relative perceived cost of indexed options. Similarly, Bebchuk, Fried, and Walker (2002) suggest that firms use uniform option terms (e.g., granting options “at the money”) because diverging from normal practice by granting in-the-money options would spark outrage. Under the perceived-cost view, companies grant at-the-money options to avoid the accounting expense associated with in-the-money options. Indeed, the unsavory practice of “backdating” (in which firms granted in-the-money options but retroactively set the exercise date so the options appeared to be granted at the money; see Section 3.8.2) allowed firms to convey a given level of compensation without an accounting charge using fewer options than would be required without backdating. While the apparently common practice subsequently became “criminalized”, many of the participants at the time viewed the practice as a minor accounting transgression that saved the shareholders a little dilution.
The perceived-cost view is readily acknowledged by practitioners and compensation consultants, but is usually denied or dismissed by financial economists because it implies systematic suboptimal decision-making by managers and a fixation on accounting numbers that defies economic logic. But executives often respond to accounting concerns in ways that seem irrational to economists. For example (as discussed in Section 3.7.4), the practice of repricing options following stock downturns virtually disappeared in December 1998 after an accounting expense was imposed on repriced options, illustrating how companies respond to accounting rules that have no affect on company cash flows. Similarly (as discussed in Section 3.8.4), firms accelerated the exercisability of existing options in advance of the implementation of FAS 123R in order to avoid an accounting charge for previously granted but unexercisable options; such acceleration hurts shareholders by reducing retention incentives and allowing executives to unwind their equity positions. As another example (only slightly beyond the executive compensation arena), companies systematically scaled back retiree healthcare benefits after FASB required companies to record a current accounting charge for anticipated future medical costs.171 The new accounting rule apparently increased the perceived cost of these benefits, putting them more in line with their actual economic cost, and as a result companies reduced benefit levels.
While the perceived-cost approach can explain why so many options were granted to so many people (because options were free, or at least cheap), it cannot explain why the explosion in grants started in earnest in the early 1990s: after all, the accounting and tax rules governing non-qualified stock options had been in place since 1972. In addition, before the May 1991 ruling that allowed stock acquired by exercising options to be immediately sold (see Sections 3.5.4 and 3.7.2), companies routinely granted Stock Appreciation Rights (typically subject to an accounting charge) rather than stock options (typically subject to no accounting charge), suggesting that the choice of equity-based incentives were not solely driven by accounting considerations.172
More fundamentally, the problem with the perceived-cost approach is that stock options are, of course, neither free nor even cheap to grant. Indeed, non-tradable options are an unusually expensive way to convey compensation to risk-averse and undiversified employees (Hall and Murphy, 2002; Section 2.1.2 above). A tempting theory—consistent with the managerial power approach—is that executives fully understood the opportunity cost of options but duped gullible directors into believing they were free. However, this explanation is inconsistent with the fact that 95% of options were granted below the CEO level: it seems implausible that the CEO would support such as huge transfer of wealth from shareholders to employees for a modest increase in his or her own compensation.
More plausible is the idea that executives and directors simply misunderstood the nature of opportunity costs. There is ample evidence that executives routinely ignore the opportunity cost of equity capital, leading firms to excess capacity and inefficient levels of inventories, cash and working capital. Indeed, the “Economic Value Added” programs that became popular in the 1990s were explicitly designed to teach managers about the opportunity cost of capital. If executives have a hard time grasping the opportunity cost of equity, they will have an even harder time grasping the opportunity cost of a derivative on that equity, especially when told that the “cost” is not the accounting cost but rather is estimated using a seemingly arcane theoretical formula. It is worth recalling that—while the Black–Scholes methodology was twenty years old by the early 1990s and was increasingly being used in academic research on executive compensation—it had only recently gained limited traction among compensation consultants, and was not considered a useful tool in most corporate human resources departments.
5.2.4 Politics of Pay
A central theme in this study has been the futility of “explaining” CEO pay without explicit consideration of the causes and consequences of government intervention into executive compensation over the past century. The option explosion in the 1990s, which in turn caused the escalation in pay levels that spawned both the efficient contracting and managerial-power literatures, is a prime example of this futility. In Section 3.7 I discuss six factors that I believe contributed to the 1990s explosion in stock options (and hence the escalation in pay):
• Shareholder pressure for equity-based pay. The takeover and LBO market of the 1980s demonstrated vast potential for value creation in previously inefficient firms, leading academics, institutions, and shareholder advocates to demand that pay be more closely tied to shareholder performance.
• SEC holding-period rules. In 1991, the SEC determined that shares acquired by exercising options could be sold immediately upon exercise (effectively eliminating the six-month holding requirement).
• SEC option disclosure rules. In 1992, the SEC required disclosure of only the number of options granted, and not the value of options granted. The new rules pre-empted a popular Senate bill demanding a single dollar value for total compensation (which, in turn, required a dollar-valuation for options).
• Clinton’s $1 million deductibility cap. In 1993, Section 162(m) (which ironically was imposed to reduce levels of executive pay) provided a safe harbor for stock options, by exempting options from the $ 1 million deductibility limit.
• Accounting rules for options. In 1995, after pushing for expensing the “fair-market value” of stock options, FASB backed down and allowed options to be granted without an accounting expense to the company (thus preserving the illusion that options were nearly costless to grant).
• NYSE listing requirements. Under listing rules in place during the 1990s, companies needed shareholder approval for equity plans covering top-level executives, but did not need approval as long as a sufficient percentage of eligible employees were non-executives. Therefore, companies could bypass shareholder votes by granting options to lower-level employees as well as executives.
The first of these factors (“shareholder pressure for equity-based pay”) is consistent with the efficient contracting explanation (at least the version of the theory that contracts were suboptimal before the 1990s, and got better). However, the remaining factors reflect government intervention into the pay process, often as unintended consequences of attempts to curb perceived excesses in executive pay (and executive stock options in particular).
For example, the May 1991 SEC rules that allowed executives to sell shares immediately after exercising options was an unintended consequence of an attempt to curb excessive grants. As discussed in Section 3.7.2, corporate insiders are required to report stock purchases on SEC Form 4, but were not (before May 1991) required to report option grants. To provide more transparency for option grants, the SEC redefined the “stock purchase” as the date the option was granted rather than when it was exercised (thus triggering Form 4 disclosure of grants within 10 days of the end of the month when options were granted). As a result of this new definition, the six-month holding period required by the Securities Act started when the option was granted and not when it was exercised, allowing immediate sales upon exercise and greatly enhancing the appeal of options.
Similarly, Bill Clinton’s campaign promise to limit deductibility of executive pay covered all forms of pay, and was only later modified to exempt deductibility limitations for pay tied to productivity. After substantial debate, stock options with an exercise price at or exceeding the grant-date market price were defined as related to productivity, while options with a lower exercise price were (arbitrarily) defined as non-performance related. But, as discussed in Section 3.7.3, the intent of the Congressional sponsors of the ultimate legislation was to reduce “excessive compensation”, and not to promote the use of stock options.
However, the government faced an interesting political quandary: while it sought to curb perceived excesses in executive pay and options, it simultaneously sought to encourage firms to issue options to lower-level employees. For example, in its 1992 disclosure rules, the SEC required firms to report not only the number of options granted to each proxy-named executive, but also report that number as a percentage of options granted to all employees. The sole purpose of this requirement—similar to the Dodd–Frank requirement to report the ratio of CEO pay to the pay of the median employee—was to encourage (or “shame”) companies into spreading awards more equally across the organization.
The NYSE listing requirements—which required shareholder approval for executive option plans but not broad-based option plans—were also designed to encourage option grants to lower-level employees. As discussed in Section 3.7.6, until January 1998 it had generally assumed that “broad-based plans” excluded substantial grants to top executives, which limited their use. The “clarifications” in 1998 (revised in 1999) defined how companies could grant top-executive options without approval, so long as a sufficient percentage of either the eligible employees or options granted were below the top-executive level. As a consequence, grants to both executives and lower-level employees escalated.
Similarly, FASB’s 1995 compromise (which allowed companies to continue to grant options without an accounting expense, while recommending expensing fair market values) was driven primarily by concerns about expensing’s implications for lower-level grants (and not concerns with top executives). Countering Carl Levin’s (D-MI) Corporate Pay Responsibility Act requiring option expensing (Section 3.7.4), bilis were introduced in both the House and Senate against expensing. In May 1994, the US Senate passed (by a 88-9 vote) a non-binding “sense of Congress” resolution demanding FASB to drop its expensing proposal, claiming that expensing would affect the ability of companies to raise capital, create jobs, and attract the best employees.173 The Senate was joined by the Clinton administration—in no means an advocate of high CEO pay—concerned that FASB’s proposal would hurt the competitiveness high-tech companies.174
The political obsession for broad-based option programs continued into the early 2000s, even as the popularity of options waned due to stock-market declines and pressures towards voluntary expensing (Section 3.8.4). Advocates of broad-based plans in Congress, fearing that fair-market-value accounting for options would end of option grants to low-level employees, introduced several (ultimately shelved) bills to protect such programs, including:
• The Workplace Employee Stock Option Act of 2002 (H.R. 5242), which provided incentives for broad-based option programs by allowing employees to purchase options and stock through pre-tax payroll deductions, and providing accelerated tax deductions for employers.
• The Rank-and-File Stock Option Act of 2002 (S. 2877), which limited the tax deduction companies could take if a stock-option program was not broad based.
These bilis, and several others, were shelved in committee and the factors that had encouraged broad-based options were reversed:
• NYSE and NASDAQ listing rules revised in 2003 required shareholder approval for all option plans (including broad-based plans);
• The SEC’s 2006 disclosure rules required disclosure of grant-date values (and dropped the disclosure of the option grants to top executives as a percentage of all option grants);
• FASB revised its accounting rules effective for most companies in fiscal 2006, mandating the expensing of options at their grant-date fair market value.
Ultimately and predictably, these changes curtailed the practice of broad-based option plans: firms that already had such plans granted fewer options, and virtually no firms without plans introduced one. Indeed, as evident from Figure 19 in Section 3.7.6 the average number of options granted by firms to all employees in the S&P 500 fell by half from 2001 to 2005 (from 2.6% of outstanding shares each year in 2001 to 1.3% in 2005).
5.3 Explaining Executive Compensation: lt’s Complicated
My objective in writing this study is to provide “context” for both research in executive compensation and the ongoing debate over pay. Executive compensation has evolved over time in response to changes in both economic and political environments. Most recent analyses of executive compensation have focused on efficient contracting or managerial-power rationales for pay, while ignoring or downplaying the causes and consequences of disclosure requirements, tax policies, accounting rules, legislation, and the general political climate. A central theme of this study is that government intervention has been both a response to and a major driver of time trends in executive compensation over the past century, and that any explanation for pay that ignores political factors is critically incomplete.
As an important example, the growth in stock options in the 1990s spawned a major literature focused on explaining both cross-sectional and time-series trends in equity-based compensation for US CEOs. This literature has largely ignored the importance of political factors. However, the initial popularity of stock options was a direct result of government policies in the 1950s (Section 3.4), as was the explosion (and subsequent implosion) of options in the 1990s and 2000s, respectively (Sections 3.7 and 3.8.4). Similarly, the contrasting evolution of stock options for US CEOs and their foreign counterparts is largely explained by political rather than economic factors (Section 4.3).
Indeed, what makes CEO pay both interesting and complicated is the fact that the efficient contracting, managerial power, and political paradigms co-exist and interact. In introducing plans that tie pay more strongly to performance as demanded by shareholders, directors routinely agree to pay more than necessary to compensate for the increased risk. Self-interested CEOs seek employment protection through overly generous severance provisions; directors acquiesce believing that the probability of failure is low (and because it is not their money anyway). When compensation failures occur (such as those overly generous severance payments), Congress gets outraged, triggering disproportionate reforms with little regard for shareholders or value creation. In turn, companies and their executives respond by circumventing or adapting to the reforms, usually in ways that increase pay levels and produce other unintended (and typically unproductive) consequences.
Acknowledgements
This research has been influenced significantly by my co-authors, especially Michael Jensen and also Robert Gibbons, Brian Hall, Eric Wruck, Tatiana Sandino, Jan Zabojnik, Martin Conyon, Nuno Fernandes, Miguel Ferreira, and Pedro Matos. I am also grateful for data and insights from David Huelsbeck and helpful comments on an earlier draft from Alex Edmans, Harry DeAngelo, Tomislav Ladika, Steven Kaplan, Kelsey Stallings, René Stulz, and Harwell Wells.
References
1. $1,623,753 Grace’s Bonus For 1929: Bethlehem president testifies at merger trial to receiving this amount (1930). Wall Street Journal (July 22).
2. Aboody D, Barth ME, Kasznik R. Firms’ voluntary recognition of stock-based compensation expense. Journal of Accounting Research. 2004;42:123–150.
3. Abowd J, Bognanno M. International differences in executive and managerial compensation. In: Freeman R, Katz L, eds. Differences and changes in wage structures. The University of Chicago Press 1995.
4. Abowd JM, Kaplan DS. Executive compensation: Six questions that need answering. Journal of Economic Perspectives. 1999;13:145–168.
5. Aggarwal R, Erel I, Ferreira M, Matos P. Does governance travel around the world? Evidence from institutional investors. Journal of Financial Economics. 2011;100:154–181.
6. Agrawal A, Mandelker G. Managerial incentives and corporate investment and financing decisions. Journal of Finance. 1987;42:823–837.
7. Ailing options: Stock market decline dulls allure of plans for company officials (1957). Wall Street Journal (October 21).
8. Alchian AA, Demsetz H. Production, information costs, and economic organization. American Economic Review. 1972;62:777–795.
9. Alinsky wins at the SEC (2010). Wall Street Journal (August 30).
10. Alpern, R. L., & Gail, M. (2001). Guide to change of control: Protecting companies and their executives. Executive Compensation Advisory Services.
11. Amir E. The market valuation of accounting information: The case of post-retirement benefits other than pensions. The Accounting Review. 1993;68:703–724.
12. Andrews, E. L., & Vikas, B. (2009). Amid fury, US is set to curb executives’ pay after bailouts. New York Times (February 4).
13. Armstrong CS, Ittner CD, Larcker DF. Corporate governance, compensation consultants, and CEO pay levels. Review of Accounting Studies. 2012;17:322–351.
14. Babenko I, Lemmon M, Tserlukevich Y. Employee stock options and investment. Journal of Finance. 2011;66:981–1009.
15. Baker GP, Hall B. CEO incentives and firm size. Journal of Labor Economics. 2004;22:767–798.
16. Baker GP, Jensen MC, Murphy KJ. Compensation and incentives: Practice vs theory. Journal of Finance. 1988;43:593–616 <http://papers.ssrn.com/Abstract=94029>.
17. Baker JC. Executive salaries and bonus plans. McGraw Hill 1938.
18. Barboza, D. (2002). Enron’s many strands: Executive compensation. Enron paid some, not all, deferred compensation. New York Times (February 13).
19. Bartov E, Givoly D, Hayn C. The rewards to meeting or beating earnings expectations. Journal of Accounting and Economics. 2002;33:173–204 <http://papers.ssrn.com/paper=247435>.
20. Bebchuk LA, Fried JM. Pay without performance: The unfulfilled promise of executive compensation. Cambridge, MA: Harvard University Press; 2004a.
21. Bebchuk LA, Fried JM. Stealth compensation via retirement benefits. Berkeley Business Law Journal. 2004b;1:291–326.
22. Bebchuk LA, Grinstein Y, Peyer U. Lucky CEOs and lucky directors. Journal of Finance. 2010;65:2363–2401.
23. Bebchuk LA, Fried JM, Walker DI. Managerial power and rent extraction in the design of executive compensation. University of Chicago Law Review. 2002;69:751–846 <http://papers.ssrn.com/abstract=316590>.
24. Bebchuk LA, Grinstein Y. The growth of executive pay. Oxford Review of Economic Policy. 2005;21:283–303.
25. Bebchuk LA, Fried JM. Executive compensation as an agency problem. Journal of Economic Perspectives. 2003;17:71–92.
26. Bender, M. (1975a). The executive’s tax-free perks: The IRS looks harder at the array of extras. New York Times (November 30).
27. Bender, M. (1975b). Fringe benefits at the top: Shareholder ire focuses on loan systems. New York Times (April 13).
28. Bentsen opposes FASB on reporting stock options (1993). Wall Street Journal (April 7).
29. Bergman N, Jenter D. Employee sentiment and stock option compensation. Journal of Financial Economics. 2007;84.
30. Bergstresser D, Philippon T. CEO incentives and earnings management. Journal of Financial Economics. 2006;80:511–529.
31. Berle AA, Means GC. The modern corporation and private property. New York: Macmillan Publishing Co; 1932.
32. Berman DK. The game: New frontier for the SEC: The clawback. Wall Street Journal 2010; (June 22).
33. Berton L. Business chiefs try to derail proposal on stock options. Wall Street Journal 1992; (February 5).
34. Berton L. Accounting rule-making board’s proposal draws fire. Wall Street Journal 1994; (January 5).
35. Bettner J. Incentive stock options get mixed reviews, despite the tax break they offer executives. Wall Street Journal 1981; (August 24).
36. Bhagat, S., & Bolton, B. (2011). Bank executive compensation and capital requirements reform.
37. Big earners cashing in now: Fearful of Clinton’s tax plans, they rush to exercise their options. San Francisco Chronicle (December 29, 1992).
38. Bizjak JM, Anderson RC. An empirical examination of the role of the CEO and the compensation committee in structuring executive pay. Journal of Banking and Finance 2003; <http://ssrn.com/abstract=220851>.
39. Black F, Scholes MS. The pricing of options and corporate liabilities. Journal of Political Economy. 1973;81:637–654.
40. Blumenthal, R. (1977). Misuse of corporate jets by executives is drawing more fire. New York Times (May 19).
41. Board’s text on executive compensation (1971). Wall Street Journal (December 28).
42. Bonus figures given at trial: Six vice presidents of Bethlehem received $1,432,033 in 1929, 1930. Wall Street Journal (July 23).
43. Botero J, Djankov S, La Porta R, Lopez-De-Silanes F, Shleifer A. The regulation of labor. Quarterly Journal of Economics. 2004;119:1339–1382.
44. Bowe, C., & White, B. (2007). Record payback over options, Financial Times (December 7).
45. Bray C. Former Comverse official receives prison term in options case. Wall Street Journal 2007; (May 11).
46. Bryan, S., Nash, R., & Patel, A. (2006). The structure of executive compensation: International evidence from 1996–2004.
47. Bryant, A. (1998). New rules on stock options by Big Board irk investors. New York Times (April 22).
48. Burns N, Kedia S. The impact of performance-based compensation on misreporting. Journal of Financial Economics. 2006;79:35–67.
49. Business groups oppose Nixon control plan, intensify their efforts to abolish restraints (1974). Wall Street Journal (February 25).
50. Cadman B, Carter ME, Hillegeist S. The incentives of compensation consultants and CEO pay. Journal of Accounting and Economics. 2010;49:263–280.
51. Cai J, Vijh A. Executive stock and option valuation in a two state-variable framework. Journal of Derivatives 2005;9–27.
52. Calame B. Executives’ pay faces going-over by wage board. Wall Street Journal 1972; (April 24).
53. Carter ME, Lynch LJ. The consequences of the FASB’s 1998 proposal on accounting for stock option repricing. Journal of Accounting & Economics. 2003;35:51–72.
54. Choudhary P, Rajgopal S, Venkatachalam M. Accelerated vesting of employee stock options in anticipation of FAS 123R. Journal of Accounting Research. 2009;47:105–146.
55. Chrysler chairman defends option plan, offers to discuss it with federal officials (1963). Wall Street Journal (December 23).
56. Chrysler officers got profit of $4.2 million on option stock in ‘63 (1964). Wall Street Journal (January 15).
57. Chrysler officers’ sale of option stock could stir tax bill debate (1963). Wall Street Journal (December 18).
58. Clinton enters debate over how companies reckon stock options (1993). Wall Street Journal (December 23).
59. Congress and taxes: Specialists mull ways to close loopholes in present tax laws (1959). Wall Street Journal (January 7).
60. Connor JE. There’s no accounting for realism at the FASB. Wall Street Journal 1987; (March 26).
61. Conyon MJ, Core JE, Guay WR. Are US CEOs paid more than UK CEOs? Inferences from risk-adjusted pay. Review of Financial Studies. 2011;24:402–438.
62. Conyon, M. J., Fernandes, N., Ferreira, M. A., Matos, P., & Murphy, K. J. (2013). The executive compensation controversy: A transatlantic analysis. In T. Boeri, C. Lucifora, & K. J. Murphy (Eds.), Executive remuneration and employee performance-related pay: A transatlantic analysis. Oxford University Press.
63. Conyon MJ, Murphy KJ. The prince and the pauper? CEO pay in the United States and United Kingdom. Economic Journal. 2000;110:F640–F671.
64. Conyon MJ, Schwalbach J. Executive compensation: Evidence from the UK and Germany. Long Range Planning. 2000;33:504–526.
65. Core J, Guay W. Stock option plans for non-executive employees. Journal of Financial Economics. 2001;61.
66. Core J, Guay W. Estimating the value of employee stock option portfolios and their sensitivities to price and volatility. Journal of Accounting Research. 2002;40:613–630.
67. Crystal G. In search of excess: The overcompensation of American executives. New York: W.W. Norton & Company; 1991.
68. Crystal GS. Manager’s journal: Congress thinks it knows best about executive compensation. Wall Street Journal 1984; (July 30).
69. Crystal, G. S. (1988). The Wacky, Wacky World of CEO Pay (June 6).
70. Cuomo, A. M. (2009). No rhyme or reason: The heads I win, tails you lose bank bonus culture (July 30).
71. Cut high salaries or get no loans, is RFC warning (1933). New York Times (May 29).
72. DavisPolk (2010). Summary of the Dodd–Frank Wall Street Reform and Consumer Protection Act, Enacted into Law on July 21, 2010 (July 21).
73. De Angelis, D., & Grinstein, Y. (2011). Pay for the right performance.
74. DeFusco R, Johnson R, Zorn T. The effect of executive stock option plans on stockholders and bondholders. Journal of Finance. 1990;45:617–627.
75. Dittmann I, Maug E. Lower salaries and no options? on the optimal structure of executive pay. Journal of Finance. 2007;62:303–343.
76. Dittmann, I., & Yu, K.C. (2011). How important are risk-taking incentives in executive compensation? <http://ssrn.com/abstract=1176192>.
77. Djankov S, La Porta R, Lopez-De-Silanes F, Shleifer A. The law and economics of self-dealing. Journal of Financial Economics. 2008;88:430–465.
78. Dye RA. Relative performance evaluation and project selection. Journal of Accounting Research. 1992;30:27–52.
79. Eckhouse, J. (1987). Tech firms’ study: Accounting rule attacked. San Francisco Chronicle (April 10).
80. Edelson, R., & Whisenant, S. (2009). A study of companies with abnormally favorable patterns of executive stock option grant timing.
81. Edmans A, Gabaix X. Tractability in incentive contracting. Review of Financial Studies. 2011;24:2865–2894.
82. Edmans, A. (2012). How to fix executive compensation. Wall Street Journal (February 27).
83. Edmans A, Gabaix X. Is CEO pay really inefficient? A survey of new optimal contracting theories. European Financial Management 2009;15–16.
84. Edmans A, Gabaix X. The effect of risk on the CEO market. Review of Financial Studies. 2011;24:2822–2863.
85. Edmans A, Gabaix X, Landier A. A multiplicative model of optimal CEO incentives in market equilibrium. Review of Financial Studies. 2009;22:4881–4917.
86. Edmans, A., Gabaix, X., Sadzik, T., & Sannikov, Y. (2012). Dynamic CEO compensation, Journal of Finance 67, 1593–1637. <http://ssrn.com/abstract=1361797>.
87. Edmans A, Liu Q. Inside debt. Review of Finance. 2011;15:75–102.
88. Efendi J, Srivastava A, Swanson EP. Why do corporate managers misstate financial statements? The role of option compensation and other factors. Journal of Financial Economics. 2007;85:667–708 <http://papers.ssrn.com/abstract=547922>.
89. Egelko, B. (2010). 18 months for ex-Brocade CEO. San Francisco Chronicle (June 25).
90. Elia, C. J. (1967). Opting for options: Stock plans continue in widespread favor despite tax changes. Wall Street Journal (July 15).
91. Erickson M, Hanlon M, Maydew EL. Is there a link between executive compensation and accounting fraud?. Journal of Accounting Research. 2006;44:113–143.
92. Espahbodie H, Strock E, Tehranian H. Impact on equity prices of pronouncements related to nonpension postretirement benefits. Journal of Accounting & Economics. 1991;4:323–346.
93. Excerpts from carter message to congress on proposals to change tax system (1978). New York Times (January 22).
94. Fahlenbrach R, Stulz RM. Bank CEO incentives and the credit crisis. Journal of Financial Economics. 2011;99:11–26.
95. Federal bureau asks salaries of big companies’ executives (1933). Chicago Daily Tribune (October 18).
96. Fernandes N. EC: Board composition and firm performance The role of independent board members. Journal of Multinational Financial Management. 2008;18:30–44.
97. Fernandes, N., Ferreira, M. A., Matos, P., & Murphy, K. J. (2013). Are US CEOs paid more? An international perspective. Review of Financial Studies (forthcoming).
98. Ferri, F., & Maber, D. (2010). Say on pay votes and CEO compensation: Evidence from the UK.
99. Ferri F, Sandino T. The impact of shareholder activism on financial reporting and compensation: The case of employee stock options expensing. The Accounting Review. 2009;84:433–466.
100. Fischel, D. (1995). Payback: The conspiracy to destroy Michael Milken and his financial revolution (Harper Business).
101. Fisher, L. M. (1986). Option proposal criticized. New York Times (December 27).
102. Fitzpatrick D, Scannell K, Bray C. Rakoff backs BofA accord, unhappily. Wall Street Journal 2010; (Febraury 23).
103. Flanigan, J. (1996). It’s time for all employees to get stock options. Los Angeles Times (April 21).
104. Forelle C. How journal found options pattern. Wall Street Journal 2006; (May 22).
105. Forelle, C., & Bandler, J. (2006). Backdating probe widens as two quit Silicon Valley firm; Power Integrations Officials leave amid options scandal; 10 companies involved so far. Wall Street Journal (May 6).
106. Fracassi C, Tate G. External networking and internal firm governance. Journal of Finance. 2012;67:153–194.
107. Freudenheim, M. (1993). Experts see tax curbs on executives’ pay as more political than fiscal. New York Times (February 12).
108. Fried JM. Hands-off options. Vanderbilt Law Review 2008a;61.
109. Fried JM. Option backdating and its implications. Washington and Lee Law Review 2008b;65.
110. Fried JM. Reducing the profitability of corporate insider trading through pretrading disclosure. Southern California Law Review. 1998;71:303–392.
111. Frydman, C. (2007). Rising through the ranks: The evolution of the market for corporate executives, 1936–2003.
112. Frydman C, Jenter D. CEO compensation. Annual Review of Financial Economics. 2010;2:75–102.
113. Frydman, C., & Saks, R. (2005). Historical trends in executive compensation, 1936–2003. Harvard University Working Paper.
114. Frydman C, Saks RE. Executive compensation: A new view from a long-term perspective, 1936–2005. Review of Financial Studies. 2010;23:2099–2138 <http://ssrn.com/abstract=972399>.
115. Fugitive mogul’s rent coup, 2009 New York Post (August 26).
116. Gabaix X, Landier A. Why has CEO pay increased so much?. Quarterly Journal of Economics. 2008;123:49–100.
117. Gibbons R, Murphy KJ. Relative performance evaluation for chief executive officers. Industrial and Labor Relations Review. 1990;43:30S–51S.
118. Gibbons R, Murphy KJ. Optimal incentive contracts in the presence of career concerns: Theory and evidence. Journal of Political Economy. 1992;100:468–505.
119. Gompers PA, Metrick A. Institutional investors and equity prices. Quarterly Journal of Economics. 2001;116:229–259 <http://ssrn.com/abstract=93660>.
120. Government moves to hold executives to 5.5% pay boosts (1973). Wall Street Journal (August 31).
121. Grant P, Bandler J, Forelle C. Cablevision gave backdated grant to dead official. Wall Street Journal 2006; (September 22).
122. Greenhouse, S. (1993). Deduction proposal is softened. New York Times (April 9).
123. Grossman SJ, Hart OD. An analysis of the principal-agent problem. Econometrica. 1983;51:7–45.
124. Guay WR. The sensitivity of CEO wealth to equity risk: an analysis of the magnitude and determinants. Journal of Financial Economics. 1999;53:43–71.
125. Gupta U, Berton L. Start-up firms fear change in accounting. Wall Street Journal 1986; (June 23).
126. Hall BJ, Liebman JB. Are CEOs really paid like bureaucrats?. Quarterly Journal of Economics. 1998;113:653–691.
127. Hall BJ, Murphy KJ. Stock options for undiversified executives. Journal of Accounting and Economics. 2002;33:3–42 <http://papers.ssrn.com/abstract_id=252805>.
128. Hall BJ, Murphy KJ. The trouble with stock options. Journal of Economic Perspectives. 2003;17:49–70.
129. Harlan, C. (1994). High anxiety: Accounting proposal stirs unusual uproar in executive suites. Wall Street Journal (March 7).
130. Harlan, C., & Berton, L. (1992). Accounting firms, investors criticize proposal on executives’ stock options. Wall Street Journal (February 19).
131. Hart OD. The market mechanism as an incentive scheme. Bell Journal of Economics. 1983;14:366–382.
132. Hartzell J, Ofek E, Yermack D. Whats in it for me? CEOs whose firms are acquired. Review of Financial Studies. 2004;17:37–61.
133. Hartzell J, Starks L. Institutional investors and executive compensation. Journal of Finance. 2003;58:2351–2374.
134. Healy PM. The effect of bonus schemes on accounting decisions. Journal of Accounting & Economics. 1985;7:85–112.
135. Hechinger, J., & Bandier, J. (2006). In Sycamore suit, memo points to backdating claims. Wall Street Journal (July 12).
136. Henning, P. J. (2010). Behind the fade-out of options backdating cases. New York Times (April 30).
137. Heron, R. A., & Lie, E. (2006a). Does backdating explain the stock price pattern around executive stock option grants? Journal of Financial Economics. <http://papers.ssrn.com/abstract=877889>.
138. Heron, R. A., & Erik, L. (2006b). What fraction of stock option grants to top executives have been backdated or manipulated. Unpublished working paper.
139. Higgins, A. (2007). The effect of compensation consultants: A study of market share and compensation, policy advice (October).
140. Hirshleifer D, Suh R. Risk, managerial effort, and project choice. Journal of Financial Intermediation 1992;308–345.
141. Hill, G.W. (1931). Got Bonus of $1,200,000 Stock. New York Times (March 13).
142. Hite GL, Long MS. Taxes and executive stock options. Journal of Accounting and Economics. 1982;4:3–14.
143. Holderness CG, Sheehan DP. Raiders or saviors? The evidence of six controversial investors. Journal of Financial Economics. 1985;14:555–579.
144. Holmstrom B. Moral hazard and observability. Bell Journal of Economics. 1979;10:74–91.
145. Holmstrom B. Moral hazard in teams. Bell Journal of Economics. 1982;10:74–91.
146. Holmstrom, B. (1992). Contracts and the market for executives: Comment. In Wein, Lars, & Wijkander, Hans, (Eds.), Contract Economics. Blackwell Publishers.
147. Holmstrom B, Kaplan SN. Corporate governance and merger activity in the United States: Making sense of the 1980s and 1990s. Journal of Economic Perspectives. 2001;15:121–144.
148. Holmstrom B, Milgrom P. Aggregation and linearity in the provision of intertemporal incentives. Econometrica. 1987;55:303–328.
149. Holmstrom B, Milgrom P. Multitask principal-agent analyses: Incentive contracts asset ownership, and job design. Journal of Law, Economics, and Organization. 1991;7:24–52.
150. Holmstrom BR, Kaplan SN. The state of US corporate governance What’s right and what’s wrong?. Journal of Applied Corporate Finance. 2003;5:8–20 <http://ssrn.com/abstract=441100>.
151. Holzer, J. (2011a). Corporate news: Court deals blow to SEC, activists. Wall Street Journal (July 23).
152. Holzer, J. (2011b). A yes in say on pay. Wall Street Journal (July 8).
153. Horstmeyer, D. (2011). Beyond independence: CEO influence and the internal operations of the board.
154. Hot topic: Probing stock-options backdating (2006). Wall Street Journal (May 27).
155. House group hears conflicting views on stock option taxes (1959). Wall Street Journal (December 8).
156. House Unit Seen Favoring Curbs on Stock Options (1963). Wall Street Journal (February 25).
157. Hudson, R. L. (1983). SEC rules allow concerns to curb pay disclosure: Companies likely to divulge less on executive fees, incentives, and stock options. Wall Street Journal (September 23).
158. Hulse, C., & Herszenhorn, D. M. (2008). Bailout plan is set; House braces for tough vote. New York Times (September 29).
159. Hunt, A. R. (1971). Board agrees on tightening of standards on executive pay, increases topping 5.5%. Wall Street Journal (December 17).
160. Huson M, Parrino R, Starks L. Internal monitoring mechanisms and CEO turnover: A long term perspective. Journal of Finance. 2001;56:2265–2297.
161. Hyatt, J. C. (1975). No strings: Firms lure executives by promising bonuses not linked to profits. Wall Street Journal (December 24).
162. Ittner C, Lambert RA, Larcker DF. The structure and performance consequences of equity grants to employees of new economy firms. Journal of Accounting and Economics. 2003;34:89–127.
163. Jensen, M. C. (1972). Bonuses rise through loopholes. New York Times (January 9).
164. Jensen, M. C. (1978). Executives’ use of perquisites draws scrutiny. New York Times (April 24).
165. Jensen MC. Agency costs of free cash flow: Corporate finance and takeovers. American Economic Review. 1986a;76:323–329 <http://ssrn.com/Abstract=99580>.
166. Jensen MC. The takeover controversy: Analysis and evidence. In: Coffee J, Lowenstein L, Rose-Ackerman S, eds. Takeovers and contests for corporate control. New York: Oxford University Press; 1986b.
167. Jensen MC. The modern industrial revolution exit and the failure of internal control systems. Journal of Finance. 1993;6:831–880 <http://papers.ssrn.com/Abstract=93988>.
168. Jensen MC. Paying people to lie: The truth about the budgeting process. European Financial Management. 2003;9:379–406 <http://papers.ssrn.com/Abstract=267651>.
169. Jensen MC, Meckling WH. Theory of the firm: Managerial behavior, agency costs, and ownership structure. Journal of Financial Economics. 1976;3:305–360 <http://papers.ssrn.com/Abstract=94043>.
170. Jensen MC, Murphy KJ. CEO incentives: It’s not how much you pay. But How, Harvard Business Review. 1990a;68:138–153 <http://papers.ssrn.com/Abstract=146148>.
171. Jensen MC, Murphy KJ. Performance pay and top management incentives. Journal of Political Economy. 1990b;98:225–265 <http://papers.ssrn.com/Abstract=94009>.
172. Jensen, M. C., & Murphy, K. J. (2012). The earnings management game, Harvard business school working paper; USC Marshall School Working Paper. <http://ssrn.com/abstract=1894304>.
173. Johnson SA, Ryan HE, Tian YS. Managerial incentives and corporate fraud: The sources of incentives matter. Review of Finance. 2009;13:115–145 <http://ssrn.com/abstract=395960>.
174. Johnston, D. C. (1998). Fast deadline on options repricing: As of next Tuesday, it’s ruled an expense. New York Times (December 8).
175. Joseph, R. (1978). US Industries faces queries on its perks at annual meeting. Wall Street Journal (April 20).
176. Kaplan S. Top executive rewards and firm performance: A comparison of Japan and the US. Journal of Political Economy. 1994;102:510–546.
177. Kaplan SN. Are U.S CEOs overpaid?. Academy of management, perspectives 2008;1–16.
178. Kaplan, S. N., & Minton, B. A. (2011). How has CEO turnover changed? International Review of Finance.
179. Kaplan SN, Rauh J. Wall street and main street: What contributes to the rise in the highest incomes?. Review of Financial Studies. 2010;23:1004–1050.
180. Kato, T., & Kim, W., & Lee, J.-H. (2006). Executive compensation and firm performance in Korea.
181. Kato, T., & Long, C. (2005). Executive compensation, firm performance, and corporate governance in China: Evidence from firms listed in the Shanghai and Shenzhen stock exchanges.
182. Kerr S. On the folly of rewarding A, while hoping for B. Academy of Management Journal. 1975;18:769–783.
183. Khurana R. The curse of the superstar CEO. Harvard Business Review 2002a;3–8.
184. Khurana R. Searching for a corporate savior: The irrational quest for charismatic CEOs. Princeton, NJ: Princeton University Press; 2002b.
185. Korn, M. (2010). Diebold to pay $25 million penalty. Wall Street Journal (June 3).
186. La Porta R, Lopez-De-Silanes F, Shleifer A. What works in securities laws?. Journal of Finance. 2006;61:1–32.
187. La Porta R, Lopez-De-Silanes F, Shleifer A, Vishny R. Law and finance. Journal of Political Economy. 1998;106:1113–1155.
188. Lambert RA, Larcker DF, Verrecchia RE. Portfolio considerations in valuing executive compensation. Journal of Accounting Research. 1991;29:129–149.
189. Larcker DF, McCall AL, Ormazabal G. The economic consequences of proxy advisor say-on-pay voting policies. 2012.
190. Lazear EP. Pay equality and industrial politics. Journal of Political Economy. 1989;97:561–580.
191. Lazear EP, Rosen S. Rank-order tournaments as optimum labor contracts. Journal of Political Economy. 1981;89:841–864.
192. Lee, E. (2007). Option lawsuit give up details: Shareholders suing Mercury Interactive over timing of grants. San Francisco Chronicle (February 21).
193. Lewellen WG. Executive compensation in large industrial companies. New York: National Bureau of Economic Research; 1968.
194. Lie E. On the timing of CEO stock options awards. Management Science. 2005;51:802–812.
195. Maremont, M. (2005). Authorities probe improper backdating of options: Practice allows executives to bolster their stock gains; a highly beneficial pattern. Wall Street Journal (November 11).
196. Maremont, M. (2009). Backdating likely more widespread. Wall Street Journal (August 18).
197. Martin RL. Fixing the game: Bubbles, crashes, and what capitalism can learn from the NFL. Harvard Business Review Press 2011.
198. McGahran K. SEC disclosure regulation and management perquisites. Accounting Review. 1988;63:23–41.
199. Merton RC. The theory of rational option pricing. Bell Journal of Economics and Management Science. 1973;4:141–183.
200. Metz, T. (1978). Close look expected at executive perks in proxy material: SEC stress on disclosure is linked to coming tales of holder-assisted goodies. Wall Street Journal (February 27).
201. Meulbroek LK. The efficiency of equity-linked compensation: Understanding the full cost of awarding executive stock options. Financial Management 2001;5–44.
202. Milgrom P, Roberts J. Economics, organization, and management. Englewood Cliffs, NJ: Prentice-Hall; 1992.
203. Mirrlees J. The optimal structure of incentives and authority within an organization. The Bell Journal of Economics. 1976;7:105–131.
204. Mittelstaedt F, Nichols W, Regier P. SFAS no 106 and benefit reductions in employer-sponsored retiree health care plans. The Accounting Review. 1995;70:535–556.
205. Mullaney, T. E. (1951). Parley here indicates the continued spread in industry of stock purchase option plans. New York Times (August 12).
206. Murphy KJ. Corporate performance and managerial remuneration: An empirical analysis. Journal of Accounting and Economics. 1985;7:11–42.
207. Murphy KJ. Reporting choice and the 1992 proxy disclosure rules. Journal of Accounting, Auditing, and Finance. 1996;11:497–515.
208. Murphy, K. J. (1999). Executive compensation. In A. Orley, & C. David (Eds.), Handbook of labor economics. North Holland.
209. Murphy KJ. Performance standards in incentive contracts. Journal of Accounting & Economics. 2000;30:245–278 <http://papers.ssrn.com/abstract=189808>.
210. Murphy KJ. Explaining executive compensation: Managerial power vs the perceived cost of stock options. University of Chicago Law Review. 2002;69:847–869.
211. Murphy KJ. Stock-based pay in new economy firms. Journal of Accounting & Economics. 2003;34:129–147.
212. Murphy, K. J. (2012). Pay, politics and the financial crisis. In A. Blinder, A. Lo, & R. Solow (Eds.), Economic lessons from the financial crisis. Russell Sage Foundation.
213. Murphy, K. J., & Jensen, M. C. (2011). CEO bonus plans and how to fix them, Harvard business school NOM unit working paper 12-022; Marshall school of business working paper no. FBE 02-11. Available at SSRN: <http://ssrn.com/abstract=1935654>.
214. Murphy, K. J., & Oyer, P. (2004). Discretion in executive incentive contracts. USC working paper.
215. Murphy KJ, Sandino T. Executive pay and independent compensation consultants. Journal of Accounting and Economics. 2010;49:247–262.
216. Murphy, K. J., & T. Sandino (2012). Are compensation consultants to blame for high CEO pay?.
217. Murphy, K. J., & Zábojník, J. (2008). Managerial capital and the market for CEOs.
218. Muslu, V. (2008). Inside board membership, pay disclosures and incentive compensation in Europe.
219. Narayanan, M. P., & Seyhun, H. N. (2005). Effect of Sarbanes-Oxley act on the influencing of executive compensation.
220. Nicklaus, D. (2010). Scandal left both sides sullied: Backdating undermined confidence, but some good guys overreached, St. Louis Post-Dispatch (February 21).
221. Nixon halts push to retain some of phase 4 controls (1974). Wall Street Journal (April 5).
222. Old wage board exits: new unit to take over with reduced powers (1952). Wall Street Journal (July 30).
223. One in 6 companies gives stock options (1952). New York Times (June 30).
224. Options defended at salary hearing: Restricted stock plans called neither inflationary nor compensatory by 8 men (1951). New York Times (August 7).
225. Options on stocks scored at hearing: Majority of witnesses call it inflationary and unfair to small stock holders (1951). New York Times (August 9).
226. Options on the wane: Fewer firms plan sale of stock to executives at fixed exercise prices (1960). Wall Street Journal (December 6).
227. Ostroff, J. (1993). Clinton’s economic plan hits taxes, payrolls and perks (February 18).
228. Oyer P. Why do firms use incentives that have no incentive effects?. Journal of Finance. 2004;59:1619–1649.
229. Oyer P, Schaefer S. Why do some firms give stock options to all employees: An empirical examination of alternative theories. Journal of Financial Economics. 2005;76:99–133.
230. Peers A. Executives take advantage of new rules on selling shares bought with options. Wall Street Journal 1991; (June 19).
231. Penn, S. (1978). Ford Motor covered upkeep for elegant co-op of chairman: Questions arise on personal vs. business use of suite in posh New York hotel. Wall Street Journal (April 24).
232. Perry T, Zenner M. Pay for Performance? government regulation and the structure of compensation contracts. Journal of Financial Economics. 2001;62:453–488.
233. Personal-use perks for top executives are termed income: SEC says valuable privileges will have to be reported as compensation by firms (1977). Wall Street Journal (August 22).
234. Plitch, P. (2006). Paydirt: Sarbanes-Oxley a pussycat on clawbacks. Dow Jones Newswires (June 9).
235. Politics and policy-campaign ‘92: From Quayle to Clinton, politicians are pouncing on the hot issue of top executive’s hefty salaries (1992). Wall Street Journal (January 15).
236. Prendergast C. The tenuous trade-off between risk and incentives. Journal of Political Economy. 2002;110:1071–1102.
237. President studies high salary curb: Tax power is urged as means of controlling stipends in big industries (1933). New York Times (October 23).
238. Railroad salary report: ICC asks Class 1 roads about jobs paying more than $10,000 a year (1932). Wall Street Journal (April 28).
239. Rankin D. Incentives for business spending proposed in corporate package. New York Times 1978; (January 22).
240. RFC fixed pay limits: Cuts required to obtain loans (1933). Los Angeles Times (May 29).
241. Ricklefs R. Sweetening the pot: Stock options allure fades, so firms seek different incentives. Wall Street Journal 1975; (May 27).
242. Ricklefs R. Firms offer packages of long-term incentives as stock options go sour for some executives. Wall Street Journal 1977; (May 9).
243. Robbins LH. Inquiry into high salaries pressed by the government. New York Times 1933; (October 29).
244. Rose NL, Wolfram CD. Regulating executive pay: Using the tax code to influence chief executive officer compensation. Journal of Labor Economics. 2002;20:S138–S175.
245. Rosen S. The economics of superstars. American Economic Review. 1981;71:845–858.
246. Rosen S. Authority, control, and the distribution of earnings. Bell Journal of Economics. 1982;13:311–323.
247. Ross SA. The economic theory of agency: The principal’s problems. American Economic Review. 1973;62:134–139.
248. Rudnitsky, H., & Green, R. (1985). Options are free, aren’t they? Forbes (August 26).
249. Rules are issued on stock options (1951). New York Times (November 15).
250. Ryst, S. (2006). How to clean up a scandal. BusinessWeek.com (November 27).
251. Salary board urged to ban stock option plans until end of emergency (1951). Wall Street Journal (August 9).
252. Salary board’s panel to study stock option in top executive pay (1951). Wall Street Journal (July 17).
253. Saly PJ. Repricing executive stock options in a down market. Journal of Accounting and Economics. 1994;18:325–356.
254. Scannell K, Rappaport L, Bravin J. Judge tosses out bonus deal—SEC pact with BofA over Merrill is slammed; New York weighs charges against Lewis. Wall Street Journal 2009; (September 15).
255. Scharfstein DS. Product market competition and managerial slack. Rand Journal of Economics. 1988;19:147–155.
256. Scheck J, Stecklow S. Brocade Ex-CEO gets 21 months in prison. Wall Street Journal 2008; (January 17).
257. Schellhardt, T. D. (1977). Perilous perks: Those business payoffs didn’t all go abroad; bosses got some, too; IRS and SEC investigating loans and lush amenities provided for executitves; an eye on hunting lodges. Wall Street Journal (May 2).
258. Scipio, P. (1998). NYSE opens option loop hole. Investor Relations Business (May 11).
259. SEC exempts rights to stock appreciation from insider curbs (1976). Wall Street Journal (December 29).
260. SEC to push for data on pay of executives (1992). Wall Street Journal (January 21).
261. Senate unit votes to tighten rules on stock options (1964, January 15).
262. Shareholder groups cheer SEC’s moves on disclosure of executive compensation (1992). Wall Street Journal (February 14).
263. Siconolfi M. Wall Street is upset by Clinton’s support on ending tax break for excessive pay. Wall Street Journal 1992; (October 21).
264. Skinner DJ, Sloan RG. Earnings surprises growth expectations, and stock returns or don’t let an earnings torpedo sink your portfolio. Review of Accounting Studies. 2002;7:289–312.
265. Smith, A. (1776). The Wealth of Nations (Modern Library, Edited by Edwin Cannan, 1904. Reprint edition 1937, New York).
266. Solomon D, Paletta D. US bailout plan calms markets, but struggle looms over details. Wall Street Journal 2008; (September 20).
267. Stanton T. Cash comeback: Stock options begin to lose favor in wake of tax law revision. Wall Street Journal 1964; (August 10).
268. Stewart GB. The quest for value: A guide for senior managers. New York: Harper Business; 1991.
269. Stock options: Industry says salary board should keep its hands off employee plans (1951). Wall Street Journal (August 7).
270. Sundaram R, Yermack D. Pay me later: Inside debt and its role in managerial compensation. Journal of Finance. 2007;62:1551–1588.
271. Sycamore Networks (2001). Q2 stock option grants issues. <http://online.wsj.com/public/resources/documents/sycamore_memo071206.pdf>.
272. Taibbi M. Politics: OWS’s beef: Wall street isn’t winning—it’s cheating. Rolling Stone 2011; (October 25).
273. Thomas, R. S. (2008). International executive pay: Current practices and future trends.
274. Tse TM. Shareholders say yes to executive pay plans; review tracks advisory votes at TARP firms. Washington Post 2009; (September 26).
275. US Senate backs resolution to remove option plan (1994). Reuters News (May 4).
276. US Steel guards data on salaries: Sends details confidentially to SEC head with request that they be kept secret (1935). New York Times (June 2).
277. Waxman, H. A. et. al. (2007). Executive pay: Conflicts of interest among compensation consultants (December).
278. Wells H. No man can be worth $1,000,000 a year: The fight over executive compensation in 1930s America. University of Richmond Law Review 2010;44.
279. Wells, H. (2011). US executive compensation in historical perspective. In J. Hill, & R. S. Thomas (Eds.), The research handbook on executive pay. Edgar Elgar.
280. Wotapka D. Former CEO at KB Home is convicted. Wall Street Journal 2010; (April 22).
281. Yermack D. Do corporations award CEO stock options effectively?. Journal of Financial Economics. 1995;39:237–269.
282. Yermack D. Good timing: CEO stock option awards and company news announcements. Journal of Finance. 1997;52:449–476 <http://papers.ssrn.com/abstract=8189>.
283. Yermack D. Flights of fancy: Corporate jets, CEO perquisites, and inferior shareholder returns. Journal of Financial Economics 2006a;80.
284. Yermack D. Golden handshakes: Separation pay for retired and dismissed CEOs. Journal of Accounting and Economics. 2006b;41:237–256.
285. Yermack D. Deductio ad absurdum: CEOs donating their own stock to their own family foundations. Journal of Financial Economics 2009;94.
286. Zábojník J. Pay-performance sensitivity and production uncertainty. Economic Letters. 1996;53:291–296.
287. Zhou X. CEO pay, firm size, and corporate performance: Evidence from Canada. Canadian Journal of Economics. 2000;33:213–251.
288. Zimmerman FL. Washington word: Don’t do as we do but do as we say: for bureaucrats, lawmakers, hard times aren’t here; limousines and free trips. Wall Street Journal 1975; (February 7).
289. Zuckerman G, Strasburg J, Esterl M. VW’s 348% two-day gain is pain for hedge funds. Wall Street Journal 2008; (October 29).
1See, for example, Murphy (2002, 2003) and Hall and Murphy (2003).
2Congress has occasionally attempted to cap wage increases. For example, the World War II Stabilization Act of 1942 froze wages and salaries (for all workers, not just executives), and the 1971 Nixon wage-and-price controls imposed a 5.5% limit on increases in executive pay (the limit being binding for company-defined groups of executives, but not necessarily for individual executives). In addition, Congress has occasionally imposed restrictions on individual pay components, such as Sarbanes-Oxley’s prohibition on company-provided loans. More recently, Congress directly (and enthusiastically) regulated both the level and structure of pay for executives in financial services firms receiving assistance under Treasury’s Troubled Asset Relief Program (“TARP”), see Section 3.8.5 below.
3Standard & Poor’s ExecuComp database—the most widely used data in executive compensation research—defines grant-date and realized compensation as “TDC1” and “TDC2”, respectively. However, since the value of restricted shares upon vesting has only been disclosed since 2006, ExecuComp actually measures TDC2 using grant-date values for restricted shares (and exercise gains for options).
4I adopt the convention that companies with fiscal closings after May 31, in year “T” are assigned to fiscal year “T” while companies with fiscal closings on or before May 31, Year “T” are assigned to fiscal year “T−1”. Thus, the 2011 fiscal year includes companies with fiscal closings between June 1, 2011 and May 31, 2012. The data in Figure 2.1 are based on the ExecuComp’s May 2012 update, and exclude 35 companies that had not yet filed proxy statements by May 2012.
5The categories in Figure 2.1 are designed to correspond to the SEC disclosure requirements effective as of December 2006. Under the prior disclosure requirements, firms separately reported “annual bonuses” and “payouts from long-term performance plans”. Under the 2006 requirements, both annual cash bonuses from short-term incentive plans and long-term performance bonuses are considered “non-equity incentive compensation” if they are based on pre-established and communicated performance targets. If they are not based on pre-established and communicated targets the SEC (and I) treat them as discretionary bonuses.
6The actual payouts during the year are used as an estimate for grant-date non-equity incentives in firms without reported targets or caps.
7The “change in the actuarial value of pension benefits” is the year-to-year change in the actuarial present value of the CEO’s accumulated benefit under all defined benefit and actuarial pension plans, assuming a normal retirement age as defined in each company’s plan (or, if not so defined, the earliest time at which the CEO may retire under the plan without any benefit reduction due to age). The pension information in Figure 2.1 was first available in 2006, and these amounts are therefore excluded in my historical analyses below.
8The “spike” in exercise gains in 2006 likely reflects companies accelerating the exercisability of options in anticipation of new accounting rules that would require an accounting expense for outstanding non-exercisable options; see Choudhary, Rajgopal, and Venkatachalam (2009) and the discussion in Section 3.8.4 below.
9The Forbes survey includes data from the largest 500 firms ranked by market capitalization, assets, sales, and net income; the union of these sets includes approximately 800 CEOs per year. The ExecuComp survey includes data from firms in the S&P 500, S&P MidCap 400, S&P SmallCap 600, plus additional firms not in these indices, and covers approximately 1800 CEOs per year. Compustat historical data were used to identify firms included in the S&P 500 at the end of each fiscal year.
10ExecuComp’s modifications for 1992–2006 include using 70% of the option full term, and Winsorizing dividends and volatilities. Equity compensation prior to 1978 estimated based on option compensation in 73 large manufacturing firms (based on Murphy (1985)), equity compensation from 1979 through 1991 estimated as amounts realized from exercising stock options during the year, rather than grant-date values. Using the amounts realized from the exercise of options (rather than the value of options granted) from 1978 to 1991 is also not expected to impose a large bias in the general trend in options and compensation. Indeed, Frydman and Saks (2005) show that trends based on grants and exercises were nearly indistinguishable during this period. In addition, Hall and Liebman (1998) analyze trends in grant-date option values during the 1980s and document a very similar pattern to that shown in Figure 3.
11The 2010 average pay in Figure 3 ($10.9 million) is slightly smaller than the $11.6 million average in Figure 1. This difference largely reflects the fact that Figure 1 includes the change in the actuarial value of pension benefits, a component of compensation that was not disclosed or reported before 2006. Another difference—but relatively immaterial—is that Figure 1 includes the “target” rather than realized payouts from bonuses and other non-equity incentive plans; these data also became available after the 2006 revisions in disclosure rules. To maintain comparability in the time-series, Figure 3 excludes pensions and uses payouts rather than targets for bonus plans.
12I define new economy firms as companies with primary SIC designations of 3570 (Computer and Office Equipment), 3571 (Electronic Computers), 3572 (Computer Storage Devices), 3576 (Computer Communication Equipment), 3577 (Computer Peripheral Equipment), 3661 (Telephone & Telegraph Apparatus), 3674 (Semiconductor and Related Devices), 4812 (Wireless Telecommunication), 4813 (Telecommunication), 5045 (Computers and Software Wholesalers), 5961 (Electronic Mail-Order Houses), 7370 (Computer Programming, Data Processing), 7371 (Computer Programming Service), 7372 (Prepackaged Software), and 7373 (Computer Integrated Systems Design).
13Employment agreements often provide for accelerated vesting in situations where the executive is terminated by the company without cause.
14Meulbroek (2001) measures the value:cost “inefficiency” of options using a completely different (non-utility-based) but complementary approach. Her method enables her to make precise estimates of what she calls the “deadweight cost” of option grants without knowledge of the specific utility function or wealth holdings of executives. Her approach produces a lower bound estimate of the value-cost inefficiency since her goal is to isolate the deadweight cost owing to sub-optimal diversification, while abstracting from any additional deadweight cost from the specific structure of the compensation contract.
15Cai and Vijh (2005) adopt a more-realistic (but computationally more difficult) assumption that the executive’s safe wealth is optimally allocated between a riskless asset and the market portfolio. An advantage of the Cai–Vijh approach is that the certainty-equivalent values of options can never exceed Black–Scholes values.
16For tractability, I assume that the distribution of future stock prices is the same whether the executive receives options or cash. If the grant provides incentives that shift the distribution, and if the shift is not already incorporated into stock prices as of the grant date, I will underestimate both the cost and value of the option.
17Under pre-2006 disclosure rules, companies reported only the aggregate number of options outstanding at the end of each year, and the intrinsic value of the in-the-money options. Following the procedure described in Murphy (1999) and adopted by Core and Guay (2002), I subtract the current-year grant from the year-end option holdings and calculate the number and average exercise price of prior grants.
18The results are generally robust to reasonable changes in these assumptions. In addition, for post-2006 data, I re-estimated certainty equivalents after including the actuarial value of pension benefits as safe wealth; the results are generally unaffected by this change.
19The percentage option holdings multiplied by the option delta is a measure of the change in CEO option-related wealth corresponding to a change in shareholder wealth. More formally, suppose that the CEO holds N options, and suppose that shareholder wealth increases by $1. If there are S total shares outstanding, the share price P will increase by P = $1/S, and the value of the CEO’s options will increase by N P(∂V/∂P), where V is the Black–Scholes value of each option, and (∂V/∂P) is the option delta. Substituting for P, the CEO’s share of the value increase is given by (N/S)(∂V/∂P), or the CEO’s options held as a fraction of total shares outstanding multiplied by the “slope” of the Black–Scholes valuation. For examples of this approach see Jensen and Murphy (1990a), Yermack (1995), and Murphy (1999). Hall and Murphy (2002) offer a modified approach to measure the pay-for-performance incentives of risk-averse undiversified executives. An alternative approach, adopted by Jensen and Murphy (1990b), involves estimating the option pay-performance sensitivity as the coefficient from a regression of the change in option value on the change in shareholder wealth.
20Proxy disclosure rules effective since December 2006 provide the details on year-end option portfolios required to estimate Options Deltas. Year-end portfolios prior to 2006 are estimated using the procedure described in Murphy (1999) and adopted by Core and Guay (2002).
21Including incentives from potential dismissals and performance-related changes in the value of salaries, bonuses, and option grants, increased the “final” Jensen–Murphy estimate to $3.25 per $1,000, or an effective ownership percentage of 0.325%.
22Suppose that the CEO holds M shares and N options. If the share price P increases by 1%. If there are S total shares outstanding, the value of the CEO’s portfolio will increase by 0.01P(M + N(∂V/∂P)) or 0.01(PS)[(M + N(∂V/∂P))/S], where PS is the firm’s market capitalization and the quantity in the square brackets is the equation for the CEO’s effective ownership percentage.
23Several early studies, including Murphy (1985) and Gibbons and Murphy (1992), used the “pay-performance elasticity”, defined as the percentage change in current compensation associated with a percentage change in company performance. While the pay-performance elasticity reflects how boards adjust current compensation to changes in performance, it ignores the CEO’s portfolio of stock and options and therefore does not measure CEO incentives. Edmans, Gabaix, and Landier (2009) suggest a measure where the change in CEO wealth from stock and option holdings is divided by the CEO’s current compensation rather than the CEO’s total wealth; this measure is proportional to the wealth-performance elasticity to the extent that CEO wealth is proportional to current compensation. As emphasized by Murphy (1999), the empirical advantage of elasticity measures is that they are typically independent of firm size. In contrast, the Jensen-Murphy “effective ownership” percentage is predictably smaller for CEOs of larger firms.
24See, for example, Sundaram and Yermack (2007), Edmans and Liu (2011); Edmans, “How to Fix Executive Compensation”, Wall Street Journal (2012). “Debt compensation” typically consists of deferred compensation or nonqualified defined-benefit pension plans, where the executive joins other unsecured creditors in bankruptcy.
25Although there is little theoretical guidance on the appropriate measure of risk-taking incentives, Alex Edmans (in private correspondence) suggests that the appropriate measure likely depends on the CEO’s cost of increasing volatility. In particular, the Total Option Vega is likely the correct measure if the cost to increase volatility has an additive effect on CEO utility, while the Vega Elasticity is likely correct if the cost has a multiplicative effect. Dittmann and Yu (2011) propose an alternative measure related to the ratio of vega to delta.
26DeFusco, Johnson, and Zorn (1990) find some evidence that stock-price volatility increases, and traded bond prices decrease, after the approval of executive stock option plans. Similarly, Agrawal and Mandelker (1987) find some evidence that managers of firms whose return volatility is increased by an acquisition have higher option compensation than managers whose volatility declined.
27This section draws heavily from Murphy (1999) and Murphy and Jensen (2011).
28The pioneering empirical paper is Healy (1985), who found that executives use discretionary accrual charges to shift earnings to a later period whenever performance exceeds the upper performance threshold. Holmstrom and Milgrom (1987) provide the classic theoretical justification for linear contracts based on specific modeling assumptions; Edmans and Gabaix (2011) provide more general conditions for linearity.
29Classic papers include Hirshleifer and Suh (1992) and Guay (1999).
30See Murphy and Jensen (2011) for an extended discussion and example of these practices.
31In his classic paper on optimal contracts, Holmstrom (1979) considers a case where the principals (i.e. the shareholders) know precisely what action they want the agent (i.e. the CEO) to take, but cannot observe whether the CEO in fact took that action. Holmstrom shows that the optimal contract will include any performance measures that are useful (or “informative”) in determining whether the CEO took the prescribed action. This so-called “informativeness principle” was widely embraced by many academics who used it as the theoretical justification for analyzing performance measures used in CEO contracts. However, as emphasized in Holmstrom (1992) and implicit in Holmstrom and Milgrom (1991), the informativeness principle is not applicable in the realistic multi-tasking case where the shareholders do not know precisely what actions they want the CEO to take, and indeed entrust their money to self-interested CEOs specifically because CEOs have superior skill or information in making investment decisions.
32See Jensen and Murphy (2012) for a more-detailed treatment of the analysis in this section.
33The data and analysis underlying Figure 12 were generously provided by David Huelsbeck.
34See, for example, Edmans et al. (2012) and (in the context of the financial crisis) Bhagat and Bolton (2011).
35While the recent Occupy Wall Street movement is insufficiently organized to speak with a single voice, a plausible interpretation of their attack on Wall Street pay (and CEO pay, more generally) is the perception that pay is rigged; see, for example, Taibbi, “Politics: OWS’s Beef: Wall Street Isn’t Winning – It’s Cheating”, Rolling Stone (2011).
36The material in this subsection is largely drawn from Wells (2010, 2011).
37“$1,623,753 Grace’s Bonus For 1929: Bethlehem President Testifies At Merger Trial To Receiving This Amount,” Wall Street Journal (1903), “Bonus Figures Given At Trial: Six Vice Presidents Of Bethlehem Received $1,432,033 In 1929”, Wall Street Journal (1930).
38In particular, American Tobacco’s George Hill was allowed to purchase 13,440 shares of company stock at its $25 “par value” at a time when shares were trading for about $120. See “G. W. Hill Got Bonus of $1,200,000 Stock”, New York Times(1931).
39“Railroad Salary Report: I.C.C. Asks Class 1 Roads About Jobs Paying More Than $10,000 a Year,” Wall Street Journal (1932).
40The required reductions ranged from 15% (for executives earning less than $15,000) to 60% (for executives earning more than $100,000. See “RFC Fixed Pay Limits: Cuts Required to Obtain Loans,” Los Angeles Times (1933), “Cut High Salaries or Get No Loans, is RFC Warning”, New York Times (1933).
41See Robbins, “Inquiry into High Salaries Pressed by the Government”, New York Times (1933) and “President Studies High Salary Curb: Tax Power is Urged as Means of Controlling Stipends in Big Industries”, New York Times (1933). In addition to investigating corporate executive pay, President Roosevelt personally called attention to lavish rewards in Hollywood, resulting in a provision added to the moving-picture code that imposed heavy fines on companies paying unreasonable salaries.
42“Federal Bureau Asks Salaries of Big Companies’ Executives”, Chicago Daily Tribune (1933).
43“US Steel Guards Data on Salaries: Sends details confidentially to SEC head with request that they be kept secret”, New York Times (1935).
44The average length of 2007 proxy statements for the 100 largest firms (ranked by revenues) was 62.8 pages (ignoring appendices). In 2006—before the 2006 disclosure rules—the average length was 45 pages.
45Rossheim v. Commissioner, 92 F. 2d 247 (1937).
46Commissioner v. Smith, 324 U.S. 177 (1945).
47To deter insider trading, Section 16b of the 1934 Securities Act requires that any profit realized by an officer or director in the purchase or sale of an equity security within a six-month period be returned to the company.
48At a 91% tax rate, the CEO must receive $11.11 before tax to realize $1 after tax. But, at a 50.75% corporate tax rate, paying $11.11 in deductible compensation costs reduces after-tax profits by only $5.47.
49Mullaney, “Parley Here Indicates the Continued Spread in Industry of Stock Purchase Option Plans,” New York Times (1951). The percentages are based on average of 840 NYSE-listed firms in 1950 and 876 in June 1951.
50Lewellen (1968) reports both the pre-tax and after-tax values for salaries and bonuses, but only the after-tax values for stock options and deferred compensation. The pre-tax values for stock options after 1950 are determined by dividing the after-tax value by .85 (Lewellen uses a 15% effective tax rate for options). The pre-tax value for deferred compensation (and for options prior to 1950) are estimated by dividing the after-tax value by (1-t*), where t* is one-half of the implied average tax rate for salaries and bonuses. For example, if Lewellen reports pre-tax and after-tax salaries and bonuses of $240,000 and $80,000, respectively, suggesting an average tax rate of 60%, we would calculate pre-tax deferred compensation using a tax rate of 30%.
51“Salary Board’s Panel to Study Stock Option in Top Executive Pay,” Wall Street Journal (1951), “Options Defended at Salary Hearing: Restricted Stock Plans Called Neither Inflationary Nor Compensatory by 8 Men,” New York Times (1951), “Options on Stocks Scored at Hearing: Majority of Witnesses Call it Inflationary and Unfair to Small Stockholders,” New York Times (1951), “Salary Board Urged to Ban Stock Option Plans Until End of Emergency,” Wall Street Journal (1951), “Stock Options: Industry Says Salary Board Should Keep Its Hands Off Employee Plans,” Wall Street Journal (1951).
52“Rules are Issued on Stock Options,” New York Times (1951).
53“One in 6 Companies Gives Stock Options,” New York Times (1952).
54“Ailing Options: Stock Market Decline Dulls Allure of Plans For Company Officials,” Wall Street Journal (1957).
55The 1961 survey is described in Stanton, “Cash Comeback: Stock Options Begin to Lose Favor in Wake of Tax Law Revision,” Wall Street Journal (1964).
56“Options on the Wane: Fewer Firms Plan Sale of Stock to Executives at Fixed Exercise Prices,” Wall Street Journal (1960), “Congress and Taxes: Specialists Mull Ways to Close “Loopholes” in Present Tax Laws,” Wall Street Journal (1959), “House Group Hears Conflicting Views on Stock Option Taxes,” Wall Street Journal (1959).
57“Chrysler Chairman Defends Option Plan, Offers to Discuss It With Federal Officials,” Wall Street Journal (1963), “Chrysler Officers Got Profit of $4.2 Million On Option Stock in ‘63,” Wall Street Journal (1964), “Chrysler Officers’ Sale of Option Stock Could Stir Tax Bill Debate,” Wall Street Journal (1963), “House Unit Seen Favoring Curbs on Stock Options,” Wall Street Journal (1963), “Senate Unit Votes to Tighten Rules on Stock Options,” (1964).
58See Stanton, “Cash Comeback: Stock Options Begin to Lose Favor in Wake of Tax Law Revision,” Wall Street Journal (1964). Stock options briefly resurged in 1966, following at 25% increase in the Dow Jones average from 1964 to early 1966 (Elia, “Opting for Options: Stock Plans Continue in Widespread Favor Despite Tax Changes,” Wall Street Journal (1967)).
59In particular, if the option gains exceed 50% of the executive’s total income (including option gains), the amount of the option gain over 50% would be treated as fully taxable ordinary income. The AMT was passed following revelations that 155 high-income households took deductions that reduced their federal tax liabilities to zero.
60Hunt, “Board Agrees on Tightening of Standards on Executive Pay, Increases Topping 5.5%,” Wall Street Journal (1971).
61“Old Wage Board Exits: New Unit to Take Over with Reduced Powers,” Wall Street Journal (1952).
62Jensen, “Bonuses Rise Through Loopholes,” New York Times (1972). For the complete text of the executive compensation provisions, see “Board’s Text on Executive Compensation,” Wall Street Journal (1971).
63Valuation is based on testimony by Richard McNamar, director of the Pay Boards office of economic policy. See Calame, “Executives’ Pay Faces Going-Over By Wage Board,” Wall Street Journal (1972).
64The calculations are based on annual compensation surveys published in Forbes covering the largest 500 companies ranked by revenues, assets, market capitalization, and employees (about 800 companies are listed in one or more of these Forbes rankings annually).
65“Government Moves to Hold Executives to 5.5% Pay Boosts,” Wall Street Journal (1973).
66“Business Groups Oppose Nixon Control Plan, Intensify Their Efforts to Abolish Restraints,” Wall Street Journal (1974), “Nixon Halts Push to Retain Some of Phase 4 Controls,” Wall Street Journal (1974).
67Ricklefs, “Sweetening the Pot: Stock Options Allure Fades, So Firms Seek Different Incentives,” Wall Street Journal (1975), Hyatt, “No Strings: Firms Lure Executives By Promising Bonuses Not Linked To Profits,” Wall Street Journal (1975), Ricklefs, “Firms Offer Packages of Long-Term Incentives as Stock Options Go Sour for Some Executives,” Wall Street Journal (1977).
68See, for example, Bender, “The Executive’s Tax-Free Perks: The IRS Looks Harder at the Array of Extras,” New York Times (1975a), Bender, “Fringe Benefits at the Top: Shareholder Ire Focuses on Loan Systems,” New York Times (1975b), Blumenthal, “Misuse of Corporate Jets by Executives is Drawing More Fire,” New York Times (1977), Schellhardt, “Perilous Perks: Those Business Payoffs Didn’t All Go Abroad; Bosses Got Some, Too; IRS and SEC Investigating Loans and Lush Amenities Provided for Executitves; An Eye on Hunting Lodges,” Wall Street Journal (1977).
69Rankin, “Incentives for Business Spending Proposed in Corporate Package,” New York Times (1978), “Excerpts From Carter Message to Congress on Proposals to Change Tax System,” New York Times (1978).
70Zimmerman, “Washington Word: Don’t Do as We Do But Do as We Say: For Bureaucrats, Lawmakers, Hard Times Aren’t Here; Limousines and Free Trips,” Wall Street Journal (1975).
71“Personal-Use Perks For Top Executives Are Termed Income: SEC Says Valuable Privileges Will Have to be Reported As Compensation by Firms,” Wall Street Journal (1977).
72Jensen, “Executives’ Use of Perquisites Draws Scrutiny,” New York Times (1978).
73Examples include: Joseph, “ US Industries Faces Queries on its Perks At Annual Meeting,” Wall Street Journal (1978), Metz, “Close Look Expected At Executive Perks in Proxy Material: SEC Stress on Disclosure Is Linked to Coming Tales of Holder-Assisted Goodies,” Wall Streety Journal (1978), Penn, “Ford Motor Covered Upkeep for Elegant Co-Op of Chairman: Questions Arise on Personal vs. Business Use of Suite in Posh New York Hotel,” Wall Street Journal (1978).
74This period is often called the vesting period but this terminology is misleading since vesting implies that the executive is free to sell the option or keep it if he leaves the firm, as opposed to being able only to exercise the option.
75The executive could defer the taxes during the six-month holding period, but would still owe taxes on the gain on the exercise date even if stock prices fell over the subsequent six months.
76“SEC Exempts Rights To Stock Appreciation From ‘Insider’ Curbs,” Wall Street Journal (1976).
77There was one major disadvantage of SARs over non-qualified options: companies granting SARs were required to record an accounting charge for the evolving value of the SARs, while there was typically no accounting charge for options.
78Peers, “Executives Take Advantage of New Rules on Selling Shares Bought With Options,” Wall Street Journal (1991).
79A related innovation in the late 1980s was the “Stock Depreciation Right,” which provided cash payments to executives exercising options if stock prices fell during the six month holding period. (See Crystal, “The Wacky, Wacky World of CEO Pay,” (1988)).
80Bettner, “Incentive Stock Options Get Mixed Reviews, Despite the Tax Break They Offer Executives,” Wall Street Journal (1981).
81Jensen (1986a) defines free cash flow as cash flow in excess of that which can be reinvested at returns equal to or better than the cost of capital.
82See Holderness and Sheehan (1985) for an analysis of how the first six on this list improved operating results and shareholder values, and Fischel (1995) for an analysis of how T. Boone Pickens facilitated the restructuring of the oil sector.
83In regulations associated with the TARP bailouts in 2008–2009, Congress redefined golden parachutes to refer to any severance payment in connection with an executive departure, regardless of whether the departure was related to a change of control. In contrast, the golden parachute label prior to the TARP bailouts required a change of control, but did not require departure. For example, accelerated vesting of restricted stock or accelerated exercisability of stock options upon a change of control was considered part of the parachute payment, even if the executive retained his or her job.
84The golden parachute payment includes not only cash payments but also the value of accelerated vesting of stock and options, as long as the payment is contingent on a change of control or ownership of the company.
85Alpern and McGowan (2001), p. 6.
86For example, continuing with the example above, suppose the CEO owed $420,000 in excise taxes (i.e. 20% of the $2.1 million excess benefit). If the CEO had a gross-up clause (and assuming a marginal tax on ordinary income of 50% on top of the 20% excise tax), he would receive a gross-up payment of $1.4 million and a total change-in-control payment of $4.5 million, leaving him with after-tax income of $1.55 million (which is what he would have received without an excise tax).
87Alpern and McGowan (2001, p. 7–8).
88See Crystal, “Manager’s Journal: Congress Thinks It Knows Best About Executive Compensation,” Wall Street Journal (1984).
89The percentage compositions in Figure 16 are not strictly comparable to those in Figure 4 or Figure 15, and overstate the percentage of compensation in options relative to the methodology used elsewhere in this study.
90“SEC to Push for Data on Pay of Executives,” Wall Street Journal (1992).
91“Shareholder Groups Cheer SEC’s Moves on Disclosure of Executive Compensation,” Wall Street Journal (1992).
92“Politics and Policy—Campaign ‘92: From Quayle to Clinton, Politicians are Pouncing on the Hot Issue of Top Executive’s Hefty Salaries,” Wall Street Journal (1992).
93Chronicle Staff and Wire Reports, “Big Earners cashing in now: fearful of Clinton’s tax plans, they rush to exercise their options,” San Francisco Chronicle (1992).
94Siconolfi, “Wall Street is upset by Clinton’s support on ending tax break for ‘excessive’ pay,” Wall Street Journal (1992).
95Freudenheim, “Experts see tax curbs on executives’ pay as more political than fiscal,” New York Times (1993), Ostroff, “Clinton’s Economic Plan Hits Taxes, Payrolls and Perks,” (1993).
96Greenhouse, “Deduction proposal is softened,” New York Times (1993).
971993 US Code Congressional and Administrative News 877, as cited in Perry and Zenner (2001).
98The minimum value approach is identical to the value of a forward contract to purchase a share of stock at some date in the future at a pre-determined price (that is, an option without the option to refrain from buying when the price falls below the exercise price). For example, the minimum value of an option on a non-dividend-paying stock is calculated as the current stock price minus the grant-date present value of the exercise price. Thus, the value of a ten-year option granted with an exercise price of $30 when the grant-date market price was $25 would be V = $25 – $30/(1+r)10, where r is the risk-free rate.
99See, for example, Rudnitsky and Green, “Options Are Free, Aren’t They?”, Forbes, (August 26, 1985), Gupta and Berton, “Start-up Firms Fear Change in Accounting,” Wall Street Journal (1986), Gupta and Berton, “Start-up Firms Fear Change in Accounting,” Wall Street Journal (1986), Fisher, “Option Proposal Criticized,” New York Times (1986), Eckhouse, “Tech Firms’ Study: Accounting Rule Attacked,” San Francisco Chronicle (1987).
100Connor, “There’s No Accounting for Realism at the FASB,” Wall Street Journal (1987).
101See, for example, Berton, “Business chiefs try to derail proposal on stock options,” Wall Street Journal (1992), Harlan and Berton, “Accounting Firms, Investors Criticize Proposal on Executives’ Stock Options,” Wall Street Journal (1992), “Bentsen Opposes FASB On Reporting Stock Options,” Wall Street Journal (1993), Berton, “Accounting Rule-Making Board’s Proposal Draws Fire,” Wall Street Journal (1994), Harlan, “High Anxiety: Accounting Proposal Stirs Unusual Uproar In Executive Suites,” Wall Street Journal (1994).
102“Clinton Enters Debate Over How Companies Reckon Stock Options,” Wall Street Journal (1993).
103Johnston, “Fast Deadline On Options Repricing: As of Next Tuesday, It’s Ruled an Expense,” New York Times (1998).
104Based on a sample of approximately 600 large companies granting options to their CEOs during fiscal 1992, Murphy (1996) shows that about one-third of the companies reported grant-date values, while the remaining two-thirds reported potential values. Companies with higher dividend yields and lower volatilities (both factors that decrease Black–Scholes values) were significantly more likely to report Black–Scholes rather than potential values.
105Bryant, “New Rules on Stock Options By Big Board Irk Investors,” New York Times (1998), Scipio, “NYSE Opens Option Loop Hole,” Investor Relations Business (1998).
106See, for example, Flanigan, “It’s Time for All Employees to Get Stock Options,” Los Angeles Times (1996), who argued that all employees should receive options if top executives receive options.
107Options granted to lower-level executives and employees are estimated by dividing the options granted to the proxy-named executives by the percentage of all options that are granted to the proxy-named executives. Under the disclosure rules after 2006, the SEC no longer requires companies to report the percentage of all option awards that went to the proxy-named executives, and therefore my estimates of grants across the company end in 2005.
108The 25% calculation simply sums the annual percentages in Figure 19. This calculation overstates the transfer of equity to the extent that some options are forfeited or expire worthless, and understates the transfer of equity to the extent that the overall base of shares expands as options are exercised or as the company offers additional shares.
109The average grant value is determined by dividing the total value of grants in each industry (after excluding grants to the top five executives) by the total number of employees in the industry.
110Indeed, it is easy to show that a traditional at-the-money stock option is equivalent to a non-recourse loan to purchase company stock at a zero interest rate with no down payment. Loans to purchase stock that carry a positive interest rate or require an executive down payment are less costly to grant than traditional options, and deliver better incentives by both forcing executives to invest some of their own money in the venture and only providing payouts when the stock price appreciates by at least the interest charged on the loan. It is unfortunate that Congress prohibited these types of plans.
111Offering housing subsidies in the form of loans that are forgiven with the passage of time is preferable to a lump-sum subsidy, since the company can avoid paying the full subsidy if the executive leaves the firm before the loan is repaid or fully forgiven.
112Technically, cashless exercise programs are implemented by offering the executive a short-term bridge loan to finance the purchase of the shares, followed by open-market transactions to sell some of the shares to repay the loan. Subsequent to Sarbanes-Oxley, executives exercising options have turned to conventional banks for bridge-loan financing, significantly increasing the transaction costs and further diluting the shares outstanding (since under company-maintained programs, the company need only issue the net number of shares and not the full number of shares under option).
113Plitch, “Paydirt: Sarbanes-Oxley A Pussycat On ‘Clawbacks’,” Dow Jones Newswires (2006), Bowe and White, “Record Payback over Options,” Financial Times (2007).
114Berman, “The Game: New Frontier For the SEC: The Clawback,” Wall Street Journal (2010), Korn, “Diebold to Pay $25 Million Penalty,” Wall Street Journal(2010).
115Key references include Lie (2005), Heron and Lie (2006b), Heron and Lie (2006a), Maremont, “Authorities probe improper backdating of options: Practice allows executives to bolster their stock gains; a highly beneficial pattern,” Wall Street Journal (2005), Forelle and Bandler, “Backdating probe widens as two quit Silicon Valley firm; Power Integrations Officials leave amid options scandal; 10 companies involved so far,” Wall Street Journal (2006), Forelle, “How Journal Found Options Pattern,” Wall Street Journal (2006), “Hot Topic: Probing Stock-Options Backdating,” Wall Street Journal(2006).
116If the amount of compensation the employee will receive under the grant or award is not based solely on an increase in the value of the stock after the date of grant or award (e.g. in the case of restricted stock, or an option that is granted with an exercise price that is less than the fair-market value of the stock as of the date of grant), none of the compensation attributable to the grant or award is qualified performance-based compensation. Internal Revenue Service, Section 1.162–27.
117Maremont, “Backdating Likely More Widespread,” Wall Street Journal(2009).
118Bray, “Former Comverse Official Receives Prison Term in Options Case,” Wall Street Journal (2007), “Fugitive Mogul’s Rent Coup,” New York Post (2009).
119Scheck and Stecklow, “Brocade Ex-CEO Gets 21 Months in Prison,” Wall Street Journal (2008).
120Egelko, “18 months for ex-Brocade CEO,” San Francisco Chronicle (2010).
121See Grant, Bandler and Forelle, “Cablevision Gave Backdated Grant To Dead Official,” Wall Street Journal (2006).
122Hechinger and Bandier, “In Sycamore Suit, Memo Points to Backdating Claims,” The Wall Street Journal (2006). The internal memo is available at Sycamore Networks (2001).
123See Lee, “Option lawsuit give up details: Shareholders suing Mercury Interactive over timing of grants,” San Francisco Chronicle (2007).
124The reporting requirements under Sarbanes-Oxley apply only to executive officers and directors, and there is evidence from SEC investigations that some companies continued backdating for lower-level employees subsequent to the August 2002. However, since grants to such employees are not publicly disclosed, it has not been possible to perform a comprehensive analysis of the practice.
125In the proxy disclosure rules in effect between 1993 and 2006, companies were required to report the expiration date for new grants, but not the grant date.
126Nicklaus, “Scandal left both sides sullied: Backdating undermined confidence, but some ‘good guys’ overreached,” St. Louis Post-Dispatch (2010).
127Ryst, “How To Clean Up A Scandal,” BusinessWeek.com (2006).
128Bebchuk, Grinstein, and Peyer (2010) show that CEOs receiving lucky grants (which they define as grants with exercise prices set at the lowest price during the grant month) have higher total compensation than CEOs without lucky grants.
129Wotapka, “Former CEO At KB Home Is Convicted,” Wall Street Journal (2010).
130Henning, “Behind the Fade-Out of Options Backdating Cases,” New York Times (2010).
131Barboza, “Enron’s Many Strands: Executive Compensation. Enron paid some, not all, deferred compensation,” New York Times (2002).
132IRS guidance has not been clear with respect to the amount subject to the additional 20% penalty. For example, Morrison and Foerster (http://www.mofo.com/news/updates/files/update02204.html) has advised its clients that the amount subject to the penalty could be any of the following:the difference between the exercise price and the fair market value of the stock subject to the option measured on the date of grant of the option;the difference between the exercise price and the fair market value of the stock subject to the option measured on the date the shares subject to the option vest;the difference between the exercise price and the fair market value of the stock subject to the option measured on the date of exercise;the Black-Scholes value of the option measured on the date of grant of the option; orthe Black-Scholes value of the option measured on the date the shares subject to the option vest.
133This section draws heavily from Murphy and Sandino (2010, 2012).
134Academic studies based on the first year of consultant disclosures – including Cadman, Carter, and Hillegeist (2010), Armstrong, Ittner, and Larcker (2012) and (early versions of) Murphy and Sandino (2010) – also documented significantly higher pay in companies using consultants.
135Solomon and Paletta, “US Bailout Plan Calms Markets, But Struggle Looms Over Details”, Wall Street Journal (2008).
136Hulse and Herszenhorn, “Bailout Plan Is Set; House Braces for Tough Vote”, New York Times(2008).
137Scannell, Rappaport, and Bravin, “Judge Tosses Out Bonus Deal—SEC Pact With BofA Over Merrill Is Slammed; New York Weighs Charges Against Lewis,” Wall Street Journal (2009).
138Fitzpatrick, Scannell, and Bray, “Rakoff Backs BofA Accord, Unhappily,” Wall Street Journal (2010).
139Andrews and Bajaj, “Amid Fury, US Is Set to Curb Executives’ Pay After Bailouts,” New York Times (2009).
140TARP recipients not considered exceptional assistance firms could waive the disclosure and Say-on-Pay requirements, but would then be subject to the $500,000 limit on compensation (excluding restricted stock).
141The number of executives covered by the Dodd Amendments varied by the size of the TARP bailout, with the maximum number effective for TARP investments exceeding $500 million. As a point of reference, the average TARP firm among the original eight recipients received an average of $20 billion in funding, and virtually all the outrage over banking bonuses have involved banks taking well over $500 million in government funds. Therefore, I report results assuming that firms are in the top group of recipients.
142For the record, I (along with Lucian Bebchuk from Harvard) served as academic advisors to Kenneth Feinberg, the Special Master. However, that the fact advice was given does not imply that it was followed.
143Holzer, “A ‘Yes’ In Say On Pay,” Wall Street Journal (2011b).
144“2012 Say on Pay Results” Semler Brossy Consulting Group, LLC. Accessed 8/6/2012 at www.semlerbrossy.com/sayonpay.
1452012 Fortune 100 Clawback Report, Equilar, Inc. August 2, 2012.
146Tse, “Shareholders Say Yes To Executive Pay Plans; Review Tracks Advisory Votes at TARP Firms,” Washington Post (2009). It is worth noting that shareholders voting in early 2009 were largely voting on 2008 compensation, before the implementation of the Dodd Amendments or the appointment of the Special Master.
147For critiques of the ISS methodology, see Wachtell-Lipton’s “Say on Pay 2012,” available at: http://blogs.law.harvard.edu/corpgov/2012/07/14/say-on-pay-2012/(accessed 8/6/2012).
148The 2009 SEC disclosure rules require companies to disclose the fees paid to executive compensation consultants for any work beyond executive compensation (e.g. actuarial work, benefits administration, employee pay, etc.), but offers a safe harbor (i.e. no disclosure requirement) when the committee retains their own independent consultant. Interestingly, Murphy and Sandino (2010) find that levels of CEO pay are significantly higher in firms with consultants working exclusively for the compensation committee.
149“Alinsky Wins at the SEC,” Wall Street Journal (2010).
150Holzer, “Corporate News: Court Deals Blow to SEC, Activists,” Wall Street Journal (2011a).
151This section draws heavily from Fernandes et al. (2013), Conyon et al. (2013).
152Single-country studies based on aggregate pay include Kaplan (1994) (Japan), Kato and Long (2005) (China), Fernandes (2008) (Portugal), and Kato, Kim, and Lee (2006) (Korea).
153Due to limitations with BoardEx data on CEO wealth for non-US CEOs, Fernandes et al. (2013) make simplifying assumptions beyond those in Section 2.1.2.
154Yermack (1995) shows that agency-theoretic variables have little explanatory value in predicting the use of equity-based compensation in a cross-section of US publicly traded firms.
155The limited number of countries in our sample (14) limits the statistical degrees of freedom for reliably identifying country-level determinants of pay practices.
156As discussed in Section 2.2.2, it is not leverage per se that creates risk-taking incentives, but rather the limited liability feature of equity. The severity of the risk-taking incentives depends on the maximum downside risk compared to the dollar amount of equity, and not the value of equity compared to the overall value of the firm.
157The optimal-contracting or principal-agent theory evolved contemporaneously to, but largely independent from, the agency-theory literature spawned by Jensen and Meckling (1976). Influential early theoretical work includes Ross (1973), Mirrlees (1976), Holmstrom (1979), Lazear and Rosen (1981), Holmstrom (1982), and Grossman and Hart (1983).
158See, for example, Efendi, Srivastava, and Swanson (2007), Burns and Kedia (2006), Bergstresser and Philippon (2006), Johnson, Ryan, and Tian (2009), and Erickson, Hanlon, and Maydew (2006).
159While it was relatively common for CEOs to sit on their own compensation committees, I am unaware of any instances where the CEO was actually allowed to vote on his or her individual compensation package.
160See, for example, Bebchuk and Fried (2003, 2004a, 2004b), Bebchuk, Grinstein, and Peyer (2010), Bebchuk, Fried, and Walker (2002), and Fried (1998, 2008a, 2008b).
161For example, Murphy (1999) observes that while “outside board members approach their jobs with diligence, intelligence, and integrity…judgment calls tend systematically to favor the CEO. Faced with a range of market data on competitive pay levels, committees tend to on the high side. Faced with a choice between a sensible compensation plan and a slightly inferior plan favored by the CEO, the committee will defer to management. Similarly, faced with a discretionary choice on bonus-pool funding, the committee will tend to over- rather than under-fund.”
162In September 1983, the SEC had reduced the amount of information companies needed to disclose on executive stock options. From 1978 to 1983, the “summary compensation table” in the proxy statement included not only cash compensation but also the number of new options granted and the increase in the intrinsic value of options held. Under the 1983 “paperwork reduction” rules, the summary compensation table included only cash compensation, the number of options granted was moved to later in the proxy, and information on outstanding options (and changes in the value of outstanding options) was eliminated. For details on the 1983 rules, see Hudson, “SEC Rules Allow Concerns to Curb Pay Disclosure: Companies Likely to Divulge Less on Executive Fees, Incentives, and Stock Options,” Wall Street Journal (1983).
163Zuckerman, Strasburg and Esterl, “VW’s 348% Two-Day Gain Is Pain For Hedge Funds,” Wall Street Journal (2008).
164The Top 500 are for all US-based firms in Compustat. Using the same methodology, I find that the average market value (including debt and equity) for the 500 largest US firms grew by 300% between 1980 and 2003, substantially less than the 500% alleged by Gabaix and Landier (2008). I am unable to reconcile the difference.
165For similar (but more general) derivations of the optimal pay-performance sharing råte, see Lazear and Rosen (1981), Holmstrom and Milgrom (1991), Gibbons and Murphy (1992), and Milgrom and Roberts (1992).
166Contracting models justifying the use of stock options rather than stock typically focus on optimal risk taking rather than (or in addition to) effort incentives (see, for example, Hirshleifer and Suh, 1992; Edmans and Gabaix, 2011.
167In contrast, Ittner, Lambert, and Larcker (2003) find that companies with greater cash flows use options more extensively.
168Indeed, Oyer (2004) should predict that stock options are a particularly ineffective substitute for downward adjustments in employment terms (presumably firms face fewer short-run costs of adjusting in employees’ favor).
169See, in particular, Murphy (2002, 2003) and Hall and Murphy (2003).
170In addition, as discussed in Section 3.7.6, under the pre-2003 listing requirements, companies did not need shareholder approval for options that would be issued broadly to executives and employees throughout the organization, but only for option grants that would be concentrated among the highest-level executives.
171See Amir (1993), Espahbodie, Strock, and Tehranian (1991) and Mittelstaedt, Nichols, and Regier (1995) for descriptions and analyses of FAS 106 (Employers’ Accounting for Postretirement Benefits Other than Pensions).
172In particular, the accounting expense for SARs reflected the appreciation in stock prices from the grant date through the exercise date.
173“US Senate backs resolution to remove option plan,” Reuters News (1994).
174“Clinton Enters Debate Over How Companies Reckon Stock Options,” Wall Street Journal (1993).