
Chapter 4
Executive Compensation: Where We Are, and How We Got There
Abstract
Keywords
Executive compensationCEO pay; Regulation; Disclosure; Stock options; Accounting; Corporate governance; Sarbanes-Oxley; Dodd–Frank; International Pay
JEL classification
G34; G38; J31; J33; J38; K22; K34; M12; M41; M48; M52
1 Introduction
The first decade of the new century brought significant changes to executive compensation in large US companies. Rocked by scandals ranging from accounting fraud to option backdating—coupled with suspicions that Wall Street bonuses led to excessive risk taking that triggered the financial crisis—compensation committees faced a plethora of new pay-related laws and tax, accounting, and disclosure rules designed to stem perceived abuses in executive pay. After more than tripling (after inflation) during the 1990s stock-option explosion, the median total pay for chief executive officers (CEOs) in the S&P 500 remained relatively stagnant in the early 2000s, and indeed even declined during the 2008–2009 Great Recession. But the flattening of pay levels belied significant structural changes in the composition of pay, as companies adapted to the new regulations and jettisoned stock options in favor of restricted stock. Moreover, realized pay for top-level executives was postured for a new explosion in the second decade of the 2000s, as stock and options granted near the bottom of the market in 2009 became vested and exercisable. These trends suggest the outrage over executive pay—recently reflected by the “Occupy Wall Street” movements and in calls from the Obama administration for increased tax rates for “millionaires and billionaires”—will likely continue unabated over the next several years.
The recent controversies over executive pay are not the first—nor will they be the last—time that executive compensation has sparked outrage and calls for regulation and reform. Indeed, scrutinizing, criticizing, and regulating high levels of executive pay has been an American pastime for nearly a century. In 1932, for example, controversies surrounding high salaries for executives in bailed-out railroads led to pay disclosures and pay caps; disclosure requirements were soon extended to banks, utilities, and large corporations, and further extended to all publicly traded companies following the 1933 and 1934 Securities Acts. Outrage over perceived excesses in “restricted stock option plans” in the 1960s led Congress to prohibit repricing, reduce maximum expiration terms, restrict exercise prices, and extend required holding periods after exercises. In the 1980s, Congress imposed large tax penalties on firms paying (and executives receiving) large severance payments following a change in control, and in the 1990s non-performance-based pay exceeding $1 million was deemed unreasonable and therefore not deductible as an ordinary business expense for corporate income tax purposes. Therefore, the recent backlash over executive pay associated with the accounting and backdating scandals and the financial crisis—triggering Sarbanes-Oxley, new disclosure and accounting rules, restrictions on deferred compensation, and myriad pay regulations under the Dodd–Frank Act—continues a tradition of regulatory responses to perceived excesses and abuses in top-level pay.
The purpose of this study is to document the current state of executive compensation and to show how the level and structure of CEO pay over the past century has evolved in response to economic, institutional, and political factors. My intention is not to provide a comprehensive survey of the academic literature on executive compensation (or even a systematic update of Murphy (1999)), but rather to document a body of facts to guide future theoretical and empirical research in the area. I show that government intervention into executive compensation—largely ignored by researchers—has been both a response to and a major driver of time trends in CEO pay. There have been two broad patterns for government intervention into CEO pay. The first pattern is aptly described as knee-jerk reactions to isolated perceived abuses in pay, leading to disproportionate “one-size-fits-all” responses and a host of unintended and undesirable consequences. The second pattern—best described as “populist” or “class warfare”—arises in situations where CEOs (and other top executives) are perceived to be getting richer when lower-level workers are suffering. Beyond these two broad patterns, indirect intervention in the form of accounting rules, securities laws, broad tax policies, and listing requirements have also had direct impact on the level and composition of CEO pay. In most cases, companies and their executives have responded to the interventions by circumventing or adapting to the reforms, usually in ways that increased pay levels and produced other unintended (and typically unproductive) consequences.
More broadly, this study provides institutional context useful in “explaining” time trends in the level and structure of CEO pay. As emphasized by Frydman and Jenter (2010) and explored below in Section 5, the academic literature focused on explaining these trends is roughly divided into two camps: the “efficient contracting” camp and the “managerial power” camp. The efficient-contracting camp—rooted in optimal contracting theory—maintains that the observed level and composition of compensation reflects a competitive equilibrium in the market for managerial talent, and that incentives are structured to optimize firm value. The managerial-power camp—exemplified in a series of papers by David Yermack, Lucian Bebchuk and Jesse Fried—maintains that both the level and composition of pay are determined not by competitive market forces but rather by captive board members catering to rent-seeking, entrenched CEOs. Frydman and Jenter (2010) conclude that neither camp offers convincing explanations for cross-sectional and time-series patterns in the data.
The efficient-contracting and managerial power camps are not mutually exclusive. For example, in a series of papers designed to explain the escalation in option grants in the 1990s, I have argued that stock options were granted in such large quantities to so many employees in the 1990s because boards and executives (erroneously) perceived options to be essentially free to grant.1 This explanation might be viewed as a combination of both camps: directors yielded to shareholder pressure to tie more closely to equity values, but were duped by managers into the idea that options were free to grant, thus leading to massive grants without any noticeable reductions in other forms of pay. However, as will become clear in Section 3.7 below, a more complete explanation must include the role of government: the option explosion in large part caused by changes to tax and accounting rules coupled with changes in disclosure, holding, and listing requirements.
In essence, the efficient-contracting camp views executive pay as mitigating agency problems between executives and shareholders, while the managerial-power camp views excessive pay as symptomatic of agency problems between shareholders and board members (who often own only a trivial fraction of their firm’s common stock and who are in no sense perfect agents for the shareholders who elected them). The reason government intervention into executive pay adds an important new dimension to the analysis is because the interests of the government differ significantly from those of shareholders, directors, or executives. In particular, as will become evident from the legislative history in Section 3 below, Congressional (and, more generally, public) outrage over executive pay is almost always triggered by perceived excesses in the level of compensation without regard to incentives and company performance, and the regulatory responses have also fixated on pay levels (albeit with little effect).
Limitations on the form of government intervention add another interesting dimension to the agency problem. In most circumstances, Congress has stopped short of directly capping the level of pay or imposing restrictions on its structure.2 However, Congress controls the tax code (including individual and corporate tax rates, punitive excise taxes, and defining what compensation is “reasonable” and therefore deductible by the company), and has routinely used tax rules to regulate pay. In addition, Congress (through its influence on the SEC) indirectly controls disclosure requirements, long the favorite (and singularly most ineffective) tool used to control perceived abuses in pay. Ultimately, attempts to regulate the level of pay through tax and disclosure rules (instead of direct pay caps) have allowed plenty of scope for circumvention and opportunism and other unintended consequences, often leading to the next round of scandals and government responses.
Section 2 (“Where We Are”) analyzes the level and structure of CEO pay packages, discusses measurement issues, explores 1970–2011 time trends and, more generally, serves as a primer on executive compensation. I distinguish between three different measures of total compensation: (1) grant-date pay (based on grant-date values for stock and options, and target values for bonuses); (2) realized pay (based on the vesting of stock awards and the gains from exercising options); and (3) risk-adjusted pay (expected pay from the perspective of risk-averse CEOs). I document the dramatic increase in CEO pay during the 1990s, driven primarily by an unparalleled escalation of stock option grants, and the flattening of pay during the early 2000s (as firms replaced option grants with stock awards). In addition, I provide 1992–2011 time-series evidence on the relation between CEO wealth and shareholder wealth and stock-price volatilities, and discuss incentive issues related to bonus plans and earnings announcements.
Section 3 (“How We Got There”) provides a history of CEO pay in the United States, emphasizing the causes and consequences of government interventions, which have substantially prohibited what would otherwise be highly desirable and productive pay practices. I begin by examining the controversies leading to the first public disclosures of executive pay in the 1930s, which in turn laid the groundwork for all future controversies of, and interventions into, US CEO pay. I document the rise and fall of restricted stock options in the 1950s, created and ultimately destroyed by changes in tax rules. I discuss how wage-and-price controls and a stagnant stock market facilitated an explosion in perquisites in the 1970s; the surrounding controversy led to new tax and disclosure rules (but did not seem to lead to a reduction in perquisites). I show how penalties on golden parachutes in the 1980s appear to have increased the prevalence of change-in control plans; tax gross-ups, early exercise of stock options, and employment agreements. While the increase in option grants in the 1990s in part reflected increased pressure from shareholders to tie CEO pay more closely to performance, I show that the option explosion is largely attributed to tax, accounting and disclosure rules coupled with changes in holding and listing requirements that favored stock options over other forms of incentive compensation. Next, I speculate that the increased reliance on options helped fuel the accounting and backdating scandals in the early 2000s, which in turn led to a variety of government responses and subsequent changes in compensation (including the move towards restricted stock). I then discuss the pay restrictions for recipients of government bailouts during the financial crisis. Finally, I discuss the ongoing implementation of the Dodd–Frank Act.
Section 4 provides international comparisons of CEO pay, based largely on my joint work with Nuno Fernandes, Miguel A. Ferreira, and Pedro Matos (Fernandes et al., 2012). Based on recently available data from 14 countries with mandatory pay disclosures—we show that the stylized fact that US CEOs earn substantially more than foreign CEOs is wrong, or at least outdated. In particular, the “US Pay Premium” became statistically insignificant by 2007 and largely reflects a risk premium for stock-option compensation (which remains more prevalent in the United States than in other countries). In reaching this conclusion, we control not only for the “usual” firm-specific characteristics (e.g. industry, firm size, volatility, and performance) but also for governance characteristics that systematically differ across countries. The remaining differences in pay are largely explained by evolutionary differences in the politics of pay. In particular, Section 3 showed that CEO pay reflects, in part, political responses to perceived (or actual) abuses in pay. Since those perceived abuses differ across countries, the evolution of pay has also differed. For example, CEO pay became highly controversial in both the United States and the United Kingdom in the early 1990s. In the United States, the (likely unintended) result of the controversy was the explosion in stock option grants. In the United Kingdom, the result of a slightly different controversy was to essentially move away from options in favor of performance shares and other forms of equity-based compensation.
Section 5 uses the results in the prior sections to suggest a general theory of executive compensation. I argue that viewing efficient contracting and managerial power as competing hypotheses to “explain” executive compensation has not been productive, since the hypotheses are not mutually exclusive and because they ignore critical political factors and other influences on pay. Ultimately, what makes CEO pay interesting, complicated, and worthy of continued investigation is that the paradigms co-exist and interact.
2 Where We are: A Primer on Executive Compensation
2.1 Measuring Executive Pay
Underlying every intra-firm, cross-sectional, cross-country, or time-series analysis of executive compensation is an assumption (too often implicit) about how to measure the total compensation received by the executives. If executives were simply paid a base salary set at the beginning of each year, it would be easy to compare salaries across executives (within a firm or across firms, industries, and countries) to identify the highest paid, to compare salaries across years to determine how pay has changed over time, and to compare executive salaries to wages paid in other occupations. But consider the following:
• Executives receive compensation in a dizzying array of forms, including base salaries, annual bonuses, long-term incentives, restricted stock, performance shares (i.e., restricted stock with performance-based vesting), stock options, retirement benefits, and perquisites ranging from health benefits to club memberships and personal use of the corporate jet.
• Many of these forms of compensation depend on performance measured over a single or multiple years, and it is not obvious how (or when) to measure them. For example, stock options (which give the executive the right, but not the obligation, to buy a share of stock at a predetermined price) typically have terms of up to ten years. Should stock options be “counted” as compensation when granted, or only when exercised?
• In addition, executives routinely receive lump-sum amounts at various points in time, such as signing bonuses when joining their firms, severance payments upon termination, and change-of-control payments when their companies are taken over. Moreover, some payments “earned” while employed (such as defined-benefit pension obligations) are not paid until long after the executive is retired and his compensation is no longer reported (or sometimes paid as a lump-sum upon retirement). Again, it is not obvious how, or when, to measure these aspects of compensation.
• Finally, different components of compensation impose different amounts of risk on executives. The payoffs from stock options, for example, are inherently more risky than are payoffs from restricted stock, which in turn are more risky than base salaries. Risk-averse and undiversified executives will naturally place a lower value on riskier forms of compensation, and yet most studies of executive pay simply (and blindly) add together these different forms of compensation. The “risk premia” that executives attach to different forms of compensation depend on unobservable characteristics such as risk aversion and diversification, and it is not obvious how to add or how to weight the various components.
2.1.1 “Grant-Date” vs. “Realized” Pay
While the ultimate value of stock awards and stock options is not known until the stock vests and the options are exercised, these equity awards clearly have a value upon grant. Perhaps the most critical choice facing researchers in executive compensation is whether to measure the compensation associated with equity awards as the amount actually realized upon vesting and exercise, or to assign an “ex ante” grant-date value. Most academic research on executive compensation since the mid-1980s has adopted the ex ante approach, valuing stock awards as the fair market value on the date of grant (i.e. the grant-date stock price multiplied by the number of shares granted), and valuing stock options on the grant date using some variant of the Black and Scholes (1973) formula.
When total compensation is measured using grant-date values, it is routinely referred to as expected compensation to distinguish it from realized compensation as measured at the time the stock vests and the options are exercised.3 However, calling the grant-date pay “expected” is somewhat loose:
• For restricted shares (i.e. shares to be delivered at a future point in time), the grant-date stock price is the discounted expected value only if there are no performance hurdles, no dividends (or if the executive receives dividends on restricted shares, which is common) and only if there is no risk of forfeiture (i.e. no risk that the employment relation is terminated by either party prior to vesting).
• For stock options, the Black–Scholes value is the discounted expected payoff of a non-forfeitable European option for an executive who can perfectly hedge away the risk of the option (or, alternatively, the expected payoff under the risk-neutral distribution discounted at the risk-free rate).
• As discussed below in Section 2.1.2, the grant-date value (for either stock or option awards) is not a measure of value from the perspective of risk-averse undiversified executives who cannot hedge away the risk. However, with appropriate adjustments for dividends, forfeiture, dilution, and (for options) early exercise, the grant-date value can be an appropriate estimate of the cost to the company of granting restricted stock or options.
Similarly, bonus plans have a “grant-date value” typically measured as the target bonus, paid when the company achieves (usually accounting-based) target performance. However, even when target performance equals expected performance, the target bonus is only the “expected bonus” when the rewards and penalties for surpassing or missing targets are symmetric.
To illustrate the distinction between grant-date and realized pay, suppose that a CEO’s compensation in 2010 and 2011 consisted of a salary of $500,000 paid each year, and 50,000 shares of restricted stock awarded at the beginning of 2010 that become non-forfeitable (“vest”) at the end of 2011. Suppose further that the company’s stock price rose from $10 to $30 over the course of these two years. This CEO’s grate-date pay (which includes the grant-date value of the restricted stock) was $1000,000 in 2010 (consisting of the 2010 $500,000 base salary and the unvested stock with a grant-date value of $500,000) and the 2011 salary of $500,000. But, his realized pay (consisting of his base salary plus the amount realized upon vesting) was $500,000 in 2010 and $2000,000 in 2011 ($500,000 in base salary plus $1500,000 from the vesting of his stock at the end of 2011).
Grant-date and realized pay are both legitimate measures of CEO compensation and each is a legitimate answer to a different question. Compensation committees evaluating the competitiveness of their CEO pay package at the beginning of the year (that is, before performance results are tallied) should focus on grant-date pay levels. In contrast, realized pay levels will (by definition) depend on the company’s current and past performance, and are therefore most useful in evaluating whether ultimate rewards have been commensurate with company performance.
The distinction between grant-date and realized pay is also critical for researchers estimating the link between pay and performance. For example, researchers beginning with (I confess, reluctantly) Murphy (1985) have assessed the relation between pay and performance by regressing total grant-date compensation on measures of corporate performance (using CEO fixed-effects or first-differences to control for unobservable factors affecting pay levels). However, consider two otherwise identical executives, the first paid $1 million annually in base salary and the second paid $1 million annually in restricted shares. Researchers regressing grant-date pay levels on performance would conclude that neither executive is paid for performance, when in fact the second CEOs realized pay is strongly related to performance.
The SEC has helped confuse the distinction between grant-date and realized compensation by conflating elements of each in the “Summary Compensation Table” required in corporate proxy statements. In particular, since 2009, the SEC has required companies to report the grant-date fair-market values of stock and option grants in the Summary Compensation Table, while at the same time reporting the realized (rather than target) payouts from non-equity-based bonus plans. In addition, the SEC rules are particularly confusing for companies that pay annual bonuses partly in cash and partly in stock and options, as is common in financial services. As an example, suppose that a CEO receives a bonus of $10 million in January 2012 for performance in 2011, and that $4 million is paid in cash and the remaining $6 million in stock and options. According to SEC rules, the $4 million cash bonus is included as part of 2011 compensation (and reported in the firm’s 2012 proxy statement), while the $6 million bonus paid in the form of stock and options is included as part of 2012 compensation (and not reported until the firm’s 2013 proxy statement).
Adding to the confusion between grant-date and realized pay was the (thankfully temporary) existence of a third measure mandated by the SEC and included in the Summary Compensation Table in proxy statements issued between 2007 and 2009 (covering compensation paid between 2006 and 2008). Under the SEC’s 2007–2009 reporting requirements, “SEC Total Compensation” included the accounting expense the company records for stock and options during the year under Financial Accounting Standard 123R (FAS 123R) discussed below in Section 3.8.4. Using the accounting expense for valuing options instead of the grant-date value of options was a last-minute change to the reporting requirements made by the SEC in December 2006 without public comment. Under the SEC approach that mandates the use of accounting numbers in the table, the grant-date value of the $500,000 grant vesting in two years is reported as $250,000 in the grant year and $250,000 in the following year—numbers that bear no meaningful economic relationship to anything in the system. Fortunately, the confusion was relatively short-lived: in late 2009 the SEC revised its disclosure rules to include grant-date values rather than annual accounting expenses in the summary pay table.
Another element of the confusion in describing the typical CEO pay package reflects the statistical distinction between averages and medians. Suppose, for example, that there are eleven CEOs in an industry, ten receiving compensation of $1 million and the eleventh receiving $12 million. The average compensation in this industry is $2 million (calculated by summing all compensation amounts and dividing by 11), while the median is only $1 million (calculated as the compensation where half the CEOs are paid more and half the CEOs are paid less). Average and median pay are, again, both legitimate measures of CEO pay, but are answers to different questions. Average pay is relevant in assessing aggregate levels of pay (a reader can multiply the average pay by the number of CEOs and get total compensation paid to all CEOs), while median pay is more relevant in describing compensation for a “typical” CEO.
Figure 1 illustrates the 2011 grant-date and realized compensation for CEOs in firms listed in Standard and Poors S&P 500 (essentially the largest 500 US firms ranked by market value). The data are based on proxy statement information reported in Standard & Poors’ ExecuComp database for the 465 S&P 500 firms.4 For both measures, total compensation is comprised of six basic components: (1) base salaries; (2) discretionary bonuses; (3) non-equity incentives (based on both annual and multi-year performance measures); (4) stock options; (5) stock awards; and (6) other pay.5 Base salaries and the payouts from discretionary (non-formulaic) bonuses are the same for both grant-date and realized total compensation. However, the definitions of the remaining pay components vary with the measure utilized.

Figure 1 2011 pay for CEOs in S&P 500 companies. Note:Figure 1 is based on proxy statement information compiled in Standard & Poors’ ExecuComp database for 465 S&P 500 firms with fiscal closings between June 2011 and May 2012, based on ExecuComp’s May 2012 update. Grant-date Pay: Base Salary and Discretionary Bonus reflects amounts actually received for the fiscal year. Non-Equity Incentives evaluated at target level (or average of minimum and maximum if target not reported). Stock Options evaluated at grant-date using firm-estimated present value (typically Black and Scholes (1973) calculations). Stock Awards evaluated at grant-date using firm-estimated present value (typically grant-date market price), including both time-lapse restricted stock and performance shares. Other Compensation includes perquisites, signing bonuses, termination payments, above-market interest paid on deferred compensation, and the change in the actuarial value of pension benefits. Realized Pay: Base Salary and Discretionary Bonus reflects amounts actually received for the fiscal year. Non-Equity Incentives defined as payouts during the fiscal year (including payouts on awards made in prior years). Stock Options defined as gains executive realized by exercising options during the fiscal year. Stock Awards defined as value of awards vesting during the fiscal year (valued on the date of vesting). Other Compensation includes perquisites, signing bonuses, termination payments, above-market interest paid on deferred compensation, and pension benefits paid during the year. The pay-composition percentages for Average Compensation are calculated as the average ratio of each component to total compensation for each CEO. The composition percentages for Median Compensation are calculated as the median ratio of each component: median ratios do not sum to 100% (because the sum of the medians is not the median of the sum).
For grant-date pay, non-equity incentives are evaluated at the target level of payout (or, calculated as the average of the minimum and maximum payout if the target is not reported).6 The grant-date value of stock options is defined as the company’s estimate of the present value of the options on the grant-date: this value is typically based on Black and Scholes (1973) or similar methodologies and approximates the amount an outside investor would pay for the option. Similarly, the grant-date value of stock awards is calculated as of the grant date using the grant-date market price, which in turn approximates the amount an outside investor would pay for the stock. “Other compensation” includes perquisites, signing bonuses, termination payments, and above-market interest paid on deferred compensation. In addition, “other compensation” includes the change in the actuarial value of pension benefits, which typically constitutes a large percentage of compensation for those executives with supplementary defined-benefit pension plans.7
For realized pay, non-equity incentives are defined as actual payouts during the fiscal year, including both amounts paid in formula-based annual bonus plans, and current-year payouts from longer-term plans. Stock options are calculated as the gains realized by exercising options during the year, and stock awards are calculated as the value of the stock (or other equity instruments) as of the vesting date. Other compensation includes perquisites, signing bonuses, termination payments, above-market interest paid on deferred compensation, and the actual payments made to the CEO during the year under pension or retirement plans.
The first two columns in Figure 1 depict average grant-date and realized compensation. The pay-composition percentages are constructed by first calculating the composition percentages for each CEO, and then averaging across CEOs. The average grant-date CEO Pay in S&P 500 firms in 2011 was $11.6 million, compared to average realized pay of $12.3 million. Stock awards are the largest single component of both grant-date and realized pay in 2011. The “Other Pay” component of grant-date pay is large compared to the corresponding component for realized pay, reflecting that the definition of grant-date pay includes the (generally positive) change in the actuarial present value of pension benefits during the year. In contrast, the realized pay for pensions include only pension benefits paid during the year for proxy-named executives (which excludes amounts to be paid after retirement).
The remaining two columns in Figure 1 depict median compensation. The composition percentages for median pay are calculated as the median ratio of each component: median ratios do not sum to 100% (because the sum of the medians is not the median of the sum). Median compensation is typically lower than average pay, since a small number of very-highly paid CEOs will increase the average pay but not the median pay. For example, ConocoPhillips’s CEO James Mulva realized $141 million through exercising stock options in 2011. If the options had not been exercised, his pay would have fallen to “only” $5.3 million, and the average realized compensation for the 465 executives in Figure 2.1 would fall $303,000 from $12.436 million to approximately $12.133 million. Equity awards for the median executive are dominated by stock (rather than option) awards, and together option and stock awards comprise about half of total compensation for the typical executive.
The difference between grant-date and realized values, and averages and medians, is especially pronounced for stock options. Figure 2 shows the average and median grant-date values and exercise gains (i.e. realized values) for stock options granted to or exercised by CEOs in S&P 500 firms from 1992 to 2011. As shown in the figure, the average grant-date values (dotted line) and exercise gains (solid line) were remarkably similar leading up to the 2000 burst in the Internet bubble. In contrast, average exercise gains increased while average grant-date values fell leading up to the 2008 financial crisis, reflecting the shift in grants primarily reflecting the shift from options to restricted stock described in more detail below.
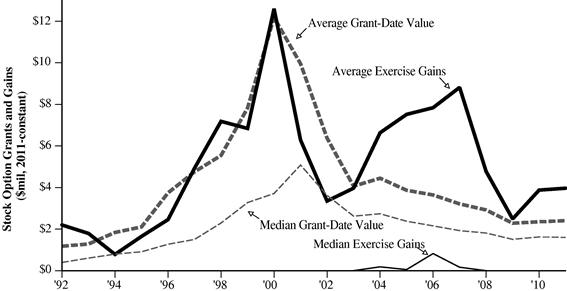
Figure 2 Average and Median Stock Option Grant-Date Values and Exercise Gains for CEOs in S&P 500 Firms, 1992–2011. Note: Grant-date values based on company fair-market valuations, when available, and otherwise based on ExecuComp’s modified Black–Scholes approach. Dollar amounts are converted to 2011-constant dollars using the Consumer Price Index.
Figure 2 shows that median grant values and exercise gains were always below their respective averages. Interestingly, the median exercise gain was zero except for in the 2004–2007 period, indicating that less than half of the S&P 500 CEOs exercised options during most years in the sample (including 2000, when the average gain across all S&P 500 CEOs exceeded $12 million).8
Figure 3 shows how average grant-date pay for CEOs has evolved from 1970 to 2011. The data are adjusted for inflation and are based on information extracted from annual Forbes surveys (1970–1991) and Standard & Poors ExecuComp Database (1992–2011).9 Non-equity pay includes base salaries, payouts from short-term and long-term bonus plans, deferred compensation, and benefits. Total compensation includes non-equity compensation plus equity-based compensation, including the grant-date values of stock options and restricted stock.10 Due to changing reporting requirements and data availability some of the estimates of grant-date compensation are approximations, but the trends depicted in Figure 3 are nonetheless historically representative. As shown in the figure, average grant-date compensation increased from about $1.1 million in 1970 to $10.9 million in 2011, down from a peak of $18.2 million in 2000.11 Finally, the figure shows that most of the growth in CEO pay since 1990 is explained by the growth in equity-based pay. Indeed, stock and options constituted only a trivial percentage of pay in the early 1970s, and grew to be the dominant form of pay by the late 1990s.
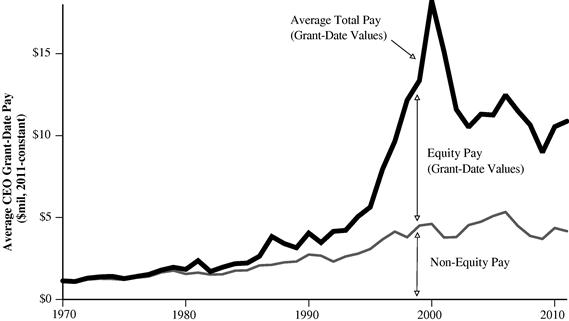
Figure 3 Average Equity and Non-equity Grant-Date Pay for CEOs in S&P 500 Firms, 1970–2011. Note: Compensation data are based on all CEOs included in the S&P 500, using data from Forbes and ExecuComp. CEO total pay includes cash pay, restricted stock, payouts from long-term pay programs and the value of stock options granted (using company fair-market valuations, when available, and otherwise using ExecuComp’s modified Black–Scholes approach). Average (median) equity compensation prior to 1978 estimated based on option compensation in 73 large manufacturing firms (based on Murphy (1985)), equity compensation from 1979 through 1991 estimated as amounts realized from exercising stock options during the year, rather than grant-date values. Non-equity incentive pay is based on actual payouts rather than targets, since target payouts were not available prior to 2006. Dollar amounts are converted to 2011-constant dollars using the Consumer Price Index.
Figure 4 shows how both the composition and level of grant-date pay evolved from 1992 to 2010. Because of the skewness in the pay distribution (where a small number of CEOs receive unusually high levels of compensation), the median pay in Figure 4 is significantly lower than the average pay in Figure 3 in each year. The pay-composition percentages in the figure are constructed by first calculating the composition percentages for each CEO, and then averaging across CEOs. As evident from the figure, underlying the growth in pay for CEOs since the 1990s is an escalation in stock-option compensation from 1993 to 2001 coupled with a dramatic shift away from options towards restricted stock from 2002 to 2011. In 1992, base salaries accounted for 41% of the $2.9 million median CEO pay package, while stock options (valued at grant-date) accounted for 25%. By 2001, base salaries accounted for only 18% of the median $9.2 million pay, while options accounted for more than half of pay. By 2011, options fell to only 21% of pay, as many firms switched from granting options to granting restricted stock (which swelled to 36% of pay).

Figure 4 Median Grant-date Compensation for CEOs in S&P 500 Firms, 1992–2011. Note: Compensation data are based on all CEOs included in the S&P 500, using data from ExecuComp. CEO grant-date pay includes cash pay, payouts from long-term pay programs, and the grant-date value of stock and option awards (using company fair-market valuations, when available, and otherwise using ExecuComp’s modified Black–Scholes approach). Monetary amounts are converted to 2011-constant US dollars using the Consumer Price Index.
In interpreting the time-series in Figure 4, it is important to recognize the selection bias inherent in the S&P 500. In particular, the firms in the index are selected by a committee based primarily on market capitalization and industry representation. For example, during the 1990s the S&P 500 increased its representation of “new economy” firms, as these firms became more highly valued and a more important component of the economy.12 Indeed, the fraction of the S&P 500 comprised of new economy firms grew from 5.5% in 1992 to over 12% in 2001 (and remained at about 11% for the rest of the sample period). Since new economy firms have traditionally relied on stock options as a major component of pay (see Murphy, 2003), the increase in both the level of pay and the use of options in Figure 4 in part reflects changes in the composition of the S&P 500.
Figure 5 replicates Figure 4 after restricting the sample to only firms included in the S&P 500 in 1992. This sample restriction attenuates the increase in pay levels, which increased by 165% from 1992 to 2000 (instead of 220% as in Figure 4). The figure also suggests that CEO pay continued to increase until 2007 (a starkly different pattern than suggested by Figure 4). However, while Figure 5 mitigates the S&P 500 selection bias in Figure 4, it is subject to a survivor bias: only half of the S&P 500 firms in 1992 were still publicly traded in 2011.

Figure 5 Median Grant-date Compensation for CEOs in Firms Included in the 1992 S&P 500 Note: Compensation data are based on all CEOs included in the 1992 S&P 500, using data from ExecuComp. The sample size varies from 472 in 1992 to 260 in 2011. CEO grant-date pay includes cash pay, payouts from long-term pay programs, and the grant-date value of stock and option awards (using company fair-market valuations, when available, and otherwise using ExecuComp’s modified Black–Scholes approach). Monetary amounts are converted to 2011-constant US dollars using the Consumer Price Index.
While the analysis in this chapter will generally focus on S&P 500 companies, Figure 6 shows the evolution of the level and compensation for CEO pay below the S&P 500. The data, extracted from ExecuComp, include firms in the S&P MidCap 400, S&P SmallCap 600, and a small number of other firms tracked by S&P. As evident by comparing Figures 4 and 6, the level of CEO pay below the S&P 500 is considerably smaller than pay levels for S&P 500 CEOs. In addition, while median pay for S&P 500 CEOs has more than tripled from 1970–2010, pay for CEOs below the S&P 500 merely doubled. Similar to their S&P 500 counterparts, restricted stock has replaced stock options as the primary form of equity-based compensation.

Figure 6 Median Grant-date Compensation for CEOs in non-S&P 500 Firms, 1992–2011. Note: Compensation data are based on all CEOs included in the S&P MidCap 400, SmallCap 600, and a small number of other non-S&P 500 firms tracked by S&P and included in the ExecuComp database. CEO grant-date pay includes cash pay, payouts from long-term pay programs, and the grant-date value of stock and option awards (using company fair-market valuations, when available, and otherwise using ExecuComp’s modified Black–Scholes approach). Monetary amounts are converted to 2011-constant US dollars using the Consumer Price Index.
2.1.2 The “Cost” vs. the “Value” of Incentive Compensation
In constructing measures of total compensation, it is important to distinguish between two often confused but fundamentally different valuation concepts: the cost to the company of granting the compensation and the value to an executive of receiving the compensation. Consider, for example, a company that decides to give a share of restricted stock to its CEO vesting in five years (that is, the CEO is restricted from selling the share of stock for five years, and receives the accumulated dividends [plus interest] upon vesting). Suppose further that the market price of a share of stock is $10. The economic or opportunity cost of the stock grant to the company is the amount the company could have received if it were to sell an unrestricted share to an outside investor rather than giving the restricted share to the CEO. Ignoring the probability of forfeiture and the slight dilution discount associated with issuing a new share, the company could raise $10 by selling the share to an outside investor. Thus, the company’s cost of granting the share is the price of the share on the open market.
Alternatively (but equivalently), by granting the restricted share to the CEO, the company is effectively promising to deliver one share of stock to the CEO in five years. If the company had no shares available to issue, it could satisfy this contract by purchasing a share on the open market in five years at a price that might be higher or lower than $10. If the company wanted to perfectly hedge the “price risk” of its future obligation, it could purchase a share of stock in the open market today (for $10) and deliver it to the CEO in five years. Thus, again, the company’s cost of granting the share is simply the price of the share on the open market.
But, what about the CEO? The CEO would clearly prefer to have $10 today than a promise to receive one share of stock in five years; after all, he could always take the $10 and buy a share of stock today, but will likely have other more-preferred uses for the $10. Moreover, if the CEO is risk averse and undiversified (in the sense that his overall wealth is positively correlated with company stock prices, through existing stock ownership, option holdings, and the risk of being fired for poor performance), the value the CEO places on the share of restricted stock will be strictly less than the fair market value of the share. Note that the CEO’s value will predictably decrease as the CEO becomes more risk averse or less diversified.
Similarly, suppose that the company decides to give the CEO an option to buy a share of stock at a predetermined exercise price. The opportunity cost of granting the option is the amount an outside investor would pay for it. The outside investor is generally free to trade the option, and can also take actions to hedge away the risk of the option (such as short-selling the underlying stock). Black and Scholes (1973) and Merton (1973) demonstrated that, since investors can hedge, options can be valued as if investors were risk neutral and all assets appreciate at the risk-free rate. This risk-neutrality assumption forms the basis of option pricing theory and is central to all option pricing models, including binomial models, arbitrage pricing models, and Monte Carlo methodologies. Ignoring dilution, forfeiture, and early exercise, these now-standard methodologies provide reasonable estimates of what an outside investor would pay, and therefore measure the company’s cost of granting options.
Measures of opportunity cost that ignore dilution, forfeiture, and early exercise will systematically overstate the company’s cost of granting options. Dilution reduces the cost of granting options because companies typically issue new shares when options (technically, warrants) are exercised. While the impact of dilution on any specific option grant is typically immaterial, the impact can be significant when added across all employees receiving options. Forfeiture reduces the cost because executives typically forfeit some or all of their unexercisable options upon resignation or termination.13 Most importantly, Ballowing executives to exercise options before they expire reduces the company’s cost of granting options because risk-averse employees—seeking diversification and liquidity—predictably exercise non-tradable options sooner than would an outside investor holding a tradable option.
However, even after appropriate adjustments for dilution, forfeiture, and early exercise, Black–Scholes values do not measure the value of the non-tradable option to a risk-averse executive. In contrast to outside investors, company executives cannot trade or sell their options, and are also forbidden from hedging the risks by short-selling company stock. In addition, while outside investors tend to be well-diversified (holding small amounts of stock in a large number of companies), company executives are inherently undiversified, with their physical as well as human capital invested disproportionately in their company. For these reasons, company executives will generally place a much lower value on company stock options than would outside investors.
Lambert, Larcker, and Verrecchia (1991) and Hall and Murphy (2002) propose measuring the value of a non-tradable option to an undiversified risk-averse executive as the amount of riskless cash compensation the executive would exchange for the option.14 Suppose that an executive has non-firm-related wealth of w, holds a portfolio S(·) of company shares and options, and is granted n options to buy n shares of stock at exercise price X in T years. Assuming that w is invested at the risk-free rate, rf, and that the realized stock price at T is PT, the executive’s wealth at time T is given by
![]() (1)
(1)
If, instead of the option, he were awarded V in cash that he invested at the risk-free rate, his wealth at time T would be:15
![]() (2)
(2)
Assuming that the executive’s utility over wealth is U(W), we can define the executive’s value of n options as the “certainty equivalent” V that equates expected utilities (1) and (2):
![]() (3)
(3)
Solving (3) numerically requires assumptions about the form of the utility function, U(W), and the distribution of future stock prices, f(PT). I follow Hall and Murphy (2002) in assuming that the executive has constant relative risk aversion ρ, so that ![]() when ρ = l, and
when ρ = l, and ![]() when
when ![]() . I adopt the Capital Asset Pricing Model (CAPM) and assume that the distribution of stock prices in T years is lognormal with volatility σ and expected value equal to
. I adopt the Capital Asset Pricing Model (CAPM) and assume that the distribution of stock prices in T years is lognormal with volatility σ and expected value equal to ![]() , where β is the firm’s systematic risk and rm is the return on the market portfolio.16
, where β is the firm’s systematic risk and rm is the return on the market portfolio.16
Calculating certainty equivalents from (3) requires data on stock and option grants and holdings (available from corporate proxy statements17), and also requires unobservable data on executive “safe wealth” (i.e. wealth not correlated with company stock prices) and executive risk aversion. Following Hall and Murphy (2002), I assume that CEOs have relative risk-aversion parameters of 2 or 3, and that each CEO has “safe wealth” equal to the greater of $5 million (in 2011-constant dollars) or four times the current cash compensation.18 For other inputs, I assume a market risk premium of 6.5%, set the risk-free rate to the yield on 7-year US Treasuries, estimate dividend yields as the average yield over the past 36 months and volatilities based using the last 48 months of stock returns. Dividend yields above 5% are set to 5%, while volatilities below 20% or above 60% are set to 20% and 60%, respectively. As a simplifying assumption, I assume that the term for all options and restricted stock grants equals the term on the largest option grant (or five years if no options are granted), and assume that the executive’s prior holdings of stock and options are fixed throughout the term of the new grants. Finally, I assume (somewhat arbitrarily) that the risk-adjusted value of accounting-based bonuses is worth 90% of target bonuses.
Figure 7 shows the 1992–2011 evolution of risk-adjusted pay for CEOs in S&P 500 firms, assuming constant relative risk aversion of 2 or 3. The bar height depicts median pay without risk adjustments from Figure 4. Several features of the figure are worth noting:
• The value of compensation from the perspective of risk-averse undiversified CEOs can be substantially less than the cost of compensation reported in company proxy statements. For example, in 2001 (at the peak of the use of stock options), the median risk-adjusted pay for CEOs with constant relative risk aversion of 3 ($2.6 million) was less than one third of the median reported pay ($9.3 million).
• While reported pay levels increased significantly between 1998 and 2001 (driven primarily by the escalation in the grant-date values of stock options), risk-adjusted pay actually fell over this time period as a larger percentage of pay was being delivered in the form of risky stock options.
• Similarly, while reported pay levels were relatively flat from 2002 to 2007, risk-adjusted pay grew substantially as risky stock options were increasingly replaced by less-risky stock awards.
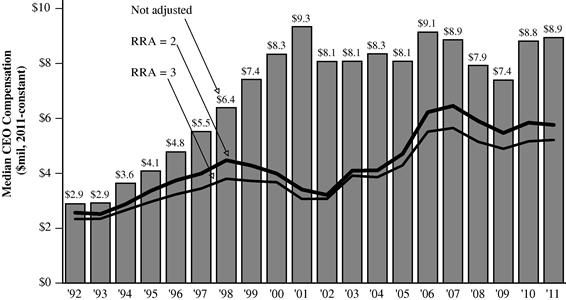
Figure 7 Median Risk-Adjusted Pay for CEOs in non-S&P 500 Firms, 1992–2011. Note: Risk-adjusted pay is estimated using the “certainty equivalence” approach, estimated numerically assuming that the executive has constant relative risk aversion (rra) of 2 or 3, and assuming (using the Capital Asset Pricing Model) that the distribution of stock prices over the actual term of the options granted is lognormal with volatility σ and expected value ![]() , where σ and β are determined using monthly stock-return data over 48 months, rf is the country-specific average yield on government securities during the year of grant, and
, where σ and β are determined using monthly stock-return data over 48 months, rf is the country-specific average yield on government securities during the year of grant, and ![]() is the market risk premium. assuming relative risk aversion of 2 or 3; safe wealth is assumed to be the greater of $5 million or four times total compensation (in 2011-constant dollars). The risk-adjusted value of accounting-based bonuses is assumed to be worth 90% of actual bonuses.
is the market risk premium. assuming relative risk aversion of 2 or 3; safe wealth is assumed to be the greater of $5 million or four times total compensation (in 2011-constant dollars). The risk-adjusted value of accounting-based bonuses is assumed to be worth 90% of actual bonuses.
The qualitative results in Figure 7 are robust to alternative definitions of risk aversion, safe wealth, equity premiums, and option terms. Calculating more precise estimates of risk-adjusted compensation for individual CEOs requires unavailable data on outside wealth and unobservable measures of individual risk aversion. In addition, more-precise estimates should allow CEOs to invest outside wealth in the market portfolio (Cai and Vijh, 2005) and allow for early exercise and different vesting and exercise terms of current grants and existing holdings. Nonetheless, the results in Figure 7 highlight that inferences based on reported grant-date compensation do not necessarily extend to risk-adjusted compensation.
2.2 Measuring Executive Incentives
Conceptually, the incentives created by any compensation plan are determined by two factors: (1) how performance is measured; and (2) how compensation (or wealth) varies with measured performance. Most of the executive compensation literature has focused on the relation between CEO and shareholder wealth (or, what Jensen and Murphy (1990b) defined as the “pay-performance sensitivity”), where CEOs with higher pay-performance sensitivities are defined as having better incentives to create shareholder value. Therefore, I begin this section with an analysis of different ways to measure the incentives that executives have to increase shareholder wealth. Next, given the recent focus on excessive risk-taking which many believe contributed to the financial crisis, I consider two measures of the incentives that executives have to increase stock-price volatilities. Finally, I discuss a variety of other incentive problems not neatly encapsulated in pay-performance or pay-volatility sensitivities, such as incentives to smooth or manage earnings or to pursue short-run profits at the expense of long-run value.
2.2.1 The Relation Between CEO and Shareholder Wealth
Most research on CEO incentives has been firmly (if not always explicitly) rooted in agency theory: compensation plans are designed to align the interests of risk-averse self-interested CEOs with those of shareholders. Following this framework, most of the focus has been on the relation between CEO compensation (or CEO wealth) and changes in firm value. Researchers have often used the ratio of equity-based total compensation to total compensation as a measure of incentives. However, the most direct linkage between CEO and shareholder wealth comes from the CEO’s holdings of stock, restricted stock, and stock options. CEO wealth is also indirectly tied to stock-price performance through accounting-based bonuses (reflecting the correlation between accounting returns and stock-price performance), through year-to-year adjustments in salary levels, target bonuses, and option and restricted stock grant sizes, and through the threat of being fired for poor stock-price performance. The CEO pay literature has yet to reach a consensus on the appropriate methodologies and metrics to use in evaluating the “indirect” relation between CEO pay and company stock-price performance. For practical purposes, however, Hall and Liebman (1998) and Murphy (1999) show that virtually all of the sensitivity of pay to corporate performance for the typical CEO is attributable to the direct rather than the indirect part of the CEO’s contract, and the direct part can be measured from information available in corporate proxy statements.
Since agency costs arise when agents receive less than 100% of the value of output, the CEO’s share of ownership is a natural measure of the potential severity of the agency problem. In particular, the CEO’s percentage holdings of his company’s stock measures how much the CEO gains from a $1 increase in the value of the firm, and how much he loses from a $1 decrease. Computing percentage ownership for restricted and unrestricted shares is trivial (simply divide by the total number of shares outstanding). Including stock options in a percentage holdings measure is more complicated, since options that are well out-of-the-money provide few incentives to increase stock prices, while options that are well in-the-money provide essentially the same incentives as holding stock. Therefore, each stock option should count somewhat less than one share of stock when adding the holdings to form an aggregate measure of CEO incentives, and the “weight” should vary with how much the option is in (or out) of the money. In constructing an aggregate measure of CEO incentives, I weight each option by the “Option Delta”, defined as the change in the value of a stock option for an incremental change in the stock price. Option Deltas range from near zero (for deep out-of-the-money options) to near one (for deep in-the-money options on non-dividend paying stock).19 I call our measure the “effective ownership percentage” to distinguish it from the actual ownership percentage based only on stock (and not option) holdings.
Figure 8 shows the evolution of the median effective percentage ownership for CEOs in S&P 500 firms from 1992 to 2011. The percentage ownership for stock and restricted stock is calculated by dividing the CEOs shareholdings by the total number of shares outstanding. Effective percentage ownership for stock options is measured by weighting each option held by the executive at the end of the fiscal year by “Option Delta” for that option (which varies according to the exercise price and time remaining to exercise), and dividing by the total number of shares outstanding.20 As shown in the figure, stock and restricted stock holdings for the median S&P 500 executive has grown modestly over the 20-year period (reflecting the increased popularity of restricted stock), ranging from 0.12% to 0.15%. Over the same time period, total effective ownership (including delta-weighted options) doubled from 0.35% in 1992 to 0.69% in 2003, before falling to 0.38% in 2011. The drop in ownership in 2008 depicted in Figure 8 primarily reflects that most options held by CEOs at the end of 2008 were substantially out of-the-money and therefore had low incentives and low Option Deltas.

Figure 8 Median Effective Percentage Ownership for CEOs in S&P 500 Firms, 1992–2011. Note: Percentage ownership for stock and restricted stock measured as the CEO’s shareholdings divided by the total number of shares outstanding. Effective percentage ownership for stock options measured by weighting each option held by that options “Black–Scholes Delta” and dividing by the total number of shares outstanding. Year-end options under the pre-2006 disclosure rules estimated using the procedure described in Murphy (1999).
The measure of effective CEO ownership in Figure 8 is essentially the “Pay-Performance Sensitivity” introduced by Jensen and Murphy (1990b). The primary difference is that I am measuring the effective ownership percentage, while Jensen and Murphy measured the change in CEO wealth per $1000 change in shareholder wealth, which equals the effective ownership percentage multiplied by ten. The other difference is that Jensen and Murphy also include indirect incentives from cash compensation and disciplinary terminations. Using data from 1974 to 1986, Jensen and Murphy estimate a median pay-performance sensitivity for stock and options of $2.50 for every $1000 change in shareholder wealth, which corresponds to an ownership percentage of 0.250%.21 Therefore, by the end of 2003, pay-performance sensitivities had nearly tripled the data from 1974 to 1986. But, by year-end 2011 the pay-performance sensitivity was slightly above its 1992 level, or about 50% higher than the Jensen–Murphy estimate.
The average market capitalization of firms in the S&P 500 grew (in 2011-constant dollars) from $10.0 billion in 1992 to $35.8 billion in 2000 (before falling to $22.7 billion in 2011), therefore the dollar value of the typical CEOs ownership position is large even if his percentage holding is low. Hall and Liebman (1998) argue that a better way to measure CEO incentives is as the change in CEO wealth for a 1% change in the value of the firm rather than as the ownership percentage. Baker and Hall (2004) provide some theoretical justification for using this measure. In particular, Baker and Hall show that percentage ownership is the right measure of incentives when the marginal product of the CEO effort is constant across firm size, such as a CEO contemplating a new corporate headquarters that will benefit the CEO but perhaps not the shareholders, or an outside takeover bid that will benefit outside shareholders but perhaps not the CEO. But, the Hall-Liebman measure is appropriate when the marginal product of the CEO effort scales with firm size, such as a corporate reorganization (assuming it takes the same amount of CEO effort to reorganize a big firm as a small firm).
Figure 9 shows the evolution of the Hall-Liebman measure—what Frydman and Jenter (2010) call “equity at stake”—from 1992 to 2011. The equity-at-stake measure is calculated as 1% of the effective ownership percentage multiplied by the firm’s market capitalization.22 In 1992, each 1% change shareholder wealth resulted in a $181,000 change in CEO wealth for the median CEO in the S&P 500. The equity-at-stake measure grew to nearly $900,000 in 2000 and again in 2005, before plummeting to $265,000 in 2008 as a result of both the decline in market capitalizations and the decline in Option Deltas.
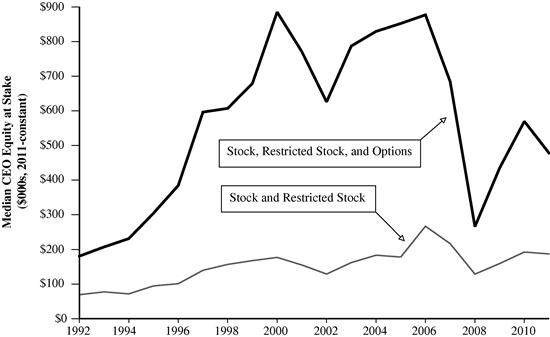
Figure 9 Median Equity at Stake for CEOs in S&P 500 Firms, 1992–2011. Note: Following Frydman and Jenter (2010), Equity-at-Stake is measured as the effective ownership percentage multiplied by 1% of the firms market capitalization (in thousands of 2011-constant dollars).
As an alternative to both the Jensen-Murphy and Hall-Liebman measures, Edmans, Gabaix, and Landier (2009) provide theoretic justification for measuring incentives using the “wealth-performance elasticity” (i.e., the percentage change in CEO wealth corresponding to a percentage change in firm value) when the CEO effort has a multiplicative (rather than additive) effect on both CEO utility and firm value. In practice, creating this measure generally requires data not available to researchers (in particular, the CEO’s wealth beyond his portfolio of company stock and options).23
2.2.2 The Relation Between CEO Wealth and Stock-Price Volatilities
Suspicions that executive compensation policies in financial services firms contributed to the 2008-2009 financial crisis eventually broadened to similar suspicions for companies outside the financial sector. In December 2009, as part of the continued fallout from the crisis, the SEC began requiring all publicly traded companies to disclose and discuss compensation policies and practices that might provide incentives for executives to take risks that are reasonably likely to have a materially adverse effect on the company.
When executives receive rewards for upside risk, but are not penalized for downside risk, they will naturally take greater risks than if they faced symmetric consequences in both directions. For top executives, rewarded primarily with equity-based compensation, the primary source of risk-taking incentives emanates from stock options. The pay-performance relation implicit in stock options is inherently convex, since executives receive gains when stock prices exceed the exercise price, but their losses when the price falls below the exercise price are capped at zero.
Since equity is a “call option” on a leveraged firm (Black and Scholes, 1973), equity-based pay in a leveraged firm can provide similar risk-taking incentives to those provided by stock options in an all-equity firm. Consider, for example, an investment opportunity promising equal chances of a $400 million gain and a $600 million loss (i.e. a net-present value of -$100). Shareholders in a $1 billion all-equity firm will have no incentive to pursue this negative NPV investment, because they will bear 100% of both the gains and losses. But, suppose the firm has only $100 million in equity, and $900 million in debt. Equity holders receive 100% of the upside, but their downside liability is limited to the value of their initial equity stake ($100 million). Thus, from the perspective of the equity holders, the project has a net present value of +$150 million.
The conflict of interest between shareholders and debtholders—dubbed the “Agency Cost of Debt” by Jensen and Meckling (1976)—has led several researchers to measure risk-taking incentives by leverage ratios and to prescribe CEO pay structures that include debt as well as equity.24 However, it is worth noting that it is not leverage per se that creates risk-taking incentives, but rather the limited liability feature of equity. For example, the shareholders in the example in the prior paragraph would have incentives to take the negative NPV project even if the firm was a $100 million all-equity firm; in this case losses greater than $100 million would be borne by the government or society, etc., and not by debtholders. It is also worth noting that the severity of the risk-taking incentives depends on the maximum downside risk compared to the dollar amount of equity, and not the value of equity compared to the overall value of equity plus debt. The level of debt is important only to the extent that is available to fund risky negative NPV projects.
Since the value of a stock option (or the value of equity in a leveraged firm) increases monotonically with stock-price volatilities, options (and limited liability) provide incentives for executives to increase such volatilities. In Section 2.2.1, the calculations for pay-performance sensitivities for stock options depended on the Option Delta, defined as the change in the value of a stock option associated with an incremental change in the stock price. Similarly, the calculations for pay-volatility sensitivities for stock options depend on the Option Vega, typically defined as the change in the value of a stock option associated with one percentage-point increase in the stock-price volatility (e.g. from 30% to 31%). Option Vegas are typically highest when stock prices are near the option’s exercise price.
Following Fahlenbrach and Stulz (2011)’s analysis of executive compensation and the financial crisis, I consider two option-based measures for incentives to increase stock-price volatilities:
![]()
![]()
Figure 10 shows the time trends in the two measures of pay-volatility sensitivities for the median executive in a S&P 500 firm from 1992 to 2011. The left-hand axis reports the Total Option Vega, which reached its peak in 2003 (when the median CEO gained $243,000 by increasing volatility by one percent), and plummeted in 2008 to $127,000 for a one percent increase in volatility. The right-hand axis reports the percentage change in option values associated with a one percent increase in volatility. This “Vega Elasticity” remained relatively constant from 1992 to 2007 at around 1.0 (indicating that a one percentage-point increase in volatility would increase the value of CEO option holdings by about 1%). The Vega Elasticity jumped to over 5.0% in 2008, falling to 2.0% by 2011.

Figure 10 Option-based incentives to increase volatility by CEOs in S&P 500 Firms, 1992–2011. Note: The Total Option Vega is defined as the change in value of outstanding options for a one percentage-point increase in volatility. Vega Elasticity is defined as the percentage change in value of outstanding options for a one percentage-point increase in volatility.
The differences in the two measures in Figure 10 reflect the effect of stock-market movements and, in particular, the market crash at the end of 2008 and the partial rebound by 2011. When stock prices fell (as they did abruptly in 2008, across all sectors of the economy), the options fell out of the money, which implies that the Option Vega for each option becomes smaller (remember that the Option Vega is highest when the stock price is close to the exercise price). But, it turns out that, as stock prices fall, the value of the options held fall even faster than the Option Vega. As a result, the value of options that are out-of-the-money increases more in percentage terms (but less in dollar or euro terms) as volatility increases.
One troublesome fact apparent from Figure 10 is that the two vega measures—both legitimate measures for risk-taking incentives—move in opposite directions in market downturns. There is no accepted methodology for measuring incentives for risk in executive option portfolios, or in executive equity positions in leveraged firms, or in executive contracts more generally.25 Until the recent financial crisis—when compensation policies were blamed for contributing to the meltdown—there had been little focus on the role of compensation policies in providing incentives to take risks.
Finally, while the current controversy over executive incentives has focused on excessive risk taking, it is worth noting that the challenge historically has been in providing incentives for executives to take enough risk, not too much risk. Executives are typically risk-averse and undiversified with respect to their own companies’ stock-price performance. On the other hand, shareholders are relatively diversified, placing smaller bets on a larger number of companies. As a result, executives will inherently be “too conservative” and want to take fewer risks than desired by shareholders. Stock options (or other plans with convex payouts) have long been advocated as ways to mitigate the effects of executive risk aversion by giving managers incentives to adopt rather than avoid risky projects (see, for example, Hirshleifer and Suh, 1992). Similarly, there is a long history of attempts to document an empirical relation between such convexities and actual risk-taking incentives, and the results have been relatively modest.26
2.3 (Dis)lncentives from Bonus Plans27
Most discussions about incentives for US CEOs focus exclusively on equity-based incentives, since changes in CEO wealth due to changes in company stock prices dwarf wealth changes from any other source (Hall and Liebman, 1998; Murphy, 1999). However, from a behavioral perspective, annual and multi-year bonus plans based on accounting measures may be as important as equity in actually directing the activities of CEOs and other executives. Consider the following:
• Incentive plans are effective only if the participants understand how their actions affect the payoffs they will receive and then act on those perceptions. While CEOs likely understand how to increase accounting income (by increasing revenues and decreasing costs of goods sold), they often do not understand how their actions affect company stock prices. Therefore, bonus plans may well provide stronger incentives than equity-based plans, even though their magnitude is smaller.
• Most bonus plans are settled in cash soon after the results are tallied (e.g. after the year-end audited financials). The immediacy and tangibility of these cash awards may well provide stronger incentives than the distant and uncertain paper gains in unvested equity plans.
Unfortunately, while CEOs may indeed be motivated by their bonus opportunities, they are not necessarily motivated to increase firm value. The problems lie in the design of the typical bonus plan, illustrated in Figure 11. Under the typical plan, no bonus is paid until a lower performance threshold or hurdle is achieved, and a “hurdle bonus” is paid at this lower performance threshold. The bonus is usually capped at an upper performance threshold; after this point increased performance is not associated with an increase in the bonus. The thresholds are routinely determined by the firm’s annual budgeting process. The range between the lower and upper performance thresholds (labeled the “incentive zone” in the figure), is drawn as linear but could be convex (bowl-shaped) or concave (upside-down bowl-shaped). The “pay-performance relation” (denoted by the heavy line) is the function that shows how the bonus varies throughout the entire range of possible performance outcomes.

Figure 11 A Typical Bonus Plan Note: Under a typical bonus plan, a performance target and a target bonus for meeting that performance are set. Upper and lower performance thresholds are established which create an incentive zone within which the bonus increases with performance. Bonuses do not vary with performance outside the range established by the Lower and Upper Performance thresholds. A Hurdle Bonus is often paid when the executive reaches the lower performance threshold. The bonus can increase linearly with performance in the incentive zone (as shown here) or it can increase at a decreasing rate or an increasing rate (that is, the line can be convex or concave).
In spite of substantial variability across companies and industries, short-term and long-term bonus plans can be characterized in terms of the three basic dimensions suggested by Figure 11: performance measures, performance thresholds (that is, targets, benchmarks, or standards), and the structure of the pay-performance relation. Design flaws in any of these dimensions can provide incentives to withhold effort, to shift earnings and cash flow unproductively from one period to another (or otherwise manipulate earnings), to use capital inefficiently, and to destroy information critical to the effective coordination of disparate parts of large complex firms.
2.3.1 Problems with Non-Linear Pay-Performance Relations
Researchers have long acknowledged that non-linear incentive plans cause predictable problems.28 For example, executives capable of producing well above the upper performance threshold in Figure 11 have incentives to stop producing once they “max out” on their bonuses. In addition, they will do their best to transfer performance results that could have been realized this period into a later period.
Similarly, but potentially worse, is the effect of the discontinuity at the lower performance threshold in Figure 11. Executives who believe they cannot achieve at least this level of performance this year will either stop producing or “save” performance for next year by delaying revenues or accelerating expenses. Moreover, if executives see that they are not going to make the bonus pool this year, they are better off taking an even bigger hit this period (since there is no bonus penalty for missing the lower threshold by a lot instead of a little) so they can do even better next period—what accountants have called the “big bath” phenomenon. On the other hand, executives who are struggling to make the lower threshold, but still believe they can make that threshold, have incentives (provided by the threshold bonus) to do whatever is necessary to achieve the lower threshold. Their actions commonly include destroying value by loading the distribution channel so as to recognize revenues earlier, unwisely reducing R&D and required maintenance expenditures, and (in some cases) outright accounting fraud. Each of these actions shifts reported profits from next period to the current period, but does so at an unnecessary cost to the firm.
In both of these cases, the non-linearities provide incentives for CEOs to “manage earnings”. In particular (and assuming that performance is measured by earnings), the bonus plan in Figure 11 provides incentives to “smooth earnings” (by shifting earnings from next period when below the lower threshold and shifting earnings to next year when above the upper threshold), while occasionally taking a “big bath” (when it is not possible, even with manipulation, to get earnings above the lower threshold).
In addition to earnings management, non-linearities also affect risk-taking behavior. In particular, when the pay-performance relation is concave (so that lower performance is penalized more than higher performance is penalized), executives can increase their total bonus payouts by reducing the variability of their performance. Conversely, convex pay-performance relations increase risk-taking incentives. Financial economists have suggested that boards purposely add convexity to CEO pay contracts to offset the reluctance of risk-averse CEOs to invest in risky (but profitable) projects.29 More recently, some academics (as well as Congress and the popular press) have alleged that convexities in banking bonuses (where positive performance is rewarded, but negative performance is not penalized) led to excessive risk-taking that, in turn, facilitated the 2008–2009 financial crisis.
The problems with non-linearities are mitigated by eliminating caps on the upside, and finding ways to implement and enforce “negative” bonuses on the downside.30 While it is difficult to force CEOs to write checks back to the company after a bad year, negative bonuses can be partially implemented by basing pay on multi-period cumulative performance (Holmstrom and Milgrom, 1987) or by deferring current compensation into bonus banks that can be used to fund future negative bonuses (Stewart, 1991). Another indirect way to impose negative bonuses is by reducing base salaries and offering enhanced bonus opportunities (through reduced bonus thresholds).
2.3.2 Problems with Performance Benchmarks
Bonuses are usually not, in practice, based strictly on a performance measure, but rather on performance measured relative to a performance benchmark (Murphy, 2000). Examples include net income measured relative to budgeted net income, EPS vs. last year’s EPS, cash flow vs. a charge for capital, performance measured relative to peer-group performance, or performance measured against financial or non-financial strategic “milestones”. Performance targets (one form of benchmark) typically correspond to the level of performance required to attain the executive’s “target bonus”.
When bonuses are based on performance relative to a benchmark, executives can increase their bonus either by increasing performance or lowering the benchmark. Performance benchmarks therefore create predictable problems whenever the participants in the bonus plan can affect the benchmark. For example, when benchmarks are based on meeting a budget, executives with bonuses tied to budgeted performance targets have strong incentives to low-ball the budget. Boards (and supervisors throughout the management hierarchy) understand these incentives and generally push for higher budgets than those suggested by executives. The result is a familiar and predictable “budget game” that ultimately destroys the information critical to coordinating the disparate activities of a large complex organization (Jensen, 2003).
As another example, when benchmarks are based on prior performance (such as bonuses based on growth or improvement), plan participants understand that increased performance this year will be penalized by higher benchmarks the next year, and will naturally take account of these dynamics when deciding how hard to work and what projects to undertake in the current year. Similarly, when bonuses are based on performance measured relative to that of colleagues, participants can increase their bonuses by sabotaging co-executives (Lazear, 1989; Gibbons and Murphy, 1990). Benchmarks based on industry peers provide incentives for selecting “weak” industries or peers, or staying too long in a defective industry (Dye, 1992).
The problems with benchmarks based on budgets, prior-year performance, co-workers, and other internally manipulable measures can be mitigated by “externalizing” the benchmark; that is, by basing the benchmark on objective measures beyond the direct control of the plan participants. In Murphy (2000), I showed that companies using external benchmarks (which I defined as benchmarks based on fixed numbers or schedules, industry performance, or the cost of capital) were less likely to manage fourth-quarter earnings than were companies with internal benchmarks. However, I was unable to explain satisfactorily cross-sectional differences in the use of internal and external benchmarks, or why nearly 90% of the sample of 177 firms based benchmarks on budgets or prior-year performance.
2.3.3 Problems with Performance Measures
The problem of inappropriate performance measures is illustrated succinctly by the title of Steven Kerr’s famous 1975 article, “On the folly of rewarding A, while hoping for B” (Kerr, 1975). Paying salespeople commissions based on revenues, for example, provides incentives to increase revenues regardless of the costs or relative margins of different products. Likewise, paying rank-and-file workers “piece rates” based on units produced provides incentives to maximize quantity irrespective of quality, and paying a division head based solely on divisional profit leads that division head to ignore the effects of his decisions on the profits of other divisions. Similarly, paying CEOs based on short-run accounting profits provides incentives to increase short-run profits (by, for example, cutting R&D) even if doing so reduces value in the long run.
Conceptually, the “perfect” performance measure for a CEO is the CEO’s personal contribution to the value of the firm.31 This contribution includes the effect that the CEO has on the performance of others in the organization, and also the effects that the CEO’s actions this year have on performance in future periods. Unfortunately, the CEO’s contribution to firm value is almost never directly measurable; the available measures will inevitably exclude ways that the CEO creates value, and include the effects of factors not due to the efforts of the CEO, or fail to reveal ways that the CEO destroys value. The challenge in designing incentive plans is to select performance measures that capture important aspects of the CEO’s contributions to firm value, while recognizing that all performance measures are imperfect and create unintended side effects.
While companies use a variety of financial and non-financial performance measures in their annual CEO bonus plans, almost all companies rely on some measure of accounting profit such as net income, pre-tax income, or operating profit. Accounting profit measured over short intervals is not, however, a particularly good measure of the CEOs contribution to firm value, for several reasons. First, CEOs routinely make decisions (such as succession planning or R&D investments) that will increase long-run value but not short-run profit. Second, accounting profits (like equity-based measures) are invariably influenced by factors outside of the control of the CEO, including the effects of business cycles, world oil prices, natural disasters, terrorist attacks, etc. Third, while the measures of accounting profits typically used in bonus plans take into account both revenues and expenses, they ignore the opportunity cost of the capital employed. The use of these accounting measures provides incentives to invest in any project that earns positive accounting profits (not just those that earn more than the cost of capital), and provides no incentives to abandon projects earning positive accounting profits that are less than those required to cover their cost of capital.
Exacerbating the problems with accounting-based performance measures in bonus plans is the fact that they are often expressed as ratios (e.g., earnings per share, return on assets, return on equity, return on capital, etc.). Executives participating in such plans can increase their bonus either by increasing the numerator (accounting profits) or by decreasing the denominator (e.g. shares, assets, equity, invested capital). For example, a CEO paid on the basis of return on capital would prefer a $100 million project earning a 40% return to a $1 billion project earning a 25% return, even though the latter creates more wealth (as long as the cost of capital is less than 22%).
2.4 (Dis)Incentives from Capital Markets32
The typical accounting-based bonus plan depicted in Figure 11 provides incentives to focus on short-run accounting returns at the expense of long-run value creation, and to manipulate or smooth earnings by unproductively shifting revenues and expenses across reporting periods. Conceptually, this problem is mitigated by shifting from accounting- to equity-based plans: if markets are efficient, then the equity markets should punish executives for playing the “earnings management game”. However, equity markets can exacerbate rather than mitigate the problem, by providing executives with incentives to take actions to meet or beat analyst and market expectations for earnings or certain key performance benchmarks.
Figure 12 shows the relation between the magnitude of the quarterly abnormal stock return and quarterly earnings surprises measured by the earnings forecast error, based on 172,247 firm-quarter observations over the period 1984-2010.33 The earnings forecast error is defined as the difference between actual announced earnings per share and the median analyst forecast for quarterly earnings thirteen trading days prior to the end of the quarter, divided by the closing stock price for the quarter. Abnormal returns reflect the cumulative return from twelve days before to one day after the earnings announcement, less the buy-and-hold return from the associated Fama-French 5x5 portolio (based on size and book-to-market ratios). Accounting data are from Compustat, returns and share prices from CRSP, and earnings forecasts are from I/B/E/S.

Figure 12 Abnormal Stock Returns in Response to Quarterly Earnings Surprises Note: The graph plots quarterly abnormal returns for growth and value firms as a function of earnings surprise at the end of the quarter. Forecast error is measured as the earnings surprise relative to the quarter-end stock price. Data are from I/B/E/S database for the final month of the fiscal quarter for which earnings is being forecast. Each “dot” represents averages for 200 portfolios ranked by the earnings surprise. Sample size is 172,247 firm-quarter observations in the period 1984-2010. Note: Data and analysis provided by David Huelsbeck.
As shown in Figure 12, stock prices react strongly and positively to small positive earnings surprises: when a firm produces earnings that beat the consensus analyst forecast by 1% the stock price rises on average by about 5.5%. Similarly, stock prices react strongly and negatively to small negative earnings surprises: when a firm misses its forecast by 1% stock prices fall by nearly 8%. But there is not much additional stock-price reaction to larger surprises (those greater than plus or minus 1% of the stock price at the end of the final month of the fiscal quarter for which earnings are being forecast). This “S-curve” feature of stock-price responses to earning surprises has been well documented in the literature (see, for example, Skinner and Sloan, 2002; Bartov, Givoly, and Hayn, 2002).
As emphasized by Jensen and Murphy (2012), the relation between a firm’s top-management team and the capital markets has resulted in an equilibrium that replicates many counterproductive aspects of budget or target-based bonus systems discussed in conjunction with Figure 11. For executives holding large quantities of stock and stock options, Figure 12 portrays the non-linear pay-performance relation that defines how meeting, beating or missing analyst forecasts affects the value of their equity-based holdings. In particular, executives subject to such stock price responses to quarterly earnings surprises have incentives to beat analysts forecasts by a small amount (an earnings surprise that amounts to no more than 1% of the quarter-end stock price), but not by too much because the payoff from beating the forecast by a lot is not much higher than the payoff for beating it by 1%. Note also that manipulating this quarter’s earnings to miss analyst earnings forecasts by a lot (e.g. by shifting revenues from this quarter to the next quarter, or moving expenses from next quarter to this quarter) also provides increased ability to executives to beat next quarter’s earnings forecast.
Following the accounting scandals in the early 2000s, several researchers have documented that executive option and equity holdings are higher in companies that restate their earnings or are accused of accounting fraud. The results are mixed. Efendi, Srivastava, and Swanson (2007) and Burns and Kedia (2006), for example, document that firms with CEOs who have large amounts of “in-the-money” options are much more likely to be involved in restatements. Bergstresser and Philippon (2006) provide evidence that the use of discretionary accruals to manipulate reported earnings is more pronounced in firms where the CEO’s potential total compensation is more closely tied to the value of stock and option holdings. Johnson, Ryan, and Tian (2009) concludes that firms accused of fraud have significantly greater incentives from unrestricted stockholdings than control firms do, and unrestricted stockholdings are their largest incentive source. Erickson, Hanlon, and Maydew (2006) find in logistic regressions that the probability of being accused of fraud by the SEC is related to stock-based compensation, but find no differences between the fraud firms and a “matched” sample of firms not accused of fraud.
Temptations to manipulate the expectations market will clearly be higher for executives holding large quantities of stock and options that can be sold or exercised before markets adjust to the “real” information. Therefore, the natural remedy to mitigate manipulation is to impose longer vesting periods on restricted stock and options and holding requirements on unrestricted stock.34 However, there is little evidence that executives actually exercise and sell large fractions of their exercisable options or sell large fractions of their unrestricted stock holdings prior to restatements or indictments. The ominous hypothesis is that executives focused on the expectations market are not following a “pump and dump” strategy (which can be controlled by imposing longer vesting and holding requirements), but rather that they are legitimately confused about the difference between increases in the short-run stock price and true value creation.
3 How We Got There: A Brief History of CEO Pay
3.1 Introduction
Most recent analyses of executive compensation have focused on efficient-contracting or managerial-power rationales for pay, while ignoring or downplaying the causes and consequences of disclosure requirements, tax policies, accounting rules, legislation, and the general political climate. A central theme of this study is that government intervention has been both a response to and a major driver of time trends in executive compensation over the past century, and that any explanation for pay that ignores political factors is critically incomplete.
As will become evident in this section, there have been two broad patterns for government intervention into CEO pay. The first pattern is aptly described as knee-jerk reactions to isolated perceived abuses in pay, leading to disproportionate responses and a host of unintended and undesirable consequences. As an example discussed below in Section 3.6.1, outrage over a single $4.1 million change-in-control payment in 1982 led to strict limitations on all golden parachutes for top executives, which in turn led to a host of unintended consequences including an explosion in the use of golden parachutes, tax gross-up provisions, and employment agreements; the rules also encouraged shorter vesting periods for stock awards and early exercise of stock options. The second pattern—best described as “populist” or “class warfare”—arises in situations where CEOs (and other top executives) are perceived to be getting richer when lower-level workers are suffering. The associated attacks on wealth in these situations gave rise to disclosure rules in the 1930s, limits on tax deductibility for CEO pay in the early 1990s, and wide-ranging pay regulations in the 2010 Dodd–Frank Act. Beyond these two broad patterns, indirect intervention in the form of accounting rules, securities laws, broad tax policies, and listing requirements have also had direct impact on the level and composition of CEO pay.
Calling this second pattern “class warfare” is a bit simplistic, since (relative to other developed economies) Americans have historically been unusually tolerant of income inequality arising from exceptional efforts, ideas, and abilities. Underlying much of the outrage—and suggestive of the managerial-power hypothesis—is the perception that executive pay is “rigged” and not reflective of productivity and not set in a competitive market for managerial services.35 Nonetheless, it is instructive to recognize that demands to reform (or punish) CEO pay are concentrated in “third parties” angry with perceived levels of excessive pay, and not shareholders concerned about insufficient links between pay and performance.
3.2 Executive Compensation Before the Great Depression36
The history of executive compensation in the United States naturally parallels the history of executives. While the vast majority of business enterprises before 1900 were small and run by owners, a new class of “salaried middle managers” emerged in a variety of industries (such as railroads and steel) with relatively large and complex firms. However, even these larger firms were typically run by founders, descendents of founders, or individuals with large blocks of equity: there was no obvious need for executive incentive plans that tied pay to corporate performance.
Between 1895 and 1904, nearly two thousand small manufacturing firms combined to form 157 large corporations. Management responsibility in many of these new firms shifted from owners to professional executives who had management skills but no meaningful equity stakes. Over the next two decades, the void in incentives was filled by the emergence of bonuses tied to corporate profits. By 1928, nearly two thirds of the largest industrial companies offered executive bonus plans; bonuses accounted for 42% of 1,929 total executive compensation in companies with plans (Baker, 1938). While compensation was generally modest, the highest bonuses rivaled amounts even in nominal terms not seen again until the late 1970s. For example, as discussed below, Bethlehem Steel’s CEO Eugene Grace received a bonus of $1.6 million for 1929 performance (over $20 million in inflation-adjusted 2010 dollars).
In spite of the increasing magnitude of the highest CEO bonuses, executive pay was not particularly controversial during the 1920s. Part of the nonchalance reflected the fact that there were no public disclosures of pay for individual executives: the bonuses at Bethlehem Steel, for example, came to light as a result of a 1930 lawsuit unrelated to compensation. Most reports at the time were speculative, based on vague descriptions of company-wide bonus formulas that would allow estimates of aggregate but not individual bonuses. Moreover, the economy was robust, unemployment was low, and shareholder returns were high, factors that would provide a safe harbor for high executive pay for the next 90 years.
In July 1930, during a lawsuit attempting to block Bethlehem’s takeover of Youngstown Sheet & Tube Co., Bethlehem Steel’s CEO was forced to reveal that he received a bonus of $1623,753 for 1929, while six vice presidents received $1.4 million in aggregate.37 The revelations—coming at the beginning of the Great Depression—sparked a variety of shareholder lawsuits demanding that the executives return up to $36.5 million in bonuses received since 1911. The same year, shareholders sued American Tobacco for details on its stock subscription plan, resulting in revelations that the company’s CEO netted $1.2 million from an incentive plan that allowed him to purchase company stock at deeply discounted prices.38 Wells (2010, p. 712) concludes that “the Bethlehem Steel and American Tobacco revelations, combined no doubt with a Depression-generated disgust with corporate management, fueled public perceptions that executive compensation was both excessive and the product of self-dealing.”
3.3 Depression-Era Outrage and Disclosure Requirements (1930s)
We have become accustomed to the idea that shareholders—and the public in general—have a right to know the details of the compensation paid to top executives in publicly traded corporations. However, the initial push for pay disclosure was not driven by shareholders but rather by “New Deal” politicians outraged by perceived excesses in executive compensation.
In 1933, Franklin D. Roosevelt became president, ending three terms and twelve years of Republican government and ushering in the New Deal in a country recovering from the Great Depression. In the April prior to the 1932 election—in the face of proposed bailout loans from the government’s Reconstruction Finance Corporation (RFC)—the Interstate Commerce Commission demanded that all railroads disclose the names of executives making more than $10,000 per year.39 The disclosed pay levels outraged the new Administration, and in May 1933 the RFC required railroad companies receiving government assistance to reduce executive pay by up to 60%.40 Ultimately, the US Senate authorized the Federal Coordinator of Transportation to impose an informal (but uniformly complied-with) cap of $60,000 per year for all railroad presidents.
The mandated pay disclosures for railroad executives sparked the interest of other US regulators. By mid-1933 the Federal Reserve began investigating executive pay in its member banks, the RFC conducted a similar investigation for non-member banks, and the Power Commission investigated pay practices at public utilities. In October 1933, the Federal Trade Commission (FTC) requested disclosure of salaries and bonuses paid by all corporations with capital and assets over $1 million (approximately 2000 corporations).41 Business leaders questioned whether the FTC had the legal authority to compel such disclosures, but were reminded that, “Congress in its present temper would readily authorize” whatever the FTC wanted.42 Executives were particularly incensed that the FTC would demand such closely guarded information without any explanation of how the information would be used and without any confidentiality guarantees.
Following the Securities Act of 1934, the responsibility for enforcing pay disclosures for top executives in publicly traded corporations was consolidated into the newly created Securities and Exchange Commission (SEC). In December 1934, the SEC issued permanent rules demanding that companies disclose the name and all compensation (including salaries, bonuses, stock, and stock options) received by the three highest-paid executives. The securities of companies not complying with the new regulations by June 1935 would be removed from exchanges. Several companies, including US Steel, pleaded unsuccessfully for the SEC to keep the data confidential, arguing that publication “would be conducive to disturbing the morale of the organization and detrimental to the best interests of the registrant and its stockholders”.43
Under the Securities Act, details on executive pay are disclosed in company proxy statements issued in connection with the company’s annual shareholders meeting. Ultimately, these disclosures have provided the fodder for all subsequent pay controversies. Proxy statements for companies with December fiscal closings are typically issued in late March or early April, triggering a deluge of pay-related articles in the popular and business press each Spring. Forbes and Business Week began offering extensive lists of the highest-paid executives in 1970. Fortune and the Wall Street Journal quickly followed suit, and by now most major newspapers conduct their own CEO pay surveys for companies based in their local metropolitan areas.
While the SEC has no direct power to regulate the level and structure of CEO pay, the agency does determine what elements of pay are disclosed and how they are disclosed. The SEC has routinely expanded disclosure requirements from year to year, with major overhauls in 1978, 1992, 2006, and 2011. The first proxy statements issued after the formation of the SEC were typically about three-to-five pages long, with less than one page devoted to executive compensation. By 2007, the average proxy statement exceeded 70 pages, nearly all focused on compensation.44
Under the theory that sunlight is the best disinfectant, the SECs disclosure rules have long been a favorite method used by the SEC and Congress in attempts to curb perceived abuses and excesses in executive compensation. Indeed, most additions to disclosure requirements over time—including perquisite disclosure in the 1970s, enhanced option grant disclosures in the 1992, and actuarial pension values in 2006—reflect policy responses to relatively isolated abuses. However, there is little evidence that enhanced disclosure leads to reductions in objectionable practices: for example, perquisites increased as executives learned what was common at other firms, and options exploded following the 1993 rules.
The demand for disclosure reflects both legitimate shareholder concerns and public curiosity. While disclosure can conceptually facilitate better monitoring of outside directors by shareholders, the public curiosity aspect of disclosure imposes large costs on organizations. The recurring populist revolts against CEO pay, for example, could not have been waged without public pay disclosure. Public disclosure effectively ensures that executive contracts in publicly held corporations are not a private matter between employers and employees but are rather influenced by the media, labor unions, and by political forces operating inside and outside companies. These “uninvited guests” to the bargaining table have no real stake in the companies being managed and no real interest in seeing companies managed well so they serve all the claimants on the firm including consumers, debt and equity holders, employees and communities. However, as will become evident throughout this section, these third parties have affected both the level and structure of executive pay through tax policies, accounting rules, direct legislation, and other rules and regulations stretching back nearly a century. These important but often ignored costs of disclosure must be weighed against the benefits (better monitoring of directors) in determining the optimal amount of pay disclosure for top managers.
3.4 The Rise (and Fall) of Restricted Stock Options (1950–1969)
In the 1920s, the US income tax was new, the use of stock options was new, and no one had figured out whether options would be taxed: (1) as compensation when options are exercised (and hence taxed as ordinary income for the individual, and representing a deductible business expense for the company); or (2) as capital gains when the stock purchased upon exercise was ultimately sold (and hence taxed at a lower capital gains rate for the individual, with the company forgoing deductibility). It took nearly twenty years for this issue to be resolved. The major case study at the time involved a May 1928 option grant to the CEO of a chain of movie theaters. After a large six-month run-up in the stock price following the grant, the CEO exercised his options in October 1928 and subsequently sold the shares in 1929 and 1930, paying capital gains taxes (12.5%) on the proceeds. The Bureau of Internal Revenue (the predecessor of the Internal Revenue Service (IRS)) held that he owed ordinary income taxes on the spread at exercise (25% in 1928). The taxpayer appealed the decision, and nearly nine years later the Circuit Court of Appeals agreed with the taxpayer, concluding that a taxable gain is realized only when the shares are sold and not when the option is exercised.45 However, the Bureau appealed this decision, and in a related case nine years later, ruled in favor of the Bureau, concluding in 1946 that the gain upon exercise is compensation, thereby taxable as ordinary income.46
By 1950, the tax issue surrounding stock options was a big deal: the highest marginal tax rate on ordinary income and corporate profits had swelled to 91% and 50.75% (from 25% and 12% in 1928, respectively), compared to a capital gains rate of 25% (from 12.5% in 1928). Moreover, while the Supreme Court required taxes to be paid immediately upon exercise, the 1934 Securities Act required executives to hold shares acquired through option exercises for at least six months before they could sell.47 For example, suppose an executive acquired one share of stock at an exercise price of $10 when the market price is $25. To finance the exercise and pay the taxes, the executive would need to pay $23.65 (i.e. the exercise price plus 91% of the exercise-date spread), but could not raise the amount by selling shares.
As part of the Revenue Act of 1950, a business-friendly Congress unhappy with the recent Supreme Court decision created a new type of stock options called “restricted stock options” that would be taxable not upon exercise but only when the shares were ultimately sold (and then taxed as capital gains). Restricted stock options solved the tax-timing problem, since taxes were not owed until the stock was sold (at least six months following the exercise date). Given the tax rates at the time, restricted stock options also became a relatively efficient way to convey after-tax compensation to executives. For example, at a 91% tax rate on ordinary income and 50.75% corporate tax rate, it cost shareholders $5.47 in after-tax profit to give the executive $1 in after-tax income.48 In contrast (and for simplicity ignoring the timing issues), when the pay is taxed as capital gains rather than ordinary income, it cost shareholders only $1.33 to convey $1 in after-tax income to the executive (even though shareholders forfeit the deduction).
The passage of the 1950 Act launched a predictable wave of new option plans. In 1950 approximately 4% of the companies listed on the New York Stock Exchange (NYSE) had option plans for their top executives; by June 1951 the number had tripled to 12%.49 In their study of the fifty largest firms in 1940 and 1960, Frydman and Saks (2010) estimate that the fraction of executives holding stock options increased from less than 10% in 1950 to over 60% by 1960. Grant sizes also grew: the grant-date value of options for those executives receiving options increased from about 10% of total compensation in the early 1950s to over 20% of total compensation by the early 1960s.
Figure 13 shows the average level and structure of compensation for CEOs in 50 large manufacturing firms, based on data from Lewellen (1968).50 The stock option data—compiled long before the availability of option-pricing methodologies such as Black and Scholes (1973)—are based on appreciations in the annual spread between the market and exercise prices of outstanding options. Since Lewellen measures options at their appreciated values, the trend in Figure 13 reflects, in part, general stock-market movements over this time period. After adjusting for inflation, salaries and bonuses fell from over $2.2 million in 1940 to about $1.5 million (in 2011-constant dollars) from 1947 to 1963. Total compensation, including deferred compensation and stock options, peaked at $2.9 million in 1956. Negligible before 1951, options grew to over 30% of compensation by 1956, falling to about a fifth of total compensation by 1963.

Figure 13 Trends in before-tax CEO Compensation in 50 Large Manufacturing Companies, 1940–1963. Note: The figure is based on the Lewellen (1968) study of 50 large manufacturing firms, adjusted for inflation using the Consumer Price Index. The value of stock options is based annual calculations of the spread between the market and exercise prices. The before-tax value of deferred pay and stock options are estimated from Lewellens after-tax calculations.
Since restricted stock options were taxed at a much lower rate than salaries, the trend in Figure 13 understates the growing importance of options on an after-tax basis. In particular, Lewellen estimates that options accounted for nearly half of total after-tax compensation in 1956, falling to a third of total after-tax compensation by 1963.
By the summer of 1951, there was a growing backlash against the perceived escalation in restricted stock option plans. In August 1951, the Salary Stabilization Board conducted a series of hearings on whether stock options should be considered compensation under the Defense Production Act and therefore subject to regulation by the Stabilization Board.51 In November 1951, the Stabilization Board ruled that restricted stock options could be granted without the Board’s approval as long as the option met certain conditions (including an exercise price of at least 95% of the grant-date stock price; restricted options with an exercise price as low as 85% of the stock price could be issued, but would be considered increases in salary subject to regulation).52 The Board’s ruling was followed by a second wave of option plans, and by June 1952 nearly 17% of the NYSE firms had adopted plans.53 In July 1952 the Salary Stabilization Board was disbanded.
Many of the options granted in the early 1950s fell underwater in the 1953 post-Korean War recession. As part of the Revenue Act of 1954, Congress modified the restrictions on restricted stock options by officially sanctioning variable-price options, in which the exercise price of a previously granted option could be lowered if it turned out that the market price of the optioned stock declined subsequent to the granting of the option. In addition, where the 1950 Act put no limits on the expiration terms of options, the 1954 Act limited exercise terms to 10 years (which continues to be the most common term for options granted through current times). While the popularity of stock options decreased briefly during the bear market in 1957,54 the use of stock options continued to trend upward: by 1961, 68% of the NYSE firms had option plans.55
During the 1960 recession, as new option grants were falling out of favor given the declining stock market, companies began exploiting the provision of the 1954 Act allowing repricing of options by either resetting exercise prices or by canceling existing options and replacing them with new options with lower exercise prices. This practice became highly controversial in the early years of the Kennedy Administration, leading to a series of Congressional hearings aimed at repealing the favorable tax treatment for restricted stock options.56 In 1961, the President demanded that Congress remove the favorable tax treatment for options, instead taxing options as ordinary income upon exercise (most of which would be subject to the 91% top marginal tax rate). The issue was debated in Congress for the next two years, and the controversy intensified in late 1963 and early 1964 when it was revealed that executives at Chrysler had realized $4.2 million in gains from exercising stock options in 1963, and had sold nearly 200,000 shares acquired through earlier exercises.57 Ultimately, as part of the Revenue Act of 1964, Congress stopped short of removing the favorable tax status of restricted stock options, but took several steps that substantially reduced their attractiveness. In particular, under the new law:
• Executives were required to hold stock acquired through option exercises for three years (rather than six months) in order to be taxed at the lower capital gains rate.
• Exercise prices could be no less than 100% (rather than 85%) of the grant-date market prices.
• The maximum option term was reduced from ten years to five years.
• The option price could not be reduced during the term of the option, nor could an option be exercised while there is an outstanding option issued to the executive at an earlier time. (This provision was designed to halt the practice of repricing options or canceling out-of-the-money options and replacing them with options with lower exercise prices).
To distinguish options meeting these new requirements from restricted options granted under the Revenue Act of 1950 provisions, the 1964 Act referred to new grants as “qualified stock options” rather than restricted stock options.
Finally (but perhaps most importantly), the 1964 law reduced the top marginal tax rate on ordinary income from 91% to 70%, which significantly reduced the attractiveness of restricted options over cash compensation. Figure 14 provides a historical comparison of the tax advantages of restricted or qualified stock options relative to cash compensation or non-qualified stock options (in which the gains upon exercise are taxed as ordinary income for the recipient, and deductible as a compensation expense to the company). As a result of the 1964 tax law, the after-tax cost to investors of conveying an after-tax dollar to the CEO in cash compensation fell from $5.56 to $1.73, while the cost of conveying an after-tax dollar in restricted or qualified stock options (taxed as capital gains) remained at $1.33.

Figure 14 The Tax Acts of 1964 and 1969 reduced the tax advantages of restricted or qualified stock options Note: The figure shows the after-tax cost to investors of conveying an incremental $1 in after-tax income under two tax regimes: (1) ordinary compensation (taxable to the recipient at the top marginal rate for earned income (tI), and deductible by the firm at the top marginal rate for corporate income (tC)), and (2) capital gains (taxable to the recipient at the capital gains rate (tG), but not deductible by the firm). The cost for ordinary income is computed as (1-tC)/(1-tI), while the cost for capital gains is 1/(1-tG).
The popularity of qualified stock options fell as a result of the 1964 tax law58 and collapsed following the Tax Reform Act of 1969. In addition, the 1969 Act defined gains from exercising restricted or qualified options as a tax preference item subject to a new Alternative Minimum Tax (AMT) on high wage earners.59 The 1969 Act gradually reduced the top marginal tax rate on earned income from 77% in 1969 to 50% by 1972, reduced the corporate tax rate from 52.8% to 48%, and raised the top capital gains tax rate from 25% in 1969 to 36.5%. Once the new rates were fully implemented (and ignoring AMT issues), it cost investors approximately $1.04 in after-tax profit to convey an incremental $1 in after-tax income to the CEO through cash compensation or non-qualified stock options, and $1.57 to convey $1 in qualified stock options. Thus, for executives and companies in the highest tax brackets, qualified stock options became tax disadvantageous compared to non-qualified stock options, and (as illustrated in Figure 14) have remained so throughout the early 2000s. Indeed, Hite and Long (1982) provide evidence that the 1969 Act explains the dramatic shift from qualified stock options to non-qualified stock options that took place during the early 1970s. Restricted or qualified stock options—which had been the dominant form of long-term incentives for two decades—virtually disappeared.
3.5 Wage-and-Price Controls and Economic Stagnation (1970–1982)
3.5.1 America, Land of the Freeze
In August 1971, in an ultimately (and predictably) unsuccessful attempt to control inflation, President Nixon imposed a 90-day freeze on commodity prices and wages (including executive pay). In December 1971—in what was called Phase Two of the Nixon wage-and-price controls—the Pay Board established by Congress imposed a limit of 5.5% for increases in executive pay (the limit being binding for company-defined groups of executives, but not necessarily for individual executives).60 The Nixon wage-and-price controls were not the first time that levels of executive compensation were explicitly limited by legislation, but were the first time such controls were imposed in a peacetime economy. In particular, the World War II-era Stabilization Act of 1942 froze wages and salaries (for executives as well as other labor groups) at their September 15, 1942 level. The Stabilization Act expired in 1946, but was replaced during the Korean War by the Salary Stabilization Boards established in May 1951 as part of the Defense Production Act of 1951. Similar to the Nixon controls, the Korean War Salary Board set a 6% limit on pay increases for each company’s executives taken as a group; the limits were lifted when the Board was quietly disbanded in July 1952.61
In a debate (and outcome) eerily similar to what would happen two decades later during the Clinton Administration, concerns that the Nixon wage controls would significantly reduce executives incentives led to a series of compromises (or loopholes, depending on one’s perspective).62 In particular, while bonuses were generally limited to the amount paid in any one of the last three years plus 5.5%, the limit did not apply to existing sales incentives, commission and production-incentive programs. Moreover, companies could petition to adopt new incentive plans as long as they were directly related to increased productivity. As a result, scores of companies introduced performance-based bonus plans tied to accounting data or revenues, or converted their existing plans into plans exempt from the limits.
Non-qualified stock options were allowed under the Nixon controls only if the plan was shareholder-approved, if the aggregate number of options granted did not increase from the prior three years, and if the exercise price was at least 100% of the grant-date market price. Non-qualified options were treated as wages and salaries under the Nixon controls, and were valued at 25% of the fair-market value of the shares underlying the option.63 This valuation approach represents an interesting (albeit short-lived) historical footnote, since it was imposed a year before Black and Scholes (1973) and decades before companies began routinely placing a value on options when making compensation decisions.
The median continuing CEO in the Forbes 800 received a 4.5% increase in cash compensation in 1971 (below the Nixon limit), 6.0% in 1972, and 8.1% in 1973 (both above the Nixon limit).64 Since the government-mandated limits on pay raises applied only to executives taken as a group and not individual executives, companies routinely raised CEO pay by reducing pay (or offering smaller raises) to lower-level executives.65 In August 1973, to stop companies from raising CEO pay above the 5.5% limit, the Nixon Administration imposed the 5.5% limit on the more-narrowly defined group of executives identified in company proxy statements. The wage-and-price controls expired in May 1974, in spite of Administration efforts to retain limits on executive compensation.66
CEO pay rose significantly after the wage controls were lifted in May 1974. The median continuing CEO in the Forbes 800 received an 11.1% increase in nominal cash compensation in 1974, double the average limit under the Nixon controls. From 1973 through 1979, the median cash compensation for CEOs in the Forbes 800 increased by 12.2% each year (doubling from $162,000 to $324,000), significantly exceeding the average annual inflation rate of 8.5%.
Figure 15 shows the median level and structure of compensation for CEOs in 73 large manufacturing firms from 1964 to 1982, based on data from Murphy (1985) and inflation-adjusted to 2010-constant dollars. To my knowledge, this was the first comprehensive study of executive pay that measured stock options as the grant-date value using the Black and Scholes (1973) approach. In nominal terms (that is, before adjusting for inflation), median CEO pay in the 73 firms in Figure 15 nearly tripled from $148,900 in 1964 to $569,550 in 1982. However, after adjusting for inflation (which averaged over 6.5% annually over this period), median real CEO pay increased only by about 23% over this 18-year period, or about 1.2% per year. Stock options accounted for 2% of total pay for the average CEO in 1964; the use of options had grown to 12% of pay by 1981. Both the level of pay and the use of stock options fell during the 1981–1982 recession.

Figure 15 Trends in before-tax CEO Compensation in 73 Large Manufacturing Companies, 1964–1982. Note: The figure is based on data from the Murphy (1985) study of executive pay in 73 large manufacturing firms, adjusted to 2011 dollars using the Consumer Price Index. Stock options are valued on grant-date using the Black and Scholes (1973) formula.
3.5.2 The Controversy over Perquisites
While cash compensation escalated (at least in nominal terms) during the 1970s, the use of stock options was relatively stagnant. Part of the declining popularity of options reflected the change in tax policies in 1964 and 1969 that made qualified stock options less attractive, coupled with their outright prohibition in 1976 (see below). More importantly, though, was the prolonged stagnation in the stock market, driven in part by the oil-price shocks of 1973 and 1977. In particular, the nominal value of the bellwether Dow Jones average was basically flat from the beginning of 1965 through the early 1980s (falling from 903 in January 1965 to below 800 by mid-January 1982, and only surpassing 1050 on one day over these seventeen years). While executives continued to receive periodic option grants during this time (once every three years was typical), many of the grants replaced options that expired worthless or options that were cancelled and reissued with a lower exercise price.
The void in compensation created by worthless stock options was quickly filled by a plethora of new plans designed to provide more predictable payouts, including: book-value plans (where executives receive dividends plus the appreciation in book values); long-term performance plans (with payouts based on long-term earnings growth targets); and guaranteed bonuses (with payouts guaranteed independent of performance).67 In addition, since the Nixon wage-and-price controls restricted salaries but not company-provided benefits, companies began relying to a greater extent on shareholder-subsidized perquisites or perks such as low-interest loans, yachts, limousines, corporate jets, club memberships, hunting lodges and corporate retreats at exotic locations.
By the mid-1970s, perceived abuses attracted the ire of shareholder activists, the SEC and the IRS.68 In December 1975, the IRS circulated a draft of proposed regulations specifying which fringe benefits could be excluded from an executive’s taxable income. A long-held general rule excluded from taxable income benefits arising from the ordinary course of business that do not cost the employer anything extra (such as family members accompanying an executive on the corporate jet). The proposed rule imposed tax liabilities for these and other fringe benefits if the benefits were available only to the most highly compensated executives.
The attack on perquisites escalated in 1977 as President Carter famously rallied against companies taking deductions for the three-martini lunch, yachts and hunting lodges maintained to entertain business associates, first-class air travel, fees paid to social and athletic clubs and money spent on sports and theater tickets.69 Congress resisted implementing most of Carter’s reforms as part the Revenue Act of 1978 (in large part because it would potentially affect their own consumption of perquisites) but agreed to eliminate deductions for entertainment facilities.70
In August 1977, the SEC issued Interpretive Release #5856 stating that the value of perquisites be included as compensation in proxy statements.71 In justifying the new disclosures, SEC enforcement chief Stanley Sporkin argued that the “excesses just got to the point where it became a scandal”.72 The disclosures in the 1978 proxy statements fueled the fire by focusing even more attention on perquisites.73 The information on perquisites was expanded significantly in 1979 proxy statements, when the SEC implemented its first major revision in proxy disclosures since the 1930s. Also in 1979, the IRS issued significant new auditing guidelines aimed at detecting and taxing executive perquisites. McGahran (1988) argues that the new SEC disclosures made it easier for the IRS to detect (and tax) fringe benefits, and presents some evidence that fringe benefits decreased, while cash compensation increased, as a result of the SEC and IRS actions.
The ongoing attack on perquisites was reflected in the contemporaneous early academic literature on agency theory. For example, the “agency problem” introduced by Jensen and Meckling (1976) focused on managerial consumption of non-pecuniary benefits such as “the physical appointments of the office” and “the attractiveness of the secretarial staff”. Similarly, Alchian and Demsetz (1972) conclude that companies allow personal consumption of corporate (or university) property (such as “privileges, perquisites, or fringe benefits”) because the cost of detecting and punishing such “turpitudinal peccadilloes” is larger than the benefits from prohibiting the activity.
3.5.3 There’s no Accounting for Options
The restricted and qualified stock options created by the 1950 and 1964 Revenue Acts were not formally considered compensation and therefore companies did not record an expense for such options for either tax or accounting purposes. The switch to non-qualified options in the 1970s—which were considered compensation for tax purposes—raised a new question: how should options be accounted for in company income statements? One possibility was to follow the tax code by recognizing an accounting expense at the time an option is exercised. But, in spite of its simplicity, this method is inconsistent with the basic tenet of accounting that expenses should be matched to the time period when the services associated with those expenses were rendered. Rather, the tenet suggested that options should be expensed over their term based on the grant-date value of the option. At the time, however (and for a long time to come) there was no accepted way of placing a value on an employee stock option.
In October 1972, the Accounting Principles Board (APB)—the predecessor to the current Financial Accounting Standards Board (FASB)—issued APB Opinion No. 25, “Accounting for Stock Issued to Employees”. Under APB Opinion No. 25, the compensation expense associated with stock options was defined as the (positive) difference between the stock price and the exercise price as of the first date when both the number of options granted and the exercise price become known or fixed. The expense for this spread between the price and exercise price—called the intrinsic value—was amortized over the period in which the employee is prohibited from exercising the option.74 Under this rule, there was no charge for options granted with an exercise price equal to (or exceeding) the grant-date market price, because the spread is zero on the grant-date.
The accounting treatment of options cemented the dominance of the traditional stock option (an option granted with a five- or ten-year term with an exercise price equal to the grant-date market price) and discouraged companies from offering more novel option plans. For example, APB Opinion 25 imposes a higher accounting charge for options with an exercise price indexed to the stock-price performance of the market or industry, because the exercise price is not immediately fixed. Similarly, it imposes a higher accounting charge for options that only become exercisable if certain performance triggers are achieved, because the number of options is not immediately fixed. Finally, it imposes an accounting charge for options that are issued in the money but not for options issued at the money—a feature that became especially significant three decades later in the scandals involving backdating.
3.5.4 The Rise (and Fall) of Stock Appreciation Rights
Under Section 16(b) of the Securities Act of 1934, executives must return any profits realized from buying and selling (or selling and buying) shares of their company’s stock within any period of less than six months. This constraint was not problematic for executives exercising restricted or qualified stock options, since the provisions of the 1951 and 1964 Revenue Acts already required executives to hold shares for six months (for restricted options) or three years (for qualified options) before trading. However, the six-month holding period was particularly troublesome for non-qualified options, since executives were required to pay ordinary income tax based on the date the option was exercised and not when the underlying shares were sold.75 Given the depressed stock market in the 1970s, the taxes due upon exercise were often greater than value of the shares when they became tradable.
In December 1976, the SEC formally exempted stock appreciation rights (SARs) from the Section 16(b) short-swing profit prohibition.76 Executives holding a SAR are entitled to receive the appreciation on one share of stock. Like stock options, SARs had a pre-determined term but executives were generally free to exercise their SARs at any time prior to the end of this term (after some minimum time had elapsed). Prior to the December 1976 ruling, there was considerable debate about whether SARs would be subject to the short-swing rule and therefore the proceeds from the exercise of the rights would have to be returned to the company. After the SEC ruling, SARs provided a way for executives to reap the benefits of exercising non-qualified options without being subject to the six-month holding requirement.77As a result of the ruling, many companies replaced their option grants with SAR grants, or issued tandem SARs and options, which allowed the executive to decide which to exercise. For the next fifteen years, SARs became a ubiquitous component of long-term compensation for most executives.
Jumping ahead a bit, in May 1991 the SEC declared that the six-month holding period begins when options are granted, and not when executives acquire shares upon exercise. Therefore, as long as the executive has held the option for at least six months, he is allowed to immediately sell the shares acquired when options are exercised. This new ruling eliminated the primary advantage of SARs over non-qualified options and, as a result, SARs largely disappeared from existence. In addition, the SEC rule effectively encouraged the practice—commonplace today—of selling shares immediately upon exercise.78
The rise and ultimate fall of SARs is a tribute to the cleverness of companies in finding ways around rules that disadvantage executives and companies (in this case, the six-month holding requirement).79 Moreover, the experience shows how seemingly innocuous government interventions (in this case, the 1976 and 1991 SEC rulings) can have a major impact on the composition of executive compensation.
3.5.5 Qualified Stock Options Resurrected, but No One Cares
The Revenue Acts of 1964 and 1969 significantly reduced the attractiveness of restricted/qualified stock options, but did not prohibit new grants. As part of the Revenue Act of 1976, Congress allowed executives to retain and exercise grants made prior to May 20, 1976, but banned all future grants of qualified stock options. Since existing grants had a maximum five-year term, the last grant of qualified options was set to expire on May 19, 1981.
As 1981 approached, Congress resurrected a new form of qualified options (now called Incentive Stock Options or ISOs) as a last-minute addition to the Economic Recovery Tax Act of 1981.80 ISOs carried many of the restrictions common for qualified stock options (holding periods after exercise, minimum exercise prices, etc.), and in addition were limited to $100,000 per executive per year (calculated as the stock price multiplied by the number of options on the date of grant). While ISOs have continued to be popular in the 2000s for middle-level managers (where the $100,000 limitation is not binding) and for companies without taxable profits (where loss of deductibility for ISOs is not costly), virtually all options granted to CEOs and other top executives since 1972 have been non-qualified stock options.
3.5.6 Bigger is Better (Paid)
Almost half of the cross-sectional variation in cash compensation in the United States between 1970 and 1982 was explained by company size (usually measured by firm revenues), and the highest-paid executives routinely were at the helm of the largest conglomerates and largest steel, automotive, and oil companies. Year-to-year changes in cash compensation were also largely driven by increases in company size. And non-monetary aspects of compensation—including power, prestige, board memberships, and community standing—were also positively linked to increases in firm size. The strong relation between CEO pay and company size gave CEOs substantial incentives to increase company size, while the decline of equity-based incentive plans gave them little incentive to increase company share prices. It is noteworthy that the implicit incentives to increase company revenue help explain the unproductive diversification, expansion, and investment programs in the 1970s, which in turn further depressed company share prices.
Although CEO pay and bottom-line corporate profitability remained relatively stagnant from 1970 to 1982, productivity did not. Spurred in part by the oil-price shocks of 1973 and 1977, this period brought significant technological advances that improved productivity, declines in regulation, and increases in global trade significant enough to constitute what Jensen (1993) calls the “Modern Industrial Revolution”. By the early 1980s, most sectors in the US economy were saddled with increasing excess capacity, implying that the sectors had more capital and labor than were required to maintain current levels of production. The root causes of the excess capacity differed across industries. In the oil sector, for example, the five-fold increase in the inflation-adjusted price of crude oil led firms to launch massive capacity-increasing exploration and development projects in anticipation of continued price increases; the sector was stuck with the capacity when demand dropped and prices tumbled to pre-shock levels. Technological change dramatically increased capacity for computing firms, while increased competition from non-unionized entrants created excess capacity in a variety of industries ranging from steel to groceries.
By definition, investment in an industry with excess capacity is a negative net-present-value project, since the industry already has more capital and labor than can be productively employed. Indeed, firms with excess capacity can either increase output with the same workforce, or maintain current output with a smaller workforce. However, the 1970s conglomerates and other large companies typically chose to neither increase output (given low market demands) nor decrease their workforce (since pecuniary and non-pecuniary rewards for CEOs were both tied to company size). Moreover, by the end of the 1970s, most of these companies were generating huge amounts of cash, far in excess of that required to fund available positive net present value projects. CEOs, loathe to distribute excess cash back to shareholders, responded by wasting huge amounts of free cash flow through unwise diversification and investment programs.81
3.6 The Emerging Market for Corporate Control (1983–1992)
3.6.1 Golden Parachutes and Section 280(G)
The executive compensation practices of the 1970s provided few incentives for executives to pursue value-increasing reductions in excess capacity and disgorgements of excess cash. Equity-based compensation (mostly in the form of stock options) accounted for only a small fraction of CEO pay (Figure 15) and the options that existed often were underwater or expired worthless. Annual bonuses—the dominant form of compensation-based incentives—were focused on beating annual budget targets rather than creating long-run value. Performance-based terminations were almost non-existent and—since the vast majority of CEO openings were filled by incumbents rather than outside hires—the managerial labor market was similarly ineffective in disciplining poor performance.
Boards of directors, typically dominated by corporate insiders (in influence if not in numbers), had little reason to reduce corporate waste as long as the companies were delivering positive nominal profits. However, pressures to improve performance and disgorge cash were ultimately introduced by the capital markets, including “hostile takeover” artists such as Carl Icahn, Irwin Jacobs, Carl Lindner, David Murdock, Victor Posner, Charles Bluhdorn, and T. Boone Pickens. At the time, these takeover artists were known pejoratively as “corporate raiders”, though history has shown they were a positive force in creating substantial amounts of value for shareholders of target firms while reallocating resources to higher-valued uses.82 Sometimes this wealth was created by the post-merger activities of the raiders (such as firing incompetent incumbent managers and selling non-productive assets). At other times the wealth was created by responses to the takeover threat (such as spending cash to repurchase shares or to purchase competitors, causing resources to leave the sector and allowing shareholders to find more productive uses for their cash).
The takeover market was complemented by the emergence of leveraged buyouts (LBOs): going-private transactions financed by debt using the target firm’s future cash flows as collateral. Debt created value by providing commitments that the firm would pay its cash flows to debtholders, reducing the amounts available for executives to waste (Jensen, 1986a). Debt also taught executives that capital is costly (since the interest cost of debt capital was more obvious than the implicit, though larger and largely unrecognized, cost of equity capital), leading to reductions in inventories and working capital. The emergence of LBOs and leveraged recapitalizations (in which the firm leverages the capital structure while staying public) created substantial amounts of shareholder value in firms with stable cash flows and no productive alternative uses for their cash, characteristics of many of the mature and declining sectors in the early 1980s.
While employment in companies targeted by hostile takeovers or LBOs was modestly reduced (which was productive given the presumptive excess capacity), the individuals most vulnerable to job losses were incumbent executives opposed to the changes in control. Innovations designed to thwart takeovers included greenmail payments (repurchase of the raiders’ stock at above market prices), standstill agreements (bribes so that the raider does not purchase additional stock), staggered boards (where directors serve overlapping terms, making it difficult for a proxy fight to gain a majority), supermajority rules (requiring more than 50% votes to approve a merger), and poison pills (where shareholders get special rights when there is a takeover bid). But, perhaps the most notorious innovation was the “golden parachute” which provided direct payments to executives following a successful change in control. In most cases, the payment required both the change-of-control and the loss of a job (hence, called “double-triggered” since two things had to happen); in other cases (single-triggered) the change-of-control itself was sufficient to trigger the payment, regardless of job loss.83
Whether change-of-control agreements facilitate or thwart takeovers remains a matter of debate and rests in the details. On one hand, as emphasized by Jensen (1986b), such agreements facilitate takeovers by providing bribes to existing managers to acquiesce to the change in control. On the other hand, such agreements can significantly increase the cost of takeovers for prospective acquirers, especially if the agreements cover dozens or hundreds of executives who have no plausible influence over the takeover decision. In any case, the existence of the apparent bribes paid to top executives (but not to shareholders in general) attracted the ire of a Congress already skeptical of hostile takeovers and their benefits.
Change-in-control arrangements became controversial following a $4.1 million payment to William Agee, the CEO of Bendix. In 1982, Bendix launched a hostile takeover bid for Martin Marietta, which in turn made a hostile takeover bid for Bendix. Bendix ultimately found a “white knight” and was acquired by Allied Corp., but only after paying CEO Agee the golden parachute. The payment sparked outrage in Washington, but Congress could not ban golden parachute payments outright, because such a ban would pre-empt state corporation laws. Congress does, however, control the tax laws, which allow corporations to deduct compensation from income only if the payments represent reasonable compensation for services rendered. By defining particular types or dollar amounts of compensation as unreasonable, Congress can directly determine whether compensation is deductible for corporate tax purposes.
Congress attempted to discourage golden parachutes by adding Sections 280(G) and 4999 to the tax code as part of the Deficit Reduction Act of 1984. Section 280(G) of the Code provides that, if change-in-control payments exceed three times the individuals base amount, then all payments in excess of the base amount are non-deductible to the employer. Also, Section 4999 imposes a 20% excise tax on the recipient of a parachute payment on the amount of payment above the base amount. The base amount is typically calculated as the individuals average total taxable compensation (i.e. W-2 compensation, which include gains from exercising stock options) paid by the company over the prior five years.
Because of the complexity of what appears to be a simple rule, modest increases in parachute payments can trigger substantial tax payments by both the company and executive. For example, suppose an executive with five-year average taxable compensation of $1 million receives a golden parachute payment of $2.9 million, which is less than three times the $1 million base amount.84 In this case, the entire $2.9 million parachute payment would be deductible by the company, and would be taxable as ordinary income to the executive. In contrast, suppose that the golden parachute payment was $3.1 million, which is more than three times the $1 million base amount. Under Section 280(G), the company would not be able to deduct $2.1 million (of the $3.1 million parachute payment) as a compensation expense, and (under Section 4999) the executive would owe $420,000 in excise taxes (i.e. 20% of $2.1 million) in addition to ordinary income taxes on the full $3.1 million parachute payment.
The new Section 280(G) impacted executive compensation in several ways. First, the new law led to a proliferation in change-in-control agreements, which had previously been fairly rare. The Deficit Reduction Act was signed into law on July 18, 1984. By 1987, 41% of the largest 1000 corporations had golden parachute agreements for their top executives, and the prevalence of golden parachutes increased to 57% in 1995 and to 70% by 1999.85 In addition, the standard golden parachute payment quickly became the government prescribed amount of three times base compensation. By 1991, 47.5% of CEO golden parachute arrangements specified a multiple of three times base pay, and by 1999 71% specified three times base pay. Thus, the rule designed to limit the generosity of parachute payments has led to both a proliferation and a standardization of Golden Parachute payments in most large corporations. Apparently compensation committees and executives took the regulation as effectively endorsing such change-in-control agreements as well as the payments of three times average compensation (which quickly became the standard).
Second, Section 280(G) (and the corresponding Section 4999) gave rise to the “tax gross up”, in which the company offset the tax burden of the 20% excise tax by paying an additional amount for the tax (and the tax on the additional amount).86 The percentage of agreements that included gross-up provisions increased from 38% in 1991 to over 82% by 1999.87 This gross-up concept was subsequently applied to a variety of executive benefits with imputed income taxable to the executive, such as company cars, club memberships, and personal use of corporate aircraft.
Third, Section 280(G) also provided incentives for companies to shorten vesting periods in stock option plans, and incentives for executives to exercise stock options even earlier than they would normally be exercised. Consider two otherwise identical executives with golden parachutes paying three times base compensation and holding identical options. Suppose that one of the executives exercises a year prior to the change in control, while the other holds until the change in control. Since base compensation under Section 280(G) includes gains from exercising options, the first executive can receive a higher parachute payment before triggering the excise tax, thus increasing the benefits from early exercise. Moreover, unexercisable stock options routinely become vested (or exercisable) upon a change in control, and the value of these options is defined by the IRS as part of the parachute payment subject to the excise taxes. Therefore, companies and executives can reduce change-in-control related tax liabilities by shortening the time until options become exercisable, and by exercising early and therefore reducing the incentive effects of those plans.
Similarly, unvested restricted stock routinely becomes vested upon a change in control, and a portion of the value of these shares upon vesting is defined by the IRS as part of the parachute payment subject to the excise taxes. Thus, companies can also reduce change-in-control related tax liabilities by shortening the vesting period for restricted stock.
Finally, but perhaps most importantly, the 1984 tax laws regarding Golden Parachutes appear to have triggered the proliferation of Employment Agreements for CEOs and other top-level executives in most large firms since the mid-1980s. In particular, Section 280(G) applies only to severance payments contractually tied to changes of control, while individual CEO employment agreements typically provide for severance payments for all forms of terminations without cause, including (but not limited to) terminations following control changes. Therefore, companies can circumvent the Section 280(G) three-times-base-compensation limitations (at a potentially huge cost to shareholders) by making payments available to all terminated executives, and not only those terminated following a change in control. Indeed, Graef Crystal (when he was still a leading compensation consultant) predicted the unintended consequences of the enactment of these tax provisions in his 1984 opinion piece in the Wall Street Journal:
But will Congress’s new reforms really curb those who want to offer excessive compensation? Not necessarily. Congress has, as usual, made an opening move in a corporate chess game and neglected to consider its opponents countermoves. Instead of having a contract that covers only a change of control, some companies may now implement all-embracing employment contracts that guarantee a person employment (or what he would have earned had he continued to be employed), for say, five years, and under all circumstances. You won’t see one word in that contract about payments in the event of a change of control, and the net effect will be to give the executive more than he would have had had Congress not given free rein to its passions.88
In summary, although Section 280(G) was meant to reduce the generosity of parachute payments, the government action appears to have increased the prevalence of: (i) change-in control plans; (ii) tax gross-ups; (iii) early exercise of stock options; (iv) short vesting periods for restricted stock and stock options; and (v) employment agreements. Each of these outcomes both reduces the incentive effects of incentive compensation for CEOs and other executives and increases the costs of these plans to their firms.
3.6.2 The Shareholder Awakening
The emerging market for corporate control had pronounced effects on the US stock market. After nearly two decades of stagnation, the Dow Jones Industrial Average rallied from below 800 to over 2700 between mid-1982 and mid-1987 (i.e. appreciating nearly 30% per year for five years). While the largest beneficiaries were shareholders in firms that became takeover targets, the rally was broad based and lifted share prices across a wide range of firms and industries. However, executives vigorously (and often successfully) fought takeovers in the 1980s by adopting anti-takeover provisions and by lobbying for political protection (Holmstrom and Kaplan, 2001). Therefore, in spite of the gains to shareholders (or perhaps because of the redistribution in wealth resulting from these gains), hundreds of bills were introduced in Congress to curb takeovers and highly leveraged transactions (Fischel, 1995).
Court decisions and legislation in the late 1980s (coupled with the October 1987 stock market crash) brought the hostile takeover market in the US to a virtual halt. The high-yield debt market was crippled by the indictment and subsequent guilty pleas of Michael Milken and Drexel Burnham Lambert and by restrictions on high-yield debt holdings imposed on savings institutions, commercial banks, and insurance firms, and by major punitive changes in the US bankruptcy law that made it uneconomic to reorganize troubled firms outside of bankruptcy.
But the lessons of the wealth creations learned from the takeover wave resonated with shareholders. In 1985, Robert Monks founded Institutional Shareholder Services to provide proxy-voting advice to institutional shareholders. In 1986, corporate raider T. Boone Pickens founded the United Shareholders Association focused on improving governance and compensation. Academics increasingly argued that traditional management incentives that focused on company size, stability, and accounting profitability destroyed rather than created value, and recommended that executive pay be tied more closely to company value through increases in stock options and other forms of equity-based incentives. These pressures began having an impact: non-equity-based CEO pay continued to grow in real terms after the mid-1980s, but became a smaller part of the total compensation package. For the first time since the 1950s, stock options re-emerged as the dominant form of incentives compensation.
Figure 16 shows the median level and average structure of CEO compensation from 1980-1992, based on Hall and Liebman (1998). Total grant-date compensation is defined as the sum of salaries, bonuses, and the grant-date value of stock options using the Black and Scholes (1973) formula. The annual sample size varies between 365 and 432 firms, and is representative of the population of the large US firms. The percentage composition is defined by dividing the average salary and bonus (or options) by the average total compensation for each year.89 As shown in the figure, inflation-adjusted median pay levels doubled from 1980 to 1992 from $946,000 to $1,800,000. The increase in pay primarily reflects the increase in stock option grants, which accounted for nearly half of total aggregate CEO pay by 1992.

Figure 16 Median Grant-date Compensation for CEOs in Hall and Liebman (1998), 1980–1992. Note: The figure is based on data from the Hall and Liebman (1998) study of executive pay in approximately 500 large US firms (the annual sample size varies between 365 and 432 firms). Total compensation, adjusted to 2011 dollars using the Consumer Price Index, includes salaries, bonuses, and stock options valued on the grant-date using the Black and Scholes (1973) formula. Pay composition percentages for each year based on the annual sample averages for the two components.
Although the takeover and LBO market had been largely shut down by political forces, investors and executives began recognizing that value is created through reducing excess capacity or by reversing ill-advised diversification programs. As emphasized by Holmstrom and Kaplan (2001), stock options allowed executives to share in the value created by internal restructurings: “Shareholder value became an ally and not an enemy”.
3.6.3 Controversial Pay Leads to Sweeping New Disclosure Rules
Between October 13–19, 1987, the Dow Jones Average dropped nearly 800 points (from 2508 to 1738), losing 30% of its value in a week. Executive stock options, which had only recently become an important part of pay, were suddenly underwater. Companies responded by repricing existing options or by significantly increasing the size of their post-crash option grants (Saly, 1994).
The October 1987 crash turned out to be short-lived: by August 1989 the Dow Jones reached an all-time high of 2735, hitting 3000 by July 1990. Stock options issued both before and after the crash were well in the money and becoming exercisable. Large manufacturing firms—still sorting out the excess capacity issues of the 1970s—were downsizing and laying off workers, to the delight of shareholders but attracting the ire of Congress, labor unions, and the media. The combination of valuable options, robust stock markets, and the 1990-1991 recession provided the perfect recipe for a populist attack on executive pay.
The CEO pay debate achieved international prominence during the 1990-1991 recession. The controversy heightened with the November 1991 introduction of Graef Crystal’s (1991) exposé on CEO pay, In Search of Excess, and exploded following President George H. W. Bush’s pilgrimage to Japan in January 1992 (accompanied by an entourage of highly paid US executives). What was meant to be a plea for Japanese trade concessions dissolved into accusations that US competitiveness was hindered by its excessive executive compensation practices as attention focused on the huge pay disparities between top executives in the two countries.90
In response to growing outrage, legislation was introduced in the House of Representatives disallowing deductions for compensation exceeding 25 times the lowest-paid worker, and the Corporate Pay Responsibility Act was introduced in the Senate to give shareholders more rights to propose compensation-related policies. The SEC preempted the pending Senate bill in February 1992 by requiring companies to include non-binding shareholder resolutions about CEO pay in company proxy statements,91 and announced sweeping new rules in October 1992 affecting the disclosure of top executive compensation in the annual proxy statement. Among other changes, the SEC’s new 1992 disclosure rules required companies to produce (a) a Summary Compensation Table summarizing the major components of compensation received by the CEO and other highly paid executives over the past three years; (b) tables describing option grants, option holdings, and option exercises in greater detail; (c) a chart showing the company’s stock-price performance relative to the performance of the market and their peer group over the prior five fiscal years; and (d) a report by the compensation committee describing the company’s compensation philosophy. Overall, the new rules dramatically increased the information available about stock option grants and holdings, and the performance graph cemented the idea that the objective of the firm was to create shareholder value.