Supply and Demand of Global Energy and Electricity
Abstract
The implementation of the two-replacement policy towards clean energy and electric power will trigger significant changes to the structure of global energy supply and demand, resulting in clean production, globalized allocation, and electricity-driven consumption. It is important to adapt to this new trend of energy development, with the objective of ensuring gross energy supply, readjusting the energy mix, and protecting the ecological environment. Based on an understanding of the basic factors that influence the supply and demand of energy, we should conduct research into and accurately evaluate global energy demand, together with a comprehensive study of the global situation of energy development and electricity flows. These efforts should provide an important foundation for the building of global energy interconnections in a scientific manner.
Keywords
global energy interconnection
energy demand
electricity demand
energy development structure
electricity flow
1. Major Factors
Nowadays, energy development is closely associated and aligned with socioeconomic development. It determines the close link that energy supply and demand has with economy, society, the environment and resources. Generally speaking, socioeconomic development, energy resource endowment, energy environment constraints, technological progress, and energy policy regulation are the five major factors that influence energy supply and demand (See Fig. 4.1). In particular, socioeconomic development, including economic and population growth, industrialization, and urbanization, determines the growth trend of gross energy demand and regional distribution. The reserves and distribution of energy resources determine the supply potential, structure, and distribution of energy. Energy and environmental constraints restrict the overall level, structure and way of mankind’s utilization of energy resources to meet energy demand. As the Earth’s ecological environment deteriorates, its impact on energy consumption, supply structure, and structural readjustment has become increasingly prominent. Energy technological advancement and energy policy regulation mirror the combined effect of science and technology and government regulation on economy, energy, and the environment. Energy technological progress is a major decisive factor in directly determining the efficiency of energy production and consumption as well as environmental emissions. Energy-related policy and regulation play a role in guiding and regulating socioeconomic development, energy resource supply, and energy consumer behavior.
Figure 4.1Schematic Diagram of Factors Influencing Energy Supply and Demand
In-depth analysis and comprehensive assessment of the previous factors will have important implications for learning the development trend of global energy, studying and evaluating the mode of global energy development in a scientific manner, and formulating in the right way a roadmap for energy development.
1.1. Socioeconomic Development
Energy demand reflects the ups and downs of economic development. Looking ahead, development will remain the major theme and global energy demand will continue to rise, despite the crippling impact of the financial crisis on the world economy. In developing countries (regions) in particular, fast-growing populations and accelerated economic expansion will bring about catch-up growth in energy demand and the energy consumption gaps between different regions will narrow.
Energy demand will continue to grow on the back of relatively fast socioeconomic development. It is driven by the requirement to satisfy mankind’s production and living needs. With continued improvements in economic development and quality of life, demand for energy will continue to soar for a long while, especially in underdeveloped countries and regions where most of the populations suffering from energy poverty will gradually live a modern life enriched by the supply of power as a commodity. We are of the view that by the mid-twenty-first century, the gross capacity of the world economy will maintain, albeit at a slower rate, the rising trend that started at the end of World War II. It is projected that before 2030, the world economy will grow more strongly, but energy-intensive enterprises in the steel and iron, nonferrous metals, building materials, and chemical engineering industries will experience slower growth. The production of key products will reach the saturation point in 2030 or thereabouts, with energy demand maintaining an average growth rate of 1.6%. After 2030, energy-intensive industries will see themselves degenerating into “sunset industries,” with the industrialization and urbanization processes drawing to an end in most regions. By contrast, the weighting of other industrial, transportation and commercial sectors in the economy will rise further, amid an overall slowdown in energy demand growth.
A more balanced development of the global economy will narrow the gap in energy demand per capita between different regions. Sluggish growth and poverty are the major reasons for the long years of war and social unrest in some locales of Asia, Africa, and South America. With the progress of the globalization process, the gaps between the underdeveloped regions of Asia, Africa, and South America and the developed regions of Europe, the Americas, and Oceania will be significantly narrowed in the future, with an improvement in the imbalanced development between north and south. By 2030, the role of Asia as the engine of world economic growth will be further strengthened. China will overtake the United States as the world’s largest economy; Africa and South America will occupy a more important position in the world economy. The developed countries in Europe, North America, and Oceania will continue to lead the world in technology, finance, and education, but economic growth will be relatively lower due to the impact of population ageing, heavy government debts, and an excessively exuberant virtual economy. By 2050, the currently developing countries (regions) will rise to developed status following the completion of the industrialization process. The gross capacity of emerging economies will account for over 50% of the world economy by then. The gap in energy demand per capita between different regions will close gradually along with the narrowing differences in economic development. Energy consumption per capita in the underdeveloped regions of Asia, Africa, and South America will increase substantially.
The marked difference in population growth will produce a greater impact on energy demand. According to United Nations projections, under the scenario of medium fertility rates, the world population will continue to increase, albeit at a steadily lower rate. The world population is forecast to reach 9.55 billion by 2050. The difference in population growth will become increasingly obvious among different regions, with the African population growing fastest, followed by the Oceanian population; the Asian and South American populations will fall sharply from a high level; the North American population will maintain a low and steady rate of growth while the European region will see negative population growth. In the mid-twenty-first century, along with a slowdown in economic and population growth, energy demand in developed countries will only post marginal growth in the long term. By contrast, the rapid economic expansion, rising populations and faster urbanization among developing and emerging markets will continue to drive global energy consumption higher.
Global economic policy is shifting in the direction of globalization, balance, and low-carbon development. Over the past 20 years, the global economy has exhibited a growing trend of “moving east,” with emerging economies like China, India, and Russia becoming the new drivers of global economic growth. This trend will remain intact and spread to underdeveloped countries and regions. Driven by a fundamental view of concerted and sustainable development on a global basis, all countries are working hard to create a new international economic order characterized by globalization, multipolarization, and mutual coordination, guided by the shared objective of combating global climate change and eliminating war and poverty. Moreover, the emerging low carbon economy is providing an important impetus to global economic growth in the future. In view of the global impact of carbon emissions, countries around the world are finding themselves competing and working with each other to promote global low-carbon development together.
1.2. Energy Resource Endowments
Judging by the supply of energy resources around the world, the long-term development and utilization of fossil energy has imposed rigid growth restrictions on fast-growing energy demand. In contrast, renewable energy sources are inexhaustible with great development potential. The development and utilization of energy resources is limited by regional resource endowments and affected by the economics of technology.
The supply of fossil energy is subject to rigid resource restrictions, with limited room for development and utilization in the future. Fossil energy sources like coal, oil, and natural gas supported the progress of human civilization and socioeconomic development for 200 years in the nineteenth and twentieth centuries. In spite of a steady year-on-year rise in proven reserves of global fossil energy thanks to fast-developing exploration technology, the reserves of global fossil energy remain limited. Unless mankind can stop relying on fossil fuels, this source of energy will eventually and inevitably be exhausted as a matter of reality and natural restriction.
The abundant renewable energy resources around the world will become the dominant energy source in the future. Given their abundance and thanks to the growing maturity of development and application technologies, hydropower, wind, and solar energy resources worldwide can meet energy development requirements. The global demand for energy in 2050 can be satisfied simply by developing just a fraction, at 0.05 percent (5/10,000), of the developable capacity of global wind and solar energy. Moreover, the Earth also possesses other abundant energy resources, like ocean, biomass, and geothermal energy. If these renewable energy resources can be developed on a large scale, the energy problems facing mankind will be fundamentally eradicated.
The imbalanced distribution of energy resources calls for efforts to coordinate energy allocation on a global basis. Regionally, remaining recoverable coal reserves are distributed mainly in Europe and Eurasia, Asia Pacific, and North America. Remaining recoverable, conventional oil reserves are concentrated in the Middle East, Central and South America, and North America. Remaining recoverable natural gas reserves are mainly located in the Middle East, Europe, and Eurasia. Given the abundance of hydropower resources available and a low degree of development and utilization, Asia, Africa, and South America will become the focus of hydropower development in the future. The world’s wind and solar energy resources are mostly concentrated near the Arctic and equatorial regions, making them ideal locations for development and construction of large energy bases. Historically, the uneven distribution of conventional energy sources has propelled the development of global fossil energy trade and traditional energy markets. The global development of electricity-oriented clean energy in the future will lead to the formation of global electricity trade and electricity markets and invoke new requirements on the global allocation of electric power.
1.3. Energy Environment Constraints
With the substantial growth of energy consumption, environmental issues arising from energy development and utilization are becoming increasingly prominent and commanding widespread attention. Global energy environment issues are reflected mainly in greenhouse gas emissions, environmental pollution and ecological damage caused by burning fossil fuels.
Global efforts to combat climate change have accelerated low-carbon development of energy. Putting a spotlight on the growing urgency of work on energy efficiency and emission control, global climate change has been driving the development and improvement of relevant energy technology, energy policy and global energy management systems. The massive emission and build-up of CO2 caused by fossil fuel combustion has increased the concentration of this pollutant gas in the atmosphere and further aggravated the greenhouse effect, resulting in abnormal climate events and global ecological imbalances. To avoid severe disaster and achieve the goal of limiting global temperature rise to no more than 2°C in this century from the temperature recorded before industrialization, the major developed countries and emerging market economies are expected to introduce mandatory measures to control emissions in the future. The global action to combat climate change will bring improvements, making global energy technology, energy policy and global energy management systems more comprehensive, in-depth, and synergistic.
Pollutant discharges caused by energy utilization are attracting growing attention. Long before the Industrial Revolution, firewood was the main source of energy for consumption. Basically this did not create environmental concerns at a time when consumption was limited and timber resources harvested could be replenished through revegetation, not to mention the fact carbon emissions from burning could be offset by the carbon fixation of the growing plants, and the smoke pollution caused by combustion was within an environmentally acceptable limit. The Industrial Revolution triggered rapid growth of energy consumption, making fossil fuels the dominant energy source, with a tremendous impact on the environment. For example, China now faces the severe challenge of compound air pollution caused by soot and vehicle exhaust emissions. With the growing prominence of environmental problems and the ever-higher demand for environmental quality, more importance is being attached to the pollutant discharges from fossil fuel burning as a restrictive factor for energy development.
The current development and utilization of energy resources is ecologically and environmentally unsustainable. Energy development and utilization focusing on fossil energy has brought about increasingly conspicuous damage to the ecological environment. For instance, land subsidence and water contamination caused by coal mining as well as the serious heavy acid rain caused by particulate, sulfur dioxide, and nitrogen oxide emissions in the coal burning process have led to soil acidification, forest deterioration, and other ecological damage. The current over-reliance on fossil fuels for energy development and utilization is unsustainable, which demands the completion an energy transition as soon as practicable in order to reduce destructive exploitation and promote clean energy development.
1.4. Advancement of Energy Technology
By taking advantage of better energy technology to improve demand-side energy efficiency, we can reduce energy supply. By enhancing supply-side capacity while lowering the cost of energy supply, we can significantly alleviate the environmental impact of energy development and utilization and also ease energy environment constraints.
Technological progress has led to improved energy efficiency and lower energy demand. Around the world, energy end-use and intermediate conversion efficiency have improved to various extents, thanks to technology process improvement, energy efficiency technology development, and energy management enhancement. For example, the world’s advanced-level aluminum electrolytic AC power consumption decreased from 14,400 kWh/ton in 1990 to 12,900 kWh/ton in 2012, whereas comprehensive energy consumption of ethylene also went down from 897 kg of standard coal/ton to 629 kg of standard coal/ton over the same period. Energy consumption in the construction and transport sectors has shown significant improvement along with growing technology development in motors, electronic information, materials, and energy gradient utilization. Thanks to the advanced gas turbine and coal-fired power generation technologies, such as extra supercritical coal-fired power generation, integrated gasification combined cycle power generation, and circulating fluidized bed, the efficiency of fossil-based power generation has improved exponentially. Improvement in energy development, energy conversion, and utilization efficiency has not only reduced the production of primary energy required to meet the same level of demand, but also provided conditions for restructuring the energy mix and mitigating energy and environmental problems.
Technological progress has enhanced energy supply capacity and lowered energy supply costs. The oil crisis of the 1970s triggered a far-reaching structural change in the world energy market, prompting global efforts to actively develop energy efficiency technology and seek alternative energy sources to ensure supply security. For example, along with the rapid development of exploration technology, the proven reserves of fossil energy around the world have increased from year to year. The successful development of horizontal well technology, multilayer fracturing technology, hydraulic fracturing technology, refracturing technology, and simultaneous fracturing technology has made the commercialized mass production of shale gas in North America possible. Technological advancements in nuclear energy utilization and renewable energy generation have led to ever-higher levels of clean energy utilization, steadily lowering costs, and growing capacity expansion. As a result of technological development, grid parity for photovoltaic energy generation will be reached in 2016–2017 in Europe and America. However, parity between on-grid photovoltaic power tariffs and residential sales tariffs in China is not expected to be reached until 2020, given the country’s relatively low power price benchmarks. In line with technological progress, generating costs based on the same type of power generation show a steadily downward trend, allowing the electricity industry to meet increasing power demand at increasingly competitive system costs.
Pollutant emissions are reduced and impact on energy and the environment mitigated through technological advancement. As a unique high-quality energy source, electric power is not only highly efficient (over 90% in general), but also pollution-free in consumption and conducive to high-precision control. It is also a good substitute for fossil energy at the end-use level. Amid the dwindling supply of fossil energy resources and the growing concerns about the contribution of fossil energy development and utilization to environmental pollution and climate change, application technologies for renewable energy, such as wind and solar energy, have become the focus of competition in the technologies for global primary energy development and the way forward in energy technology development around the world. With technological progress, the share of electric power in energy end-use and primary energy consumption can be improved and the structure of energy demand optimized to reduce the environmental impact brought about by energy development and utilization and alleviate energy and environmental constraint.
1.5. Energy Policy Regulation
Energy policy can be described as the regulator and controller of energy development, providing a guiding tool at the macro level and a management tool at the micro level to enable the private and public sectors to adjust the relationship between the energy system and the socioeconomic/environmental systems.
Energy policy drives innovation in energy technology. Progress and innovation in energy technology is an important pillar of energy development. Driven by a consensus on global sustainability, governments around the world hold in high regard the development of energy technology, as evidenced by the strong financial, policy and taxation support provided for the development of energy efficiency technology and clean energy technology. For instance, a US$150.7 billion investment plan for the years 2009–2014 was put forward in the United States Recovery and Reinvestment Act by the Obama Administration to provide direct investment, tax incentives, and loans or loan guarantees for clean energy technology. Of this funding amount, 74% is dedicated to promotion and application of clean technologies, 18% to the research and development and demonstration of clean technologies, and the remaining 8% to the provision of financial subsidies for clean technology manufacturers. In recent years, the Chinese government has been working vigorously on the research and development and promotion of energy technologies and creating conditions for energy technology development by improving the market mechanism, technical standards and policy environment.
Policy-guided energy production and utilization. Energy is an important physical foundation for socioeconomic development. With the fast expanding energy demand and the growing scarcity of resources over the past decades, meeting the energy demand arising from socioeconomic development has become the top priority of policy-based regulation. To achieve this goal, measures such as technological progress, market regulation, and system guidance have been taken to support the policy objectives of promoting energy development and ensuring a more adequate supply of energy, while encouraging energy conservation and efficiency and controlling rapid energy demand growth. For example, to improve energy conservation and rein in unreasonable energy demand, the Chinese government has proposed a target of approximately 4.8 billion tons of standard coal for total primary energy consumption and of approximately 4.2 billion tons of standard coal for total coal consumption by 2020 so as to strengthen control of the coal-dominated energy mix. In addition, plans have been proposed to vigorously develop renewables as well as clean energy like nuclear energy and natural gas, with the share of nonfossil energy in primary energy consumption set at 15% and 20% by 2020 and 2030, respectively, to improve the level of substituting clean energy for fossil energy.
Energy policy supports energy and environmental improvements. For a long time, the continued growth of fossil energy consumption has been responsible for environmental issues like ecological damage, environmental pollution, and global climate change. Against this background, the resolution of these energy and environmental problems has figured more prominently in policy terms in some countries. For instance, environmental standards governing energy utilization have been developed, covering coal consumption and pollutant discharges at thermal power plants, environmental well-being and energy efficiency, vehicle exhaust emissions, and the economics of fuels. Intensive efforts have also been exerted to promote the application of environmental management technologies, covering clean energy, high-efficiency power generation, and high-efficiency desulfurization and denitrification.
2. Energy Demand
Energy supply and demand is affected by various factors, such as socioeconomic development, energy resource supply, environmental constraints, technological progress, and regulatory policy. This reality gives rise to great uncertainties surrounding the future development of energy. Among the many probable scenarios of global energy and power demand growth, we focus particularly on the impact of shared global prosperity and an active response to climate change on the future demand for energy and electricity. In terms of socioeconomic development, the global economy is expected to maintain relatively steady growth between 2010 and 2050, with annual growth of approximately 3%,1 and the world’s population will continue to grow from 6.92 billion to 9.55 billion2 in the same period. In response to the restrictions caused by climate change, a global consensus has been reached with aggressive efforts to attain the achievable target of limiting global temperature rise to 2°C. This is expected to lower global carbon emissions from energy consumption by 40–70% to within 12 billion tons3 by 2050, representing a dramatic 50% reduction from 1990 levels and nothing short of a revolutionary challenge to the way of global energy development in the future.
Taking an integrated view of energy demand and environmental constraints, among other factors, an energy system analysis model of “end-use energy demand – energy processing and conversion – demand for primary energy” is adopted for analyzing scenarios of global demand for energy and electricity. The general idea is to project the end-use demand for different types of energy (e.g., coal, oil, natural gas, electricity, and heat) based on the levels of economic activity and historical energy consumption among different energy end-use sectors, while also taking into account trends of fossil energy consumption, electric energy substitution, and carbon constraints. Based on the end-use demand so projected, an integrated view is then taken of the conversion efficiency of different energy segments, including raw coal-fired generation, heating, coking, crude oil refining, power generation, natural gas-fired generation, liquefication, and nonfossil fuel–based power generation and heating, as well as the availability and technology economics of different resources for power generation. This will form the base for projecting the demand for primary energy resources such as coal, oil, natural gas, and nonfossil energy. See Fig. 4.2 for the reasoning behind the global energy and electricity analysis model.
Figure 4.2Global Energy Electricity Model Idea
Based on the previously mentioned reasoning, a scenario analysis of global demand for energy and electricity is performed for the target years of 2020, 2030, 2040, and 2050 in order to forecast the total volume, structure and distribution of global primary energy demand as well as the total volume and distribution of electricity demand in the future. The analysis provides fundamental support for global energy development and the building of a globally interconnected energy network.
2.1. Total Energy Demand
Primary energy demand worldwide is expected to continue growing, albeit at a steadily lower rate. In 2013, global GDP totaled US$74 trillion; with a global population of approximately 7.2 billion, and total primary energy demand of approximately 19.5 billion tons of standard coal.4 With the steady economic and population growth worldwide and continued improvements in energy efficiency, global GDP is expected to reach US$220 trillion and the global population to increase to around 9.55 billion by 2050. We have adopted here a model of “end-use energy demand – energy processing and conversion – primary energy demand” by taking into full account global socioeconomic development, energy supply, energy environment constraints, energy technological progress, and regulatory energy policy. Based on a scenario of quickening clean energy development, global primary energy demand is expected to increase to 30 billion tons of standard coal (see Fig. 4.3) by 2050, which is in line with the scenario proposed in the World Energy Council’s World Energy Scenarios: composing energy futures to 2050. Under this scenario, global energy consumption is expected to grow 1.2% on a yearly basis in 2010–2050, representing an increase of 11.2 billion tons, or the aggregate energy consumption of China, the United States and the European Union combined in 2010. Global energy consumption per capita will grow by around 15% from 2.7 tons of standard coal to 3.1 tons of standard coal, or 46% of the coal consumption per capita of 6.7 tons of standard coal among OECD nations in 2000. This level of per capita consumption is necessary to support the economic growth of developing countries. At the same time, the progress of energy technologies will contribute to a 50% reduction in energy consumption per unit of GDP from 2.7 tons/US$10,000 to 1.4 tons/US$10,000, indicating a significant improvement in the efficiency of energy utilization.
Figure 4.3Total Volume and Growth Rate of Global Primary Energy Demand
In the future, the elasticity coefficient of energy consumption is expected to fall steadily, with faster economic growth being supported by relatively low energy growth. Between 1990 and 2000, average annual global economic growth stood at 2.8%, compared with an average annual growth of 1.4% in global energy consumption, indicating an elasticity coefficient of energy consumption at about 0.5. Between 2000 and 2010, average annual global economic growth was estimated at 2.7%, compared with an average annual growth of 2.4% in energy consumption. The elasticity coefficient of energy consumption climbed to 0.9 as a result of the growing energy consumption in non-OECD countries. As regards future energy development, average annual global economic growth is expected to be about 3.0% between 2010 and 2050, compared with energy demand growth of about 1.2%, indicating an elasticity coefficient of energy consumption at about 0.4. On a phased basis, between 2010 and 2020, average annual global economic growth is estimated at about 3.0% and annual energy demand growth at about 2.0%, indicating an elasticity coefficient of energy consumption at about 0.6. Between 2020 and 2030, average annual global economic growth is expected to rebound to 3.2%, fuelled by the growing emerging economies, and the quickening pace of promoting and applying green energy technology (like the industrial internet, smart buildings, and transport electrification) in the industrial, construction, transport, and other major energy-consuming sectors, is expected to drive global energy demand growth down to 1.4% and the elasticity coefficient of energy consumption down to 0.4. With a slowdown in global economic growth, average annual global economic growth is expected drop to 3.0% in 2030–2040, while average annual energy demand growth will decline to 0.9% and the elasticity coefficient of energy consumption will be about 0.3. With more intensified global efforts in energy efficiency and GHG emission control, average annual world economic growth is expected to fall to 2.8% in 2040–2050, with average annual energy demand growth easing to 0.5%, indicating an elasticity coefficient of energy consumption of approximately 0.2.
The afore-mentioned are projections of world energy consumption growth based on a historical view of global energy development and scenarios of faster clean energy development. But objectively there are uncertainties, as total primary energy demand growth is inextricably linked with global economic growth, changing industry structures, urbanization, population growth, and energy policy. In the event of a slowdown in global economic and population growth, or significant breakthroughs in energy efficiency technology, global primary energy demand may reach approximately 23 billion tons of standard coal by 2030, to rise to 25–27 billion tons in 2050.
2.2. Energy Demand Structure
The continued optimization of the primary energy demand structure will result in a fundamental shift of focus from an energy system dominated by fossil fuels and supplemented by clean energy, to one oriented towards clean energy and supplemented by fossil fuels. In 2013, coal, oil and natural gas accounted for 30.1%, 32.9%, and 23.7%, respectively, and nuclear energy, hydropower and nonhydropower renewable energy accounted for 4.4%, 6.7%, and 2.2%, respectively, of global energy consumption, with the share of fossil energy standing at 86.7%. Amid intensified global efforts in clean energy development, the development of favorable hydropower resources will be basically completed by 2030, with continued rapid growth in various nonhydropower energy resources. Two-thirds of new energy demand will be met by renewables, with over 50% of this new demand to be satisfied by nonhydropower renewable energy, such as wind and solar power. That said, coal, oil, natural gas, and other fossil energy sources will still account for two-thirds of total primary energy demand by 2030. After 2030, we will see more mature technology for development and utilization of wind, solar, and other renewable energy, with continued improvements in conversion efficiency and economics to expedite the substitution for fossil energy (especially coal and oil). Consumption of coal, oil, and natural gas will experience negative growth and all new demand for energy will be met by renewables. Based on a scenario of faster clean energy development, clean energy is expected to represent 80% of total energy supply by 2050, replacing fossil energy as the dominant energy source, while the share of fossil energy will drop to around 20%. See Fig. 4.4 for the global demand for different forms of primary energy between 2010 and 2050.
Figure 4.4Global Demand for Different Forms of Primary Energy, 2010–2050
The substitution of electricity for fossil energy, together with improved electrification, has become the dominant trend in the changes in the world’s end-use energy structure. With population expansion and improving quality of life, mankind’s demand for available energy5 will continue to grow. The efficiency of energy utilization will rise substantially, driven by the growing conversion of clean energy into electricity to gradually replace fossil energy in the end-use sector. Based on meeting equivalent level of demand for available energy, a higher share of electricity in the end-use energy structure will lead to lower energy demand at the end-use level. Higher demand for available energy and improved efficiency of end-use energy will cause end-use energy demand globally to peak around 2030. From 1980 to 2010, global end-use energy consumption increased by 1.6% on an annual basis. Average annual growth in 1980–1990, 1990–2000, and 2000–2010 was 1.6, 1.1, and 2.1%, respectively. Global end-use energy demand is expected to post average annual growth of 0.4% in 2010 to 2050. See Fig. 4.5 for the global end-use energy demand and global demand for available energy from 2010 to 2050.
Figure 4.5Global End-Use Energy Demand and Global Demand for Available Energy
Judging by the trend of end-user, energy utilization has been marked by a shift from a direct, low efficiency consumption model to an indirect, high-efficiency model, with demand for electricity continuing to grow. In 2010, electricity was responsible for 17.7% of global terminal energy consumption, 2.2 percentage points higher than that in 2000. Electricity consumption of OECD countries accounted for 21.9% of end-use energy consumption, and non-OECD countries accounted for 15.7%. It is expected that from 2010 to 2030, the substitution of electricity for coal will be carried out rapidly in the world’s industrial and construction sectors, electric vehicles will gradually be used for commercial application, railway electrification will grow rapidly, coal and oil will have a decreasing share in end-use energy consumption, and electricity will have an increasing share in the energy structure. By 2030, electric energy will have accounted for 25.0% of end-use energy consumption, 7 percentage points higher than that in 2010. See Fig. 4.6 for the world’s end-use energy consumption structure from 2010 to 2050.
Figure 4.6Structure of Global End-Use Energy Consumption, 2010–2050
Because the major emerging economies and developing countries in Asia, South America, and Africa will complete the industrialization process successfully after 2030, the electric furnace will gradually take the place of traditional converters and blast furnaces as the major iron smelting equipment. In other industries (including construction), renewables-generated electricity, and heat will be utilized on a larger scale. In transportation, electric vehicles will replace traditional petrol vehicles at a faster rate to such an extent that oil will be edged out of its current position as the dominant fuel in transportation. Under a scenario of the “two-replacement policy” gathering speed, electricity is expected to account for over half (52.2%) of end-use energy demand by 2050, or a doubling of its share in 2030.
Given the stringent carbon emission controls, the share of fossil energy in total energy consumption is expected to be limited to around 20% by 2050, with more than half of the coal consumed and around 45% of the natural gas consumed going into power generation. The remainder will be used mainly by certain segments of the industrial sector or for nonenergy purposes. By that time, oil-fired generation will basically be nonexistent, with oil used primarily for water transport, air transport, and nonenergy uses. Of all nonfossil energy sources, around 88% will be utilized in the form of electricity and the remaining in the form of heat.
The uncertainty of the energy demand structure is derived mainly from clean energy substitution on the supply side, and electricity substitution at the end-use level. If clean energy substitution and electricity substitution should proceed at a slower-than-expected speed due to technological, cost, policy and other reasons, fossil energy will still have accounted for one-quarter to one-third of the primary energy demand structure by 2050, and electricity will still accounted for less than 50% of end-use energy consumption.
2.3. Energy Demand Distribution
As Asia, South America, and Africa have moved into or completed the industrialization and urbanization processes, accompanied by relatively fast population growth, the share of these regions in global energy consumption is expected to increase quite strongly. By contrast, Europe and America will see a declining share, but nonetheless will remain the world’s most energy-intensive regions in terms of per capita consumption and total energy consumption. Traditionally, the developed nations of Europe and America have been the world’s largest energy consumers. But in recent years, Asia has also become one of the largest energy consumers, reflecting strong demand growth in China and India. In 2013, Asia, North America and Europe were responsible for 39.4, 21.9, and 23.0% of global primary energy consumption, respectively, and South America, Africa, and Oceania accounted collectively for 15.7% of the world’s primary energy consumption. In the future, with the progress of economic globalization and balanced development, Asia, Africa, and South America are expected to experience faster economic growth and account for a higher share of the world economy from 34% in 2010 to around 45% in 2030, rising further to over 50% by 2050. As the north–south divide narrows, underdeveloped regions will enjoy higher living standards and energy consumption. From 2010 to 2050, annual energy consumption per capita in Asia will increase from 1.9 tons of standard coal to 3.1 tons of standard coal, reaching the world average level; annual energy consumption per capita of Africa and South America will grow from 0.6 and 1.8 tons of standard coal to 1.7 and 3.0 tons of standard coal, respectively. Although the energy consumption per capita of North America, Europe and Oceania is notably higher than the world average, it is expected to show a downward trend after reaching its peak under the pressure to reduce greenhouse gas emissions in absolute terms. See Fig. 4.7 for the energy consumption per capita of the world and different continents between 1990 and 2050.
Figure 4.7Energy Consumption Per Capita in the World and Continents, 1990–2050
The rapid growth in energy consumption per capita and population size is expected to make Africa the fastest-growing region in terms of total energy consumption before 2050. Africa’s population will grow from 1.03 billion in 2010 to 2.39 billion in 2050, accounting for a higher share of the world population from 14.9% to 25.1% during this period. The continent’s share of global energy consumption will also rise from 3.0% in 2010 to 13.7% in 2050. Between 2010 and 2050, global energy demand is expected to grow by 11.2 billion tons of standard coal, with Asia, Africa, and South America contributing to the growth. Given their massive population base, these three regions will be able to further consolidate their position as the world’s largest energy consumers. These three regions are also expected to take up a 74.1% share of total global energy demand by 2050. Africa and South America will rise to a more prominent position as the world’s major energy consumers. See Fig. 4.8 for the share of primary energy in global energy consumption by continent between 2010 and 2050.
Figure 4.8The Share of Primary Energy in Global Consumption by Continents, 2010–2050
North America, Europe, and Oceania, regions of traditionally high energy consumption, are expected to experience slower growth in energy consumption, with a correspondingly lower share of world energy consumption to 11.7, 13.4, and 0.8%, respectively, by 2050, as a result of slower economic and population expansion and high energy efficiency. However, annual energy demand per capita in these regions will expectedly remain higher than the world average by 1.5, 0.8, and 0.4 times. See Table 4.1 for scenarios for energy demand by continent.
Table 4.1
Energy Demand Scenario Analysis by Continent
Region
Energy Demand (Billion Tons Standard Coal)
Share (%)
Growth Rate (%)
2010
2020
2030
2040
2050
2010
2050
2010–2050
Asia
7.7
10.4
12.5
14.2
15.8
41.1
52.6
1.8
Europe
4.8
5.0
5.1
4.9
4.0
25.6
13.4
−0.4
North America
4.4
4.6
4.6
4.4
3.5
23.4
11.7
−0.6
South America
1.1
1.4
1.8
2.1
2.3
5.8
7.8
1.9
Africa
0.6
1.0
1.6
2.6
4.1
3.0
13.7
5.0
Oceania
0.2
0.2
0.3
0.3
0.3
1.1
0.8
0.0
World
18.8
22.6
25.9
28.5
30.0
100
100
1.2
Economic globalization has produced the greatest impact on the distribution of global energy demand. If economic growth is lower than expected, the share of Asia, Africa, and South America in energy consumption may be lower than the levels described in the previous scenario. In Africa in particular, local industrialization and urbanization will remain low, dragging down regional energy consumption growth and weakening its position in the world’s energy demand structure, if economic development has not significantly improved while war and turbulence persist. Against this background and as opposed to the previous scenario, Africa’s total primary energy consumption in 2050 may fall to 1.5–2.0 billion tons of standard coal, thereby bringing down global energy consumption to around 27 billion tons of standard coal. By 2050, the share of Africa in global energy demand will maintain at around 5%, and annual energy consumption per capita at 0.6 tons of standard coal, little changed from 2010 levels.
Currently, energy consumption per capita in Africa, where 600 million people are still without access to electricity, is less than one-quarter of the world’s average. Judging by the fast-growing energy and electricity consumption in the developed countries of Europe and America and also China since it launched a policy of reform and opening-up, it can be envisaged that Africa will also see rapid growth in energy and electricity demand after embarking on a modernization drive. Expanding the supply of modern energy and improving energy consumption per capita in Africa is one of the important objectives towards eliminating energy poverty and achieving joint development globally, and also the major driving force behind global electricity demand growth.
3. Electricity Demand
Electricity demand is an important component of the energy demand structure. Given the continued economic and population growth worldwide, along with improved electrification, electricity demand will experience continued growth at a relatively fast speed. Under the framework of electricity substitution and clean energy substitution, the share of electricity will continue to rise in the end-use energy consumption structure and the primary energy supply structure. The share of electricity in energy demand will also rise substantially. Electricity will play a more important role in supporting socioeconomic development and helping to achieve greater economic expansion with lower energy demand growth.
3.1. Total Electricity Demand
Global electricity demand is expected to maintain relatively rapid growth. Over the past few decades, global electricity demand has been growing at a steadily faster rate, with average annual growth of electricity demand worldwide being 2.6% between 1990 and 2000, rising to 3.3% between 2000 and 2010. Judging by the growth trend in global energy demand and considering the accelerating efforts in implementing the two-replacement policy, global electricity demand is expected to soar from 21,400 TWh to 73,000 TWh in 2010–2050, representing annual growth of 3.1%. Annual electricity consumption per capita will shoot up from 3096 kWh to 7654 kWh, representing a 1.5-fold increase and annual growth of 2.3%. On a phased basis, electricity demand growth will slow down, as the major developed countries will have reached the saturation point by 2020 and renewable energy development and electricity substitution are still in their nascent stage. With the energy demand among emerging economies and underdeveloped countries growing rapidly while electricity substitution in developed countries has moved into a stage of fast advancement, electricity demand growth will pick up between 2020 and 2040. With the growing base of electricity demand and less room for substitution, electricity demand growth will slow by 2050. See Fig. 4.9 for the world’s total electricity demand and growth rates between 2010 and 2050.
Figure 4.9World’s Total Electricity Demand and Growth Rates, 2010–2050
Electricity demand growth is comparable to economic growth. Over the past two decades, the elasticity coefficient of global electricity consumption has hovered around 1. In 1990–2000, the elasticity coefficient stood at 0.9, increasing to 1.3 in 2000–2010. It is expected to fall to 1.0 in 2010–2050. By 2020, electrification in the industrial, construction, and transportation sectors will gain steady momentum, contributing to constantly rising electricity demand. However, with the subdued consumption growth among the major energy-intensive industries impacted by the global financial crisis, average growth of global electricity demand is expected to be 2.8% between 2010 and 2020, down 0.5 percentage points from the first decade of the twenty-first century, with an elasticity coefficient of electricity consumption of 0.9. After 2020, the substitution of electricity in various end-use segments for conventional fossil energy, especially coal and oil, will progress at an increasingly noticeable pace. The generating capacity of wind, solar, and other forms of renewable energy will experience significant expansion, with global electricity demand accelerating steadily, on an average annual basis, at expected rates of 3.3 and 3.8% in 2020–2030 and 2030–2040, respectively, with the elasticity coefficient of electricity consumption of 1.0 and 1.3, respectively. After 2040, due to the significantly expanding basis for comparison, electricity demand growth will slow to 2.6%, with the elasticity coefficient of electricity consumption easing to 0.9, in 2040–2050.
The fact that electricity demand growth has surpassed energy demand growth indicates the increasingly dominant role of electricity in the energy structure. It is statistically shown that global electricity demand will post annual growth of 3.1% between 2010 and 2050, 2.6 times the rate of energy demand growth and slightly higher than the average rate of economic growth. Average energy demand growth is expected to be 1.2%, indicative of the saturation of demand and growth “delinked” from the total economy. The fact that electricity demand growth has markedly surpassed energy demand growth reflects a gradual strengthening of the central position of electricity in the energy system and the need to prioritize electric energy development. See Fig. 4.10 for the total world economy and growth in energy and electricity demand between 2010 and 2050.
Figure 4.10The World’s Total Economy and Energy, Electricity Demand Growth, 2010–2050 Note: The initial values of the total economy, electricity demand, and energy demand are set at 1 for the purpose of nondimensionalization.
In developed countries and regions, electricity demand has moved into a period of steady natural growth, with future growth potential coming primarily from electricity substitution. Asia, Africa, and South America are now the world’s major centers of electricity demand growth where demand is expected to maintain relatively fast growth for a while. If the saturation point of electricity demand sets in ahead of time in Asia, Africa, and South America, or electricity substitution in Europe, America and Oceania proceeds more slowly than expected, total global electricity demand may drop to 50,000–60,000 TWh as opposed to the above-mentioned scenario.
3.2. Electricity Demand Distribution
Fundamental changes in the world’s electricity demand situation are expected to occur in line with economic adjustments. The share of developed economies in Europe and America in total global electricity demand will decline substantially, in contrast with a significantly higher share of Asia, Africa, and South America in a rise in total global electricity demand. For a long period, the developed economies in Europe and America have been the world’s major electricity consumers. In 1990, the OECD countries accounted for about 65% of the world’s total electricity consumption and non-OECD countries, only about 35%. More recently, and driven by the fast-growing electricity consumption among emerging economies, non-OECD countries accounted for 51% of total global consumption in 2010, rising to 53% in 2013. In 2010–2050, Asia, Africa, and South America will contribute to over 80% of new global demand growth on account of their population and economic growth, representing shares of 56.7, 17.1, and 7.8%, respectively. Asia will continue to see improvements in electrification in the industrial, construction and transportation sectors, with annual electricity demand per capita rising from 2088 kWh to 7361 kWh (equivalent to the consumption per capita of Europe in 2010), and its share of electricity demand increasing from 41% to 52% of the global total. From very low levels of electrification, Africa and South America will see a sharp increase in electrified operations, as evidenced by the expected growth of annual electricity demand to 3971 and 6547 kWh, or 13 and 7% of the global total, respectively. See Table 4.2 for the electricity demand scenario analysis for the world and individual continents between 2010 and 2050.
Table 4.2
Electricity Demand Scenario Analysis for the World and Individual Continents, 2010–2050
Region
Electricity Demand (1000 TWh)
Share (%)
Growth Rate (%)
2010
2020
2030
2040
2050
2010
2050
2010–2050
Africa
8.7
12.8
18.8
28.9
38.0
40.7
52.0
3.8
Europe
5.4
6.2
7.8
9.4
9.5
25.0
13.0
1.4
North America
5.3
6.2
7.6
9.3
10.2
24.9
14.0
1.6
South America
1.1
1.6
2.3
3.7
5.1
5.0
7.0
4.0
Africa
0.6
1.0
2.0
4.5
9.5
3.0
13.0
6.9
Oceania
0.3
0.4
0.5
0.6
0.7
1.4
1.0
2.2
World
21.4
28.2
39.0
56.4
73.0
100
100
3.1
Despite a very high base of per capita electricity demand, North America, Europe, and Oceania will continue to experience growing power demand as the substitution of electricity for traditional fossil energy continues. By 2050, electricity demand per capita in North America, Europe and Oceania will have increased to 22,927, 13,398, and 12,835 kWh, respectively. In 2010–2050, the total electricity demand of the three regions is expected to grow at a yearly rate lower than the world average, accounting for a sharply lower share of the world’s total power demand.
In terms of growth rates, Europe, North America, and Oceania will see relatively low demand growth after the completion of the industrialization process, with annual growth of 1–2% between 2010 and 2050. In contrast, Asia, South America, and Africa will see faster growth in electricity demand at a yearly rate of more than 3% between 2010 and 2050, due to their population numbers and ongoing industrialization. Average annual growth in electricity demand in Africa, the least industrialized continent, is expected to almost double the level recorded in Asia, reflecting the combined effect of fast-growing industrialization and population. See Fig. 4.11 for the annual growth of electricity demand by continent between 2010 and 2050.
Figure 4.11Annual Growth Rate of Electricity Demand by Continents, 2010–2050
On a per capita basis, the world’s electricity demand is expected to be around 7650 kWh in 2050, slightly higher than Europe’s consumption per capita in 2010 and equivalent to that of the United States in 2010. By that time, following decades of relatively strong growth, Asia and South America will reach or come close to the world average in terms of per capita electricity consumption. Despite its fast growing demand, Africa’s electricity consumption per capita will only reach 52% of the world average by 2050, given the very low base it started from.
In Europe, Oceania, and North America, consumption per capita will continue to grow driven by a large consumer base and the potential of electricity substitution, but the margin with the world average will become significantly narrower. In 2010, per capita electricity consumption in Europe, Oceania, and North America was 2.3, 2.7, and 5.0 times the world average, respectively. In 2050, the figures are expected to fall to 1.8, 1.7, and 3.0 times, respectively, indicating a narrowing gap in per capita consumption around the world in the future. See Fig. 4.12 for the electricity consumption per capita in the world and individual continents in 2010 and 2050.
Figure 4.12Electricity Consumption Per Capita of the World and Individual Continents in 2010 and 2050
As an overall trend, the narrowing gap in electricity demand among different continents is apparently in line with the globalization process. Although the speed of narrowing varies with the natural growth of regional demand and the substitution rate of electricity for other energy forms, the overall share of developed countries and regions in global electricity demand will maintain a downward trend.
The factors affecting regional electricity demand are wide and varied, and there are divergent expectations as to the future electricity demand in selected regions. For example, the IEA is relatively conservative about the level of electrification improvement in Africa, expecting that by 2040, over 500 million people on the continent will still be denied access to electricity.6 In 2012, over 620 million people in Sub-Saharan Africa went without electricity, accounting for half of the world’s total population being denied access to electric power. Furthermore, with the benefit of increased power supply offset by rapid population growth, Sub-Saharan Africa will become the world’s only region with a population living without electricity. See Fig. 4.13 for information on Africa’s “powerless” population.
Figure 4.13Africa’s Population Without Access to Electricity by Country, 2012Source: Ref. [70].
A lack of power infrastructure has become a major hindrance to the development of Africa, amid its rapid economic expansion. According to IEA estimates, an investment of more than US$300 billion in electricity infrastructure is required for Sub-Saharan Africa to completely resolve the problem of power shortage by 2030. In recent years, China as well as the United States and European countries and regions have strengthened their investments in Africa’s electricity infrastructure. For example, China offered a US$20 billion loan to Africa in March 2013, with the greater part of the amount planned to go into building electricity infrastructure in support of the continent’s economic development. During his visit to Africa in July 2013, United States President Barack Obama proposed the Power Africa program to resolve the power shortage problem in Africa through an US$7 billion investment. With improvements in the global economy and the governance structure over the next few decades, Africa will see greatly improved popularity of power supplies and a significant reduction in its “powerless” population, with the growing development of electricity infrastructure.
4. Future Global Energy Development Structure
In 2050, global primary energy demand is expected to surge to 30 billion tons of standard coal, including electricity demand of 73,000 TWh. The need to meet such massive power and electricity requirements spells major changes to the development of energy worldwide. Particularly in a low-carbon development environment in response to climate change, the pace of clean substitution will quicken with a rising share of fast developing and utilized renewables in the energy mix to gradually replace fossil fuels, which will see increasingly lower levels of development and utilization, as the dominant energy source of the future. By 2050, global supplies of fossil energy are forecast to decrease to 6.3 billion tons of standard coal, down 57% from 2010, while global supplies of nonfossil energy are expected to skyrocket to 23.7 billion tons of standard coal, up 480%. As the dominant energy source, renewables will see a new pattern of global development focusing on the construction of bases supplemented by distributed generation, with accelerated efforts in building large bases of hydropower, wind, solar, and other renewable energy in the Arctic and equatorial regions and on each continent.
4.1. Overview of Energy Supply
As the dominant energy source of the future, clean energy will see accelerated development and it is expected that the generating capacity of global clean energy will reach 66,000 TWh (accounting for 90% of the world’s total generating capacity) in 2050. Here is a breakdown of clean energy as a share of global generation: solar and wind power (66%), hydropower (14%), biomass energy and others (approximately 10%), and ocean and nuclear energy (approximately 10%). Judging by the conditions of clean energy development on each continent,7 Asia’s share of global clean energy generation is expected to reach 49% by 2050, followed by a 16% share attributable to Africa as the most important region of solar energy development. See Fig. 4.14 for the global power supply structure in 2050 and Fig. 4.15 for each continent’s share of global clean energy generation in the same year.
Figure 4.14Global Power Supply Structure in 2050
Figure 4.15Share of Clean Energy Generation by Continents in 2050
Fossil energy generation will experience a sharp decrease. Fossil energy, mainly natural gas and coal-fired generation, is expected to account for approximately 10% of global electricity generation in 2050. In anticipation of the need to accommodate the system operational requirements of grid-connected, large-capacity wind, solar, and other renewable energy generation, a certain level of natural gas generation capacity will be retained while efforts continue to develop pumped storage capability. Dictated by its own level of development and the capacity of renewable energy generation, Asia will retain a relatively high level of natural gas and coal-fired generation in 2050. North America, owing to the mature technology and relatively low costs of developing shale gas and other unconventional gas resources, will retain a relatively high level of natural gas generation. See Fig. 4.16 for the change in the share of power generation attributable to fossil energy in 2010–2050. A breakdown of fossil energy generation by continent in 2050 is shown in Fig. 4.17.
Figure 4.16Changes in the Share of Fossil Energy Generation in 2010–2050
Figure 4.17Fossil Energy Power Generation by Continents in 2050
Distributed generation is an integral part of energy supply. Distributed generation worldwide is expected to reach 11,000 TWh in 2050, accounting for 15% of total power generation. Based on each continent’s development of distributed generation with reference to renewable energy resources, population and other factors, Asia’s share of global distributed generation is expected to reach 41% in 2050. Africa, blessed with favorable conditions for developing distributed generation of solar, hydropower, biomass, and other renewable energy, is expected to have a 27% share, ranking second among all continents. See Fig. 4.18 for a breakdown of distributed power generation by continent in 2050.
Figure 4.18Share of Distributed Generation by Continents in 2050
4.2. Large-Scale Clean Energy Bases on Each Continent
World continents are basically abundant in clean energy resources, such as hydropower, wind, solar, and ocean energy. The development of large-scale power generation bases in regions with favorable resource conditions can render strong support to the requirements of energy sustainability at the intracontinental or transcontinental level.
4.2.1. Asia
Asia, covering an area of over 44 million km2 (30% of the global land mass), is the largest continent in the world where water, wind, solar and other clean energy resources abound. Favorable water resource conditions are found mainly in the upper reaches of the Yangtze River and the Yalong Zangbo River in China as well as the Yenisei, Rivers Ob and Lena in the Russian far-east and Siberia. Wind power resources are mainly distributed in Mongolia, Central Asia, the “Three North” region (northwestern China, northern China, and northeastern China), as well as the Kara Sea, the Bering Strait, and the Kamchatka Peninsula in the Arctic region. Solar energy resources abound in Mongolia, Central Asia, the Middle East, and north-west China.
4.2.1.1. Renewable Energy Generation Bases in China
1.Hydropower bases in southwestern China. The technologically developable capacity of the country’s hydropower resources is estimated at about 570 GW, the great majority (82%) of which is concentrated in southwest China. As at the end of 2013, conventional hydropower stations in China boasted a total installed capacity of 280 GW, with the remaining technologically developable capacity of 290 GW concentrated in Sichuan, Yunnan, Tibet, and other areas. Large hydropower bases are to be built along the Jinsha River, the Yalong River, the Dado River, the Lanchang River, the Yalong Zangbo River, and the Nujiang River, carrying a total installed capacity of over 260 GW. See Fig. 4.19 for the distribution of hydropower bases in China.
2.Wind power bases in the “Three North” region. In China, onshore wind resource potential at 80 m height with a wind power intensity of above 150 W/m2 is estimated at 10,200 GW; wind resource potential over Grade 3 in near-shore areas with a water depth of 5–25 m and at 50 m height (wind power intensity ≥300 W/m2), at 200 GW. The “Three North” region accounts for approximately 80% of China’s national total of onshore wind resources. The distribution of China’s wind power resources is shown in Fig. 4.20.
3.Solar energy generation bases in northwestern China. The annual solar radiation falling on China’s land surface is estimated at the equivalent of 4.9 trillion tons of standard coal. In particular, the Qinghai–Tibet Plateau, northern Gansu, northern Ningxia, southern Xinjiang, the Gobi Desert, and other desert areas are blessed with the most abundant solar resources, with strong development potential estimated at over 85,000 TWh per year or approximately 75% of the nation’s total solar energy reserves. With favorable conditions for development, large-scale solar energy generation bases can be established to transmit power to load centers in eastern and central China. The distribution of China’s solar energy resources is shown in Fig. 4.21.
Figure 4.19Distribution of Hydropower Bases in China
Figure 4.20Distribution of China’s Wind Power ResourcesSource: SGCC, Wind Power Development Promotion White Paper by SGCC, 2011.
Figure 4.21Distribution of China’s Solar Energy ResourcesSource: CMA Wind and Solar Energy Resources Center.
4.2.1.2. Wind Power Bases in North Russia and Hydropower Bases in Siberia, the Russian Far-East
1.Wind power bases in north Russia. Russia is endowed with abundant wind power resources, largely along the coast of the Arctic Ocean in the Arctic region. Technologically developable wind power capacity in the region from the Kamchatka Peninsula to the Bering Strait is estimated at more than 7000 TWh per year,8 compared with an estimated 3400 TWh per year8 for the Kara Sea and its coastal regions, based on approximately 4000 h of utilization. With its huge potential, the Arctic region in Russia holds great promise as Asia’s major base of wind power to be. See Fig. 4.22 for a wind speed map of Russia (based on satellite-based observations).
2.Hydropower bases in the Russian far-east and Siberia. The water resources in Russia available for large-scale development are located chiefly along the Lena River, the Yenisei, the River Ob, and the Amur River (the section in China is known as the Heilongjiang River) in the Russian Far East and Siberia. Out of an economically developable capacity of over 700 TWh/year, 500 TWh/year has yet to be developed. See Fig. 4.23 for the distribution of Russia’s major river basins.
Figure 4.22Wind Speed Map of Russia (Based on Satellite-Based Observations)
Figure 4.23Distribution of Russia’s Major River Basins
4.2.1.3. Wind, Solar, and Hydropower Bases in Central Asia
1.Wind power bases in Central Asia. Wind power resources in Central Asia are mainly distributed in Kazakhstan, with a technologically developable capacity of approximately 1800 TWh. Wind power resources are most abundant in Atyrau and Mangistau near the Caspian Sea, centrally located Astana and Karaganda, and regions in the south, where large wind power bases can be built in the future. See Fig. 4.24 for the distribution of wind power resources in Kazakhstan.
2.Solar power bases in Central Asia. Central Asia has an annual irradiation intensity of 1300–1800 kWh/m2. In the eastern and southeastern parts of Turkmenistan where the terrain is flat, an annual irradiation intensity that often exceeds 1800 kWh/m2 is recorded, reaching 70–80% of the comparative figure for the Sahara Desert in Africa. Solar energy resources abound in South Kazakhstan, Kyzylordinskaya, the coastal regions of the Caspian Sea, and southeastern Uzbekistan, where conditions are favorable for the development of solar power stations. See Figs. 4.25–4.27 for the distribution of solar energy resources in Turkmenistan, Kazakhstan, and Uzbekistan.
3.Hydropower bases in Central Asia. Hydropower resources in Central Asia are chiefly distributed in Kyrghyzstan and Tajikistan, the former with a technologically developable capacity of about 150 TWh/year, compared with the latter’s approximately 260 TWh/year. Large hydropower bases can be built there in the future to supply power to surrounding countries.
In Mongolia, the technologically developable capacity of wind power is estimated at 2500 TWh/year, while solar power potential is estimated at 3400 TWh/year. These resources are concentrated in Mongolia’s southeastern regions. Wind power resources on over 10% of Mongolian land receive an “excellent” rating, while wind power resources on over 40% of Mongolian land are rated between “average” and “good.” The country’s southern and eastern regions see the highest concentration of wind power potential, whereas solar energy resources are mostly located in the central and southern regions of Gobi, where conditions are suitable for building large solar power bases with an annual irradiation intensity of 1200–1600 kWh/m2. Given the country’s relatively low power load, virtually all wind and solar energy to be developed locally can be exported. Renewable energy produced in Mongolia is mostly delivered to Northeast Asia, with a transmission distance of less than 2500 km. See Figs. 4.28 and 4.29 for the distribution of wind and solar energy resources in Mongolia.
Figure 4.28Distribution of Wind Energy Resources in MongoliaSource: Wind Energy Resources Map by the US National Renewable Energy Laboratory; data from AWS TruePower.
Figure 4.29Distribution of Solar Energy Resources in MongoliaSource: 3TIER Wind and Solar Energy Resources Evaluation Company.
4.2.1.5. Solar Power Bases in the Middle East
Solar energy resources abound in the Middle East, especially in Saudi Arabia and Yemen with an annual irradiation intensity of over 2500 kWh/m2. The annual irradiation intensity in Iran, Oman, the United Arab Emirates, Jordan, and other countries exceeds 2100 kWh/m2. The technologically developable capacity of solar energy in the Middle East is initially estimated at over 100,000 TW/year. See Fig. 4.30 for the distribution of solar energy resources in the Middle East.
A southern Asian country, India provides favorable sunlight conditions for solar power generation. Gujarat and Rajasthan in the west boast the most abundant solar energy resources, with an annual solar irradiation intensity of over 2100 kWh/m2, followed by central and southern regions with a sunlight intensity of 1850–2100 kWh/m2. These regions are expected to become home to large solar energy bases in the future. The distribution of solar energy resources in India is shown in Fig. 4.31.
India’s total wind power resources are estimated at about 100 GW. Quality resources are located predominantly in the western states of Gujarat and Rajasthan, as well as the southern region and eastern coastal areas, usually with a wind power intensity of 250 W/m2. The best wind energy resources are found near the southern state of Kerala, with a wind power intensity of over 350 W/m2. The distribution of wind power resources in India is shown in Fig. 4.32.
With an area of over 10 million km2, Europe boasts relatively rich wind and solar energy resources. Wind resources are predominantly located near the North Sea, Greenland and its surrounding waters further north, the Norwegian Sea, and the Barents Sea. Solar resources are mainly distributed along the coasts of the Mediterranean Sea in the south.
4.2.2.1. Wind Power Bases in Greenland
Greenland and its surrounding waters occupy an area of 2.63 million km2, with a wind power intensity of over 300 W/m2 at 70 m height,9 and a technologically developable capacity of wind energy of about 32.5 TW.10 The annual average wind across the Greenland Sea south of Greenland carries a maximum speed of 12–14 m/s; the annual average wind speed in the north is relatively low, at 7–10 m/s. The annual average wind speed in the northwest is about 5–7 m/s; the wind speed near the sea is quite low. The wind power intensity in the west, east and south of Greenland is high, while that along the coast is quite low. In winter, the wind power intensity of over 50% of Greenland is higher than 400 W/m2. Wind power is stronger in the west in spring and also stronger in the east in autumn. Seasonally, average wind speed and wind power intensity move in the descending order of winter > autumn > spring > summer.
4.2.2.2. Wind Power Bases in the Norwegian Sea and the Barents Sea
Lying to the east of Greenland in the Arctic Ocean, the Norwegian Sea, and the Barents Sea are regarded as the second windiest place in the Arctic region, with an annual average wind speed of 9–10 m/s, second only to that of the Greenland Sea.
4.2.2.3. Wind Power Bases in Europe’s North Sea Region
In the North Sea region, annual average wind speed at 60 m height is estimated at 8 m/s, with the region’s wind power resources amounting to 30,000 TWh/year. Coastal wind power resources are especially abundant in the United Kingdom, Denmark, Germany, and the Netherlands. Based on an installed capacity of 6000 kW/km2, the United Kingdom’s highest offshore wind power potential reaches 986 TWh/year, compared with 24 TWh/year for Belgium, 136 TWh/year for the Netherlands, 237 TWh/year for Germany, and 550 TWh/year for Denmark.11 Large wind power bases can be built offshore in the future to supply power to the domestic markets and countries in central-southern Europe. See Fig. 4.33 for the wind power development in the North Sea.
Figure 4.33Wind Power Development in the North SeaSource: Friends of the Supergrid, the first phase of the European supergrid.
4.2.2.4. Solar Energy Bases in South Europe
South Europe consists of the Iberian Peninsula, the Apennine Peninsula and south Balkan Peninsula, covering 17 countries on a total area of about 1.66 million km2. It is also known as Mediterranean Europe for its proximity to the Mediterranean. It has an annual average irradiation intensity of 2000 kWh/m2, with a technologically developable solar capacity of approximately 2600 TWh/year. Teeming with solar energy resources, Portugal, Spain, Italy, Greece, and Turkey provide favorable conditions for building large solar energy bases. The distribution of solar energy resources in South Europe is shown in Fig. 4.34.
North America, covering a territory of over 24 million km2 or 16.2% of the world’s total land area, is the third largest continent in the world. Its topography is characterized by mountain ranges lying far apart in the west and in the east that run north–south in alignment with the coastlines. The Great Plains are situated in the middle of North America. Wind power resources are most abundant in the Midwest while solar energy resources are concentrated mainly in the American Southwest and northern Mexico.
4.2.3.1. Wind Power Bases in the Midwest
Wind power resources in North America are concentrated mainly in North Dakota, South Dakota, Montana, and Wyoming in the Midwest. Based on a capacity coefficient of over 30% at 80 m height, the technologically developable wind power capacity in the US is estimated at approximately 33,000 TWh/year.12 Offshore wind resources in the United States are mainly distributed along the coastal areas in the east and west. Based on 830,000 km2 of offshore areas within 50 nautical miles from the coast and with a wind speed of over 7.0 m/s at 90 m height, the technologically developable wind power capacity is estimated at approximately 17,000 TWh/year. The flat and open terrain of the Central United States, with an annual average wind speed of over 7 m/s and abundant wind resources, creates ideal conditions for the development of large wind power bases. See Figs. 4.35 and 4.36 for the annual average onshore wind power intensities and the distribution of average wind speeds in the United States.
Figure 4.35Distribution of Annual Average Onshore Wind Power Intensities in the United StatesSource: Wind power data and map formulated by Pacific Northwest National Laboratory, courtesy of the National Renewable Energy Laboratory.
Figure 4.36Distribution of Annual Average Onshore Wind SpeedsSource: Wind Energy Resources Map by National Renewable Energy Laboratory; data from AWS TruePower.
4.2.3.2. Solar Power Bases in the American South-West
Abundant solar energy resources in the United States are predominantly located in the south-west, covering Arizona, New Mexico, California, South Nevada, and other states. Considering the ratio of land suitable for development and also generation efficiency, technologically developable capacity is estimated at approximately 254,000 TWh/year. See Fig. 4.37 for the distribution of solar energy resources in the US.
The annual solar irradiation falling on over 80% of Mexican territory has an intensity of over 2,000 kWh/m2, providing suitable conditions for building large solar energy generation bases with a technologically developable capacity of about 78,000 TWh. The Baja California Peninsula west of the Gulf of California enjoys the highest annual irradiation intensity at above 2300 kWh/m2. The distribution of solar energy resources in Mexico is shown in Fig. 4.38.
In Canada, the technologically developable capacity of hydropower resources is estimated at about 262 GW,13 with 160 GW under development planning in Quebec in the east (44 GW), Ontario (10 GW), British Columbia (33 GW), Alberta (12 GW), the Yukon (GW), and the Northwest Territories (16 GW). The country’s main rivers include the St. Lawrence River, the Nelson River, and the Columbia River. Hydropower development and bases are mainly located in the provinces and regions near the United States border. The distribution of Canada’s major rivers is shown in Fig. 4.39.
Figure 4.39Distribution of Canada’s Major Rivers
4.2.4. South America
Occupying over 17 million km2, South America is situated in the southern part of the Western Hemisphere, separated from North America by the Panama Canal. In this region, the Andes Mountains, several kilometers high, tower over the west, with plains lying to the east, including the Amazon rainforest. Abundant solar energy resources are distributed west of the Andes Mountains, covering countries such as Peru, Chile, and Bolivia. Water resources are concentrated in the Amazon and other river basins in Brazil.
4.2.4.1. Solar Power Bases Along the East and West Coasts
Solar energy resources in South America are found mainly along the east and west coasts of the continent, especially in the Atacama Desert.14 Reputed as one of the world’s most solar-resource abundant regions, South America has an annual solar irradiation intensity of over 2,300 kWh/m2 with a technologically developable capacity of some 15,000 TWh/year. Chile and Peru own the most abundant solar energy resources, where large solar power bases can be built. The distribution of solar energy resources in South America is shown in Fig. 4.40.
4.2.4.2. Hydropower Bases in the Amazon and Parana River Basins
Hydropower resources in South America are concentrated mainly in major rivers in Brazil, including the Amazon and the Parana River. Brazil’s technologically developable hydropower capacity is estimated at 245 GW.15 In 2012, it boasted an installed hydropower capacity of 83 GW, accounting for 1/3 of the technologically developable capacity, with about 162 GW yet to be developed. With a technologically developable potential of about 120 GW, the Amazon and Parana River Basins offer favorable conditions for building large hydropower bases to supply electricity to the load centers in the east and meet intracontinental power demand. Opportunities are available for joint development of solar, ocean, hydropower and other renewable resources to improve capacity utilization of renewables. See Fig. 4.43 for the distribution of hydropower resources in Brazil.
Figure 4.43Distribution of Hydropower Resources in BrazilSource: IEA, World Energy Outlook 2013.
4.2.4.3. Wind Power Bases in Northern and Southern Regions of South America
With an average wind speed of about 8–9.5 m/s at 80 m height, wind power resources are more abundant in Venezuela and the island states of Cuba and Dominica in the Caribbean north of South America, as well as Argentina and southern Chile near the Antarctic region. See Fig. 4.44 for the distribution of wind power resources in South America.
Africa, measuring over 30 million km2 or 20% of the world’s total land area, is the second largest continent, stretching 8000 km from south to north and 7403 km from east to west. The continent’s abundant solar energy resources lie mainly in the north, east and south. Its water resources are also among the world’s richest, distributed mainly along the Congo River, the Nile River, and the Zambezi River. Wind power resources are concentrated mainly on the eastern and northwestern coasts of the continent.
4.2.5.1. Solar Power Bases in Africa
Africa16 has one of the world’s highest solar irradiation intensities. The potential for solar energy generation is huge in Morocco, Algeria, Tunisia, Libya, and Egypt. In Algeria, Morocco, and Egypt, the solar irradiation intensity is 2700, 2600, and 2800 kWh/m2, respectively, compared with over 2500 kWh/m2 for Tunisia and Libya. North Africa’s technologically developable solar energy capacity is expected to reach as much as 141,000 TWh/year, compared with about 187,000 TWh/year for East Africa. Among others, Sudan, Ethiopia, Kenya, and Somalia have abundant solar energy resources, with an annual solar irradiation intensity of over 2200 kWh/m2. Namibia, South Africa, Botswana, Angola, Zimbabwe, and other countries also teem with solar energy resources, with an annual solar irradiation of above 2400 kWh/m2.
Favorable conditions exist in North Africa, East Africa, and the southern region of Africa for developing large solar power bases. The distribution of solar energy resources in Africa is shown in Fig. 4.45.
Africa has abundant hydropower resources, with a technologically developable capacity of about 1840 TWh/year or about 12% of the global total, surpassed only by Asia, South America and North America. Among different regions of the continent, North Africa and Southern Africa have seen a relatively higher level of hydropower development, while the central African region where water resources are abundant is least developed, with a less than 2% level of development and utilization along the Congo River. In 2011, the total installed capacity of established hydropower stations in Africa amounted to about 27 GW,17 representing 6% of its technologically developable capacity. There is huge potential for hydropower development, especially along the Congo River, the Nile, and the Zambezi River. The theoretical hydropower reserves along the whole Congo River amount to 390 GW, ranking first among the world’s major rivers.18 In the short to medium term, development efforts are focused on the Congo River where 52 generating units of 750 MW under Phase 4 of the key Grand Inga hydropower project are being planned to provide a total installed capacity of 39,000 MW. Hydropower generation in Africa is intended mainly for local consumption, with room for joint development and consumption with solar and wind power projects in North Africa and East Africa as well as solar and ocean energy projects in southern Africa. The location of the Grand Inga hydropower project is shown in Fig. 4.49.
Figure 4.49Location Map of Grand Inga Hydropower Project
4.2.5.3. Wind Power Bases in Eastern and Northwestern Africa
African wind power resources are concentrated mainly in the east and northwest. The annual average wind speed is over 7 m/s in Somalia (and its coastal areas), Ethiopia and Kenya in the east, as well as Western Sahara and Mauritania in the northwest. In near-shore areas, an annual average wind speed of over 10 m/s is recorded, providing favorable conditions for the development of large onshore or offshore wind power bases. The distribution of wind power resources in Africa is shown in Fig. 4.50.
Oceania, covering an area of about 9 million km2, is the world’s smallest continent. Accounting for approximately 7.7 million km2 or over 85% of Oceania, Australia is endowed with evenly distributed solar energy resources. Wind power resources are concentrated largely along coastal areas.
Australia has a technologically developable solar energy capacity of over 250 trillion kWh/year. The low-lying areas at the center and the vast expanse of sparsely populated highlands in the west are all arid deserts that account for about 20% of the continent’s total area, with ideal conditions for large-scale development of solar energy resources. Category-1 solar-resource areas are mainly distributed in the north (accounting for about 54% of Australia’s total land area); Category-2 areas are concentrated in the center (accounting for about 35% of the country’s total land area). Category-1 and Category-2 areas combined represent 90% of Australia’s territorial land. See Fig. 4.51 for the distribution of solar energy resources in Australia. Australia’s solar-resource areas and annual solar irradiation intensities are described in Table 4.3.
Australia’s Solar-Resource Areas and Annual Solar Irradiation Intensities
Resource Area Classification
Coverage
Annual Irradiation Intensity (kWh/m2)
Cat-1
Northern region, 54%
2100–2400
Cat-2
Central region, 35%
1800–2100
Cat-3
Southern region, 8%
1500–1800
Cat-4
Other regions, 3%
<1500
Australia’s wind power resources are mainly distributed in its northeastern and southeastern regions as well as coastal areas in the southwest. The annual average wind speed at 80 m is over 8–9 m/s in many coastal areas, where favorable conditions exist for the construction of large-scale offshore or near-shore, land-based wind power bases. The distribution of offshore wind power resources in Australia is shown in Fig. 4.52.
Distributed energy refers to a system capable of power production/storage and also heat production/utilization while at the same time providing integrated utilization and control of energy. Distributed energy is generally located on the customer side to meet user demand. Normally integrated into or connected to a distribution grid or operated as a standalone unit, distributed energy represents an integrated energy system covering energy production, storage and control. Currently, the major developed nations of America and Europe are taking the lead in distributed energy development. Energy resources in the United States are distributed evenly across different regions, a positive factor for distributed energy development that has contributed to the rapid growth of distributed generation in the United States in recent years. In 2012, small hydropower, wind and solar photovoltaic projects (each under 1 MW) in the United States provided installed capacities of distributed generation of 120, 260, and 550 MW, respectively, demonstrating noticeable year-on-year growth. On average, distributed generation in European Union countries currently accounts for a 10% share of the electricity market. With limited room for growth due to land acquisition, environmental protection and other constraints, onshore wind power development in Europe is gradually giving way to focused development of offshore wind power. In the developed nations of Europe, most residential accommodations are detached, low to medium rise buildings, which create favorable conditions for the development of rooftop photovoltaic projects.
The distributed energy system is valued internationally for its gradient utilization capability and high efficiency. Operating on a small scale, it mainly targets residential customers. In the future, distributed energy can provide a useful backup for large grids by taking advantage of the availability and economics of resources in load centers. Future distributed generation is expected to take the form of microhydropower projects, distributed wind and solar power systems, biomass energy generation, and energy storage systems. In particular, Europe, Asia, North America, and South America are well-placed to develop distributed energy systems based on biomass generation on account of their dense populations as well as the massive availability of urban garbage and forestry and agricultural wastes. In solar energy development, as solar energy resources are extensively distributed across continents, distributed solar energy systems will become the focus of development against a background of sophisticated smart grid development, major breakthroughs in energy storage technology, and rapid urbanization. Taking into account land utilization, resources, and other factors, distributed wind power generation will form part of a distributed energy system incorporated with solar, energy storage and other power generation capability to supply electricity to remote areas. In 2050, annual distributed generation is expected to reach 3.5 billion tons of standard coal, or 15% of the world’s total electricity generation and approximately 11.5% of primary energy consumption. Solar energy is the most important means of distributed generation, accounting expectedly for about 54% of total distributed generation, followed by hydropower (21%). See Fig. 4.53 for the structure of distributed power generation in 2050.
Figure 4.53Structure of Distributed Power Generation in 2050
4.4. Development and Utilization of Fossil Energy
The development of fossil energy will be strictly controlled in a bid to address climate change and reduce carbon emissions. Oil and coal production is expected to peak in 2020 or thereabouts. Natural gas production will reach a peak around 2030. Around 2050, the production levels of oil, gas and coal will be at one-third, one-half, and one-fifth of their peak values, respectively. In the meanwhile, fossil energy trade at the transcontinental level will ease back after an initial rally.
4.4.1. Oil
The focus of oil production is shifting to countries in the Western Hemisphere, accompanied by a sharp decline in North America’s demand for imported crude oil from the Middle East and Africa. The Western Hemisphere’s increasing unconventional oil reserves have provided solid support to oil production in the hemisphere. Traditionally, resource-rich countries, including Russia in the Eastern Hemisphere19 and nations in Central Asia, the Middle East, and North Africa, have been part of a major north–south hub of oil and gas supply focusing on conventional resources. In contrast, the reserves and production levels of conventional oil and gas in the Western Hemisphere are far lower compared with the Eastern Hemisphere. As at the end of 2011, the Western Hemisphere’s oil accounted for a 32.7% share of the world’s total remaining proven reserves, compared with 9.3% for natural gas. The hemisphere’s oil production accounted for 25.5% and natural gas of 31.65% of the world total. In recent years, advancing technologies have brought both economic and technological breakthroughs to unconventional oil and gas resources, turning oil sands in Canada, shale oil in the United States, extra-heavy oil in Venezuela, deep-water oil in the Gulf of Mexico and Brazil, and shale gas and coalbed methane in North America into an important source of backup for oil and gas resources. Benefiting from the production of unconventional oil resources, oil production in North America is expected to show average annual growth of 0.9% between 2012 and 2030, slightly above the global average of 0.8%. In the meantime, due to sharply higher oil sands and shale oil production levels, Canada’s oil production is expected to grow 2.1%, far above the global average of 0.3%. Benefiting from Brazil’s deep-water oil production and Venezuela’s extra-heavy oil production, South America’s oil production is expected to show average annual growth of 2.5%, driven by 4.5% growth in Brazil’s deep-water oil production and 2.5% growth in Venezuela’s extra-heavy oil production. The Middle East will remain the world’s largest oil supplier, expected to account for one third of the global total in 2030, rising to 60% in 2012–2030.
The center of oil consumption is shifting to Asia and the Middle East. Asian countries will continue to be the major driver of oil demand by 2030, expected to account for two thirds of the world’s new oil demand, with China as the most important factor. However, growth of China’s oil consumption will slow over time, from average annual growth of 3.7% before 2020 to 1.3% between 2020 and 2030. The Middle East has one of the world’s lowest oil and diesel prices, where subsidies of petroleum product prices have contributed to fast growing oil demand, expected to reach 1.6%. As Central and Southern America and Africa remain essentially in the developing world, oil demand is expected to grow fast before 2030, then slowing down and finally reaching peak consumption around 2050 before starting to fall again. Contrary to this trend, oil demand in Europe and North America in 2030 is expected to drop dramatically from 2012, reflecting subdued energy demand in transport because of improved car efficiency, high taxes on oil, and slow population growth.
In 2030, North America and Europe will see a falling share of the Middle East’s oil exports while the Asia Pacific region’s share will go up. In the same year, the world’s major oil importers include Europe and the emerging economies of China and India, while the major oil exporters are the Middle East, Russia, and central and southern America, reflecting transcontinental oil trade equivalent to 300 million tons of standard coal. By 2050, global oil demand will have fallen to one-third of 2030 levels, reflecting the impact of large-scale development and utilization of clean energy. In addition, due to the growing development and utilization of unconventional oil resources, local energy demand can basically be met by local production, which will drive global oil trade further down. See Fig. 4.54 for the global flows of oil.
Figure 4.54Global Oil Flows
4.4.2. Coal
The Asia–Pacific region has been fuelling global coal consumption, which will peak around 2020 before gradually slowing down. The region’s vibrant economy has triggered enormous demand for energy and compared with oil and gas resources, the region is more abundant with coal resources. In particular, China, India, and Australia rank among the world’s top nations in terms of coal reserves. With the progress of clean coal technology, countries in the Asia–Pacific region face the realistic option of raising coal-mining capacity to meet higher energy demand. China and India will remain two major coal consumers, collectively accounting for 64% of the world’s total coal demand in 2030, up from 58% in 2011. China will see coal production increment before 2020, due to the impact of the country’s economic restructuring process. In comparison, coal consumption will peak sometime later in India where local coal demand cannot be satisfied by domestic supply and has to be met by imports. After 2020, India is expected to surpass China and become the world’s largest coal importer, importing three times as much coal in 2030 as now. Benefiting from growing coal consumption and import in China and India, other Asia–Pacific countries like Australia, Vietnam, Mongolia, and Indonesia will expand coal production substantially. By 2030, Australia’s coal production is expected to jump 50%. The Asia–Pacific region’s overall share of global coal production will remain steady at 70%.
Based on regional coal demand forecasts and the future scale and speed of clean energy development, global coal trade is expected to peak by around 2020. Among the major coal importers are Asia’s emerging market countries and Europe, expected to import the equivalents of 700 million tons and 100 million tons of standard coal, respectively. Among the major coal exporters are Indonesia, Australia, the United States, Russia, and South Africa. Coal trade will shrink gradually after 2020. See Fig. 4.55 for the global flows of coal.
Figure 4.55Global Coal Flows
4.4.3. Natural Gas
Overall, North America will switch from the position of a net natural gas importer to one of a net natural gas exporter. The LNG originally intended for export to the United States will then be shipped to the Asia–Pacific region and Europe. As North America has already secured a leadership position in terms of technology and management capability in shale gas development, the United States and Canada will account for a substantial 80% share of the world’s total unconventional natural gas production. However, in response to public concerns about the possible environmental pollution caused by hydrofracturing, a technology used to extract shale gas, the United States will see slower growth in the production of unconventional natural gas to stabilize at around 600 billion cubic meters per year after 2020. Encouraged by the maturity and application of mining technologies, more countries will jump on the natural gas bandwagon after 2020, ushering in a period of strong growth in this area of production in China, Argentina, and Australia. Currently, the United States natural gas market is suffering from oversupply and high inventory. As the United States shifts gradually to the position of LNG exporter, traditional LNG exporters will refocus its export efforts on Europe and the Asia–Pacific region instead of the United States.
The Asia–Pacific region will become the world’s most important natural gas market, with China, Japan and India as major consumers and Australia, Indonesia, the Middle East, and Russia as the major exporters. Over the coming decades, Asia–Pacific will see the most profound changes in the natural gas market. To address the need for energy supply diversification and environmental protection, Asia–Pacific countries, other than Japan and South Korea, will see great upside potential in natural gas consumption, with average annual growth of about 4% expected before 2050. China and India will each witness growth of around 5%. Limited by insufficient natural gas reserves, the Asia–Pacific region has an urgent and significant demand for gas imports from Australia and Indonesia in the region, and the Middle East, Russia, South Africa, South America, and North America elsewhere.
Global natural gas trade is expected to peak around 2030, with trade at the transcontinental level amounting to approximately 500 million tons of standard coal before easing back with declining demand. In 2050, a balance of supply and demand at the intracontinental level will materialize on limited global trade volume. See Fig. 4.56 for the flows of natural gas around the world.
Figure 4.56Global Flows of Natural Gas
5. Global Electricity Flow
Through execution of the “two-replacement” policy, particularly through the development of large-scale energy bases in the Arctic and equatorial regions as well as five continents, a globally-interconnected clean energy system focusing on electricity is gradually taking shape, leading to significantly expanded electricity flows and longer transmission distances around the world.
5.1. Reasoning and Principles Behind Global Electricity Flow
Global electricity flows carry technological, economic, resource and environmental implications, involving energy production, consumption, distribution, and other factors. Any study of global electricity flows should be guided by “four principles” and a “coordinated view at three levels.”
The four principles, the first being the principle of low-carbon development. A consensus has basically been reached among governments around the world on the potential threat of climate change to human sustainability. As low-carbon and clean development has evolved into an inexorable trend in global energy development, major countries have been setting low-carbon targets oriented towards clean energy. Any study of electricity development across continents and global electricity flows should take low-carbon development as a nonnegotiable constraint. The second is the “locals first” principle. Every continent is abundant with renewable energy resources, including water, wind, solar, biomass, and ocean power, developed on a centralized or distributed basis to meet power demand locally or from load centers near the source of generation. In terms of reliability and economic performance, this mode of development and utilization compares favorably with the delivery of electricity across nations or continents. These resources should therefore be accorded priority for development and utilization. The third is the principle of economic benefit and high efficiency. Any plans to develop major renewable energy bases in the Arctic/equatorial regions and elsewhere as well as long-distance transmission capability, must take account of both development and transmission costs, by comparing the cost required to bring electricity to a receiving region with the cost of local generation and supply. The result of this comparison should form the basis for optimizing a decision on the capacity and direction of transcontinental transmission. The last is the principle of technological feasibility. In the design of global interconnections, care should be exercised to avoid building transnational/transcontinental interconnections and transmission channels over high mountains or long undersea distances. Generally, transcontinental interconnections are supported by UHV DC grids and intracontinental/domestic interconnections, by UHV AC or UHV DC grids.
Coordinated view at three levels: the first is a coordinated view of centralized and distributed clean energy development. Depending on the level of resource endowment, global clean energy can generally be categorized into two major types. One is quality resources, abundantly available per unit area, with long utilization hours, low costs, and positive economics. The regions with quality resources are usually regions with strong solar radiation or high annual average wind speeds, relatively sparse population, and far from load centers. For these regions, it is common to adopt centralized development and provide large-scale grid transmission and allocation over extensive areas. The other type of clean energy is resources of a general nature, mostly distributed around load centers, with mild sunlight conditions and wind speeds, dense population, and agreeable climate. In this case, distributed development is usually adopted to provide electricity for local supply and consumption. In the future, electricity demand may partly be satisfied by energy generated from rooftop photovoltaic, biomass, small hydropower, and other distributed sources. But more energy will come mainly from large clean energy bases located far away from load centers but with good resources. Such bases are an integral part of global electricity flows. At the second level, a coordinated view is required of clean energy development locally and in remote areas. Any study of the future capacity and transmission direction of global electricity flows must take into account the electricity demand from each continent and major countries, renewable resource endowment and development goals, the feasibility of energy channels, and the cost of transmission technology. Currently, renewables-based generation like solar and ocean power is not as competitive as fossil energy in terms of economic benefit and efficiency. Only the economics of wind power are comparable to those of conventional fossil-fueled generation. In order to reduce the total social costs of electricity usage, priority should be given to renewable resources with good development conditions and short transmission distances. With technological advancement and continued environmental and carbon constraints, the development and environmental costs of fossil energy utilization will increase while, in contrast, the advantages of clean energy generation will manifest themselves more strongly. As a result, the scope of clean energy development will expand to cover renewable resources in remote locations. Electricity flows will also extend gradually from a transnational to transcontinental basis and further to a global level. At the third level, a coordinated view should be taken of energy balances at the intracontinental level and mutual support in energy flows across continents. Firstly, the space and demand for renewable energy development on each continent should be analyzed based on the present situation of electricity development and future demand as well as clean energy development goals of the major countries on each continent in order to clearly define the major power-receiving regions and markets around the world. This should be followed by a further study of the development potential of large energy bases in the Arctic and equatorial regions and elsewhere, with reference to the supply economics based on transmission costs, so as to define the supply capacity and costs of clean energy bases in the future. On this basis, subject to the objectives of low-carbon development and optimizing supply economics, a number of clean energy options are available but priority should be accorded to developing and utilizing renewable energy resources with favorable conditions for local development. Consideration should then be given to clean energy access for large-scale renewable energy bases, with reference to transmission channels and supply economics, so as to determine the capacity of global electricity flows through multichannel delivery and reception and work out the supply and demand balance and the levels of sending-out/reception capacity for each continent.
See Fig. 4.57 for the reasoning framework for an analysis of global electricity flows.
Figure 4.57Reasoning Framework for Analyzing Global Electricity Flows
5.2. Overview of Global Electricity Supply
In the future, the internal and external costs of developing and utilizing conventional fossil energy will show an upward trend, with the growing development costs and ever-more stringent low-carbon clean energy and safety requirements. The generating costs of wind, solar, and other renewables will decline rapidly with higher levels of utilization. After the intersection of the generating cost curve of fossil energy with that of renewable resources, the cost of renewable energy generation will be lower than that of fossil energy generation. The falling costs resulting from improved economies of scale will in turn lead to more capacity being developed in a virtuous cycle of growing capacity and lowering costs, thereby creating enormous room for renewable energy growth. In the foreseeable future, renewable energy will become the driving force behind installed capacity building to meet new electricity demand around the world and fill the capacity shortfall arising from the decommissioning of fossil-fuelled generating units.
Judging by the changing trend of generating costs among different energy options, the generating cost of onshore wind power in regions with better resources is competitive with fossil fuel generation. As generating costs fall further with improved economies of scale, wind power may become even more competitive. Despite its generally better resource conditions than onshore wind power, offshore wind power involves higher construction and maintenance costs. With the progress of generation technologies, ever-falling materials and manufacturing costs, and improving conversion efficiency, the cost of solar power generation will maintain a downward trend, making solar power the most important source of renewable energy generation in the future. Currently, hydropower generation is more cost-competitive than other energy resources. However, as quality resources are being depleted in regions with favorable conditions for development, accompanied by a continued shift of hydropower development into remote areas, the cost of developing and transmitting hydropower resources will continue to rise, depending on infrastructure and development conditions. In addition, ecological problems in regions with hydropower facilities will continue to haunt hydropower development in the long run. Driven by rapid growth, hydroelectric power is expected to maintain its position as the dominant source of renewable power generation until 2030. After 2030, hydropower will move into a period of sluggish growth. Currently, the cost of coal-fired generation is higher than that of most renewables. In the future, however, the internal as well as external environmental costs of coal-fired generation will increase and lead to steadily higher supply costs, due to more stringent emission control requirements governing coal-fired plants, the internalization of external costs, and coal resources of average quality beginning to be developed and utilized. Currently, ocean energy is more expensive, at a generating cost of approximately RMB 6 per kWh. Subject to restrictive development conditions and a lack of technology breakthroughs, the cost of ocean power generation will consistently be higher than that of nonhydropower renewables and conventional fossil fuels. For this reason, ocean energy holds limited promise for the future. As an important clean energy alternative, nuclear power is well-placed to play a vital role in low-carbon energy development. But given the nature of nuclear power as an energy source with a very low risk of accidents but potentially huge damage if something goes wrong, the cost of safety investments will rise continuously, translating into spiraling generating costs. Dictated by the way organic materials are collected and supplied and also the use of these materials for power generation in competition with other purposes, biomass generation offers limited room for technological improvement. As costs are unlikely to fall, the cost of biomass energy generation is expected to stay relatively high. As regards wind energy, the supply (including generation and transmission) costs of wind power in the Arctic region are expected to become more economically competitive in power-receiving regions after 2035, given the anticipated breakthroughs and upgrades of wind generation, materials and transmission technologies in extremely cold regions.
In the long run, solar energy and wind power will assume a dominant role in the electricity supply structure, made possible by a sharp decline in supply costs. Judging by the change in cost trends and with the progress of the “two-replacements” policy, solar energy (including photovoltaic and photothermal) is expected to share a dominant role in the world’s generation mix with wind power by 2050, accounting for 35% and 31%, respectively. Restricted by the availability of resources, hydropower is expected to account for 14% or so of total electricity generation by 2050, compared with a 6% share for biomass energy and others (mainly including geothermal energy). It is expected that natural gas and coal-fired generation amounting to approximately 10% of total power generation will also be required to meet the operational requirements of power systems and cater to the affordability of some of the underdeveloped regions of Asia, Africa, and South America.
See Figs. 4.58 and 4.59 for the power generation by energy type in future target years and the generation mix in 2050.
Figure 4.58Changes in Global Power Generation by Energy Type, 2010–2050
Figure 4.59The Global Power Generation Mix in 2050
It is expected that by 2050, renewable energy generated on a centralized basis, like hydropower, wind, and solar energy, will account for 55% or so of total generation, compared with 15% for distributed generation. Wind power in the Arctic region and solar energy in the equatorial regions will account for 16% of total generation. Changes in the structure of global power supply between 2010 and 2050 are shown in Fig. 4.60
Figure 4.60Changes in Global Power Supply and Demand, 2010–2050
5.3. Electricity Supply and Demand Balance on Each Continent
Judging by the supply/demand situation of each continent, Asia, Europe and North America are electricity importers; Africa and Oceania are electricity exporters. South America is geared towards a self-balancing of power supply and demand. See Fig. 4.61 for the supply of power globally and the supply/demand situation by continent in 2050.
Figure 4.61Global Power Supply, Power Supply and Demand by Continents (Including Arctic and Equatorial Regions) in 2050
5.3.1. Asia
Asia’s demand for electricity has maintained relatively strong growth. As an electricity importer, the continent will see a growing supply shortfall. The most densely populated among all continents, Asia has the highest demand for electricity in the world. Fueled by the socioeconomic growth of densely inhabited regions like China, India, and Southeast Asia, Asia’s power demand will continue to increase, chalking up the highest growth rate among all continents. By 2050, power demand will reach 38,000 TWh, or 52% of total global demand. Electricity consumption per capita will amount to 7360 kWh/annum, up 2.5 times from 2010.
Asia is rich in renewable energy resources, such as solar, wind, and hydroelectric energy. In the future, the capacity of renewable energy development will be subject to the levels of resources and reserves, technology economics, and the economics of transcontinental transmission. As water resources with better conditions for development in Asia have already been fully developed, the focus has started to shift to the upper and middle reaches of Asia’s major river basins. By 2050, the capacity of hydroelectric development is expected to reach approximately 4900 TWh, up 300% from 2010, indicating the exhaustion of hydropower resources of average and inferior quality. Currently, wind, and solar energy resources in Asia are at the initial stage of substantial development. Major growth can be expected with greater government support and improved technology economics. By 2050, wind power generation is expected to reach 10,400 TWh globally (formally the Arctic region), whereas solar energy generation globally (formally the Middle East) is expected to reach 10,100 TWh (including 4600 TWh photovoltaic energy and 5500 TWh photothermal power). In the next 20 years, some developing countries in Asia will continue to develop nuclear energy to satisfy their own higher power demand and the need for low carbon development. Asia’s nuclear energy generation is expected to peak at about 1300 TWh in 2040. Given that existing nuclear power units will be decommissioned gradually over the next 30 years, nuclear energy generation is expected to decline to 1250 TWh in 2050. Considering the economic capacity and technological level of China, India and other developing countries in central Asia and south-east Asia, Asia is expected to retain, into 2050, a share of gas and coal to the extent of about 12% of continent-wide electricity supply. Asia enjoys abundant ocean energy resources and is at the forefront of ocean energy utilization. Taking technology economics into account, ocean energy generation in Asia is expected to reach 300 TWh in 2050, ranking first in the world. Considering the contribution of the Arctic region in Asia to wind power and the contribution of the Middle East to solar energy, Asia’s continent-wide power supply20 is expected to reach 37,000 TWh in 2050, accounting for 51% of the world total. Of this capacity, 34% is attributable to photovoltaic and photothermal power, 31% to wind power, 13% to hydropower, and 3% to nuclear energy. As a vast continent with an enormous population, Asia is rich in distributed generation resources such as microhydropower, wind, solar, and biomass energy resources. In the future, distributed generation will grow more rapidly to meet the demand of remote regions and city centers. It is expected that distributed power generation in Asia will reach about 4500 TWh in 2050, accounting for approximately 12% of the continent’s total electricity demand.
Taking an integrated view of the development potential and supply economics of various generation sources, large-scale renewable energy bases, including those in the Arctic and equatorial regions, are expected to reach a supply capacity of approximately 3700 TWh/year in 2050, accounting for 10% of Asia’s total demand. Of this supply capacity, wind power of about 1200 TWh/year will be exported from the Bering Strait, the Kara Sea, and Sakhalin Island to northeastern Asia, while solar energy of 2500 TWh/year will be exported from the equatorial regions in the Middle East to South Asia. In addition, 2.6% of Asia’s total power demand, at 1000 TWh, will have to be met by imports from Australia. See Fig. 4.62 for details of Asia’s power supply and Table 4.4 for the continent’s power supply structure.
Figure 4.62Asia’s Power Supply
Table 4.4
Asia’s Power Supply Structure (TWh)
Type
2010
2020
2030
2040
2050
Power generation mix
Total
8,694.1
12,817
18,850
28,900
38,020
Coal power
4,209.7
6,230
6,960
5,780
1,920
Oil power
1,835.8
619
170
0
0
Gas power
697.6
2,453
4,280
6,760
2,480
Hydropower
1,209.7
1,952
3,330
4,420
4,890
Nuclear power
584.5
985
1,070
1,310
1,250
Wind power
72.6
268
1,420
5,120
10,370
Photovoltaic energy
4.9
50
410
1,370
4,600
Photothermal energy
0.3
12
110
910
5,540
Biomass energy and others
79
246
800
1,450
1,970
Ocean energy
0
2
50
170
300
Wind power imported from Arctic region
0
0
50
510
1,200
Solar energy imported from equatorial regions
0
0
200
1,100
3,500
Mode of generation
Total
8,694.1
12,817
18,850
28,900
38,020
Distributed type
8.7
275
950
2,210
4,470
Centralized type
8,685.4
12,542
17,650
25,080
28,850
Arctic and equatorial regions (intracontinental)
0
0
250
1,310
3,700
Arctic and equatorial regions (extracontinental)
0
0
0
300
1,000
5.3.2. Europe
Europe’s power demand is moving towards the saturation point. As a traditional electricity importer, Europe is seeing a huge demand for imported renewable energy resources triggered by electricity substitution. Europe’s population has moved into a period of steady decline. According to United Nations forecasts, the continent’s population will be 710 million in 2050, down 4% from 2010. Taking into account factors such as the development of electric applications and electricity replacement of its relatively underdeveloped countries, Europe’s power demand is expected to reach 9500 TWh in 2050. Electricity consumption per capita will rise to 13,000 kWh/year, up to 90% from 2010.
Under the objective of low-carbon and clean development, all coal and gas-fired generating units in Europe will be decommissioned around 2040, leaving only a few gas-fired generators for peak load regulation. In the future, Europe’s clean power supply will come mainly from wind, solar, hydroelectric, biomass and ocean energy. The continent’s prospects for hydropower development are limited, as all hydropower resources are expected to be fully developed by around 2030 with annual generation estimated at about 1200 TWh. Given the impact of the nuclear-free policy being pursued by countries like Germany, nuclear safety concerns and the gradual decommissioning of existing nuclear power units, Europe’s installed nuclear generation capacity is expected to drop continuously after 2020. Annual nuclear power generation will be about 650 TWh in 2050, down about 50% from now. Looking ahead, Europe will actively develop distributed wind and solar energy at the same time as it will focus on developing North Sea wind power and Southern European solar energy in resource-rich regions. In 2050, wind power generation will reach 2600 TWh in Europe (excluding Greenland, the Norwegian Sea). The Norwegian Sea and the Barents Sea will enter the initial stage of wind power development around 2040. Subject to breakthroughs in UHV undersea cable technology, Greenland will usher in wind power development, which is expected to reach a capacity of 1800 TWh in 2050. In 2050, solar energy generation in Europe will reach 1200 TWh (including photovoltaic energy of 600 TWh and photothermal power of 600 TWh). In particular, distributed wind and solar power generation will reach 860 TWh, or 9% of total power demand. In 2050, Europe’s power supply capacity is expected to reach 9000 TWh, of which 49% is wind power attributable to Greenland, the Norwegian Sea and the Barents Sea, 13% to solar energy, and 13% to hydropower.
In 2050, it is expected that Europe will need to import electricity of 1500 TWh from other regions (mainly North Africa) to balance supply and demand. Taking an integrated view of the development potential of different energy sources and supply economics, the wind power bases in the Artic regions of Greenland, the Norwegian Sea, and the Barents Sea are expected to achieve annual generation of 1800 TWh. Of this generation capacity, 800 TWh is exported to meet approximately 8% of Europe’s total demand, taking into account transmission distances/paths, economics and other factors. Exports to North America are estimated at 1000 TWh. See Fig. 4.63 for Europe’s power supply and Table 4.5 for the continent’s power supply structure.
Figure 4.63Europe’s Power Supply
Table 4.5
Europe’s Power Supply Structure (TWh)
Type
2010
2020
2030
2040
2050
Power supply structure
Total
5,330.4
6,193
7,790
9,490
10,500
Coal power
1,755.8
1,088
530
0
0
Oil power
122.7
36
10
0
0
Gas power
1,145
2,336
2,100
1,440
400
Hydropower
789.7
932
1,170
1,180
1,180
Nuclear power
1,202.5
1,270
930
700
650
Power supply structure
Wind power
152.4
195
1,550
2,600
2,640
Photovoltaic energy
21.8
29
300
610
640
Photothermal energy
1.4
7
190
520
550
Biomass energy and others
139.1
228
570
970
980
Ocean energy generation
0
1
30
100
150
Wind power imported from Arctic region
0
0
0
50
800
Solar energy imported from the equatorial regions
0
71
410
1,270
1,510
Sending-out capacity of the Pole regions
0
0
0
50
1,000
Mode of Development
Total
5,330.4
6,193
7,790
9,490
10,500
Distributed type
1.7
53
180
420
860
Centralized type
5,328.7
6,069
7,200
7,700
6,330
Imports from Arctic and equatorial regions (intracontinental)
0
0
0
50
800
Imports from Arctic and equatorial regions (extracontinental)
0
70
410
1,270
1,510
Sending-out capacity of Arctic and equatorial regions (intracontinental)
0
1
0
50
1,000
5.3.3. North America
North America’s power structure is geared towards achieving a self-balance between supply and demand, importing only an appropriate amount of electricity from the Arctic region. According to United Nations forecasts, North America’s population will rise steadily and reach 450 million in 2050, up 29% from 2010. Taking into account the progress of electricity replacement, the continent’s power demand is expected to reach 10200 TWh in 2050. Electricity consumption per capita will grow to 23,000 kWh/year, up 50% from 2010.
North America is rich in energy resources such as wind power, solar energy and natural gas, etc. With the massive development of shale gas, the price of natural gas is likely to remain low. North America’s gas-fired generation is expected to peak at 2700 TWh in 2030, then easing to about 1500 TWh in 2050 amid the growing substitution of clean and low-carbon energy for conventional power sources. Despite its rich hydropower resources, North America faces the problems of excessive development of quality resources, with development costs expected to rise significantly in the future. The continent’s hydropower generation is estimated at about 1700 TWh in 2050, with nuclear power generation at about 170 TWh, down 80% from 2010. North America is also rich in wind power and solar energy. The wind and solar energy resources in the Midwest are suited for large-scale, centralized development, while regions with more decentralized, medium-rise residential buildings are ideal for developing distributed solar and wind power systems. In 2050, wind power generation in North America is expected to reach 2300 TWh and solar energy generation, 2500 TWh (including photovoltaic energy of 1300 TWh and photothermal power of 1200 TWh). The distributed generation of photovoltaic energy and wind power is expected to reach 1600 TWh, representing 15% of total demand. Continent-wide, power supply capacity is expected to reach 9200 TWh in 2050, with wind and solar energy accounting for a dominant 52% share, followed by gas-fired generation (16%) and hydropower (19%).
In North America, solar resources are mostly concentrated in the southwest and wind power resources, in the west. Load levels are relatively high in the east. Taking an integrated view of a comparison of economics between developing wind and solar power in the west and delivered to the east region and the importation of Greenland wind power into the eastern regions of North America, North America is expected to import 1000 TWh/year of power from Greenland to achieve a balance between supply and demand. See Fig. 4.64 for North America’s power supply and Table 4.6 for the continent’s power supply structure.
Figure 4.64North America’s Power Supply Structure
Table 4.6
North America’s Power Supply Structure (TWh)
Type
2010
2020
2030
2040
2050
Power generation mix
Total
5,333.7
6,239
7,580
9,310
10,240
Coal power
2,116
1,360
880
320
0
Oil power
102
33
10
0
0
Gas power
1,277
2,503
2,730
2,630
1,490
Hydropower
698
984
1,450
1,690
1,740
Nuclear power
935.5
837
560
220
170
Wind power
105.5
222
900
1970
2,340
Photovoltaic power generation
5.5
50
360
920
1,280
Photothermal power generation
0.6
12
150
610
1,230
Biomass energy and others
93.6
237
510
800
840
Ocean power generation
0
1
30
100
150
Wind power imported from Arctic regions
0
0
0
50
1,000
Mode of development
Total
5,333.7
6,239
7,580
9,310
10,240
Distributed type
3.1
97
340
780
1,570
Centralized type
5,330.6
6,142
7240
8,480
7,670
Arctic and equatorial regions (intracontinental)
0
0
0
0
0
Arctic and equatorial regions (extracontinental)
0
0
0
50
1,000
5.3.4. South America
South America’s electricity demand is growing relatively fast. With solar energy generation in equatorial regions, the continent can achieve on its own an overall balance between supply and demand in electricity. According to United Nations forecasts, South America’s population will rise steadily and reach 780 million in 2050, up 31% from 2010. Taking into account the future development of electricity demand and ongoing electricity replacement, power demand in South America will reach 5100 TWh in 2050. Electricity consumption per capita will grow to 6550 kWh/year, up 2.6 times from 2010.
South America is rich in hydropower resources. In the future, the hydropower resources of the Amazon River Basin will be developed with more vigor to reach a generation level of 1500 TWh in 2050. Currently, the development of wind and solar energy generation is still at its initial stages, but will accelerate to meet growing power demand. In 2050, wind power generation is expected to reach 950 TWh and solar energy generation, 1900 TWh (including photovoltaic energy of 1100 TWh and photothermal power of 800 TWh). South America is also rich in biomass resources such as agricultural and forest crops, as well as geothermal energy. Through steady growth, the continent’s power generation is expected to reach approximately 400 TWh in 2050. Continent-wide, a power supply capacity of about 5100 TWh is expected to be achieved in 2050. Of this supply capacity, renewable energy is expected to take up a 96% share, with 29% attributable to hydropower and 55% to wind and solar energy.
South America is expected to achieve, on its own, a balance between power supply and demand in 2050. Of the continent’s power supply, approximately 1000 TWh will come from the solar power bases in equatorial countries, such as Peru and Chile, mainly for delivery to load centers in the east, like Brazil. See Fig. 4.65 for South America’s power supply and Table 4.7 for the continent’s power supply structure.
Figure 4.65South America’s Power Supply
Table 4.7
South America’s Power Supply Structure (TWh)
Type
2010
2020
2030
2040
2050
Power generation mix
Total
1,062.3
1,563
2,340
3,670
5,130
Coal power
22
20
20
10
0
Oil power
137
1
0
0
0
Gas power
162
584
840
600
200
Hydropower
671.1
807
1,000
1,350
1,510
Nuclear power
21.7
37
40
10
10
Wind power
3.5
24
140
560
950
Photovoltaic energy generation
0
6
40
180
480
Photothermal energy generation
0
1
10
110
380
Biomass energy and others
45
82
160
350
430
Ocean power generation
0
1
30
100
170
Solar energy imported from equatorial regions
0
0
60
400
1,000
Mode of development
Total
1,062.3
1,563
2,340
3,670
5,130
Distributed type
1.6
49.9
170
400
810
Centralized type
1,060.7
1,513.1
2,110
2,870
3,320
Arctic and equatorial regions (intracontinental)
0
0
60
400
1,000
Arctic and equatorial regions (extracontinental)
0
0
0
0
0
5.3.5. Africa
Africa is an electricity exporter well endowed with renewable resources. According to United Nations forecasts, Africa’s population will rise rapidly in the future and reach 2.39 billion in 2050, up 132% from 2010. Given the future development of power demand and electricity replacement, power demand in Africa is projected to reach 9500 TWh in 2050. Per capita electricity consumption will grow to 4000 kWh/year, up 5.3 times from 2010.
Africa has the world’s most abundant solar and wind power resources, together with very rich hydropower resources. Africa is currently underdeveloped, with relatively small power demand and per capita electricity consumption. Conventional fossil energy and hydropower play a dominant role in power supply, while the share of renewable energy resources like wind and solar energy is very low. In the future, wind and solar power generation will see rapid growth driven by population expansion and socioeconomic development. In 2050, wind power generation is forecast to reach 2900 TWh and solar energy generation, about 2100 TWh (excluding the export capacity of North Africa and East Africa). Of this level of solar power generation, 600 TWh is attributable to photovoltaic energy and 1500 TWh to photothermal power. In the future, large-scale hydropower development will accelerate in the river basins of the Congo River, the Zambezi River, and the Nile River. In 2050, the continent’s hydropower generation is projected to reach about 650 TWh. Given Africa’s underdeveloped economy compared with the other continents, a certain level of coal and gas-fired generation capacity estimated at about 610 TWh will be retained in 2050. African power supply is expected to reach about 11,000 TWh in 2050, of which 6% is attributable to gas and coal-fired generation and 92% to solar, wind and hydropower generation.
The solar energy bases in North Africa and East Africa will become important sending-end bases in a globally interconnected energy network. Given the power supply and demand situation in different continents, the solar energy bases in North Africa and East Africa are projected to export 4500 TWh of electricity in 2050, to meet 6% of global power demand. Of this export capacity, 1500 TWh will be designated for Europe and approximately 3000 TWh for the southern, western, and central regions of Africa. See Fig. 4.66 for Africa’s power supply and Table 4.8 for the continent’s power supply structure.
Figure 4.66Africa’s Power Supply
Table 4.8
Africa’s Power Supply Structure (TWh)
Type
2010
2020
2030
2040
2050
Power supply structure
Total
688.2
1,057
2,370
5,800
11,010
Coal power
263
317
350
320
210
Oil power
71
36
20
0
0
Gas power
228
292
400
4,200
400
Hydropower
108.5
212
360
540
650
Nuclear power
12.1
14
20
20
20
Wind power
2.2
75
410
1,600
2,860
Photovoltaic energy generation
0.1
14
80
280
600
Photothermal power generation
0
5
50
360
1,500
Biomass energy and others
3.3
20
50
120
150
Ocean power generation
0
1
20
70
110
Solar energy imported from equatorial regions
0
0
200
800
3,000
Sending-out solar capacity of equatorial regions
0
71
410
1,270
1,510
Mode of development
Total
688.2
1,057
2,370
5,800
11,010
Distributed type
5.8
184
640
1,480
2,990
Centralized type
682.4
802
1,120
2,250
3,510
Arctic and equatorial regions (intracontinental)
0
70
610
2,100
4,500
Arctic and equatorial regions (extracontinental)
0
0
0
0
0
5.3.6. Oceania
As an electricity exporter, Oceania is rich in resources with relatively small power demand. According to United Nations forecasts, Oceania’s population will rise steadily in the future and reach 60 million in 2050, up 55% from 2010. Given the future development of power demand and ongoing electricity substitution, Oceania’s power demand is expected to reach 700 TWh in 2050. Per capita electricity consumption will approximate 13,000 kWh/year, up 57% from 2010.
Oceania is endowed with rich solar and wind power resources. The continent’s future power supply will come mainly from hydroelectric, wind and solar power generation. In 2050, a supply capacity of 1700 TWh is expected to be reached, of which 12% is attributable to wind power, 71% to solar energy, and 6% to hydropower.
Taking into account the power supply and demand situation and economics across different continents, Australia’s power capacity for export to Southeast Asia is projected to reach approximately 1000 TWh in 2050.
See Fig. 4.67 for Oceania’s power supply and Table 4.9 for the continent’s power supply structure.
Figure 4.67Oceania’s Power Supply
Table 4.9
Oceania’s Power Supply Structure (TWh)
Type
2010
2020
2030
2040
2050
Power generation mix
Total
300.5
366
469
926
1,745
Coal power
84.8
54
35
13
0
Oil power
0
0
0
0
0
Gas power
160
175
158
120
10
Hydropower
39.1
70
91
103
110
Nuclear power
0
0
0
0
0
Wind power
7.1
30
81
155
209
Photovoltaic energy generation
0.5
8
31
67
113
Photothermal energy generation
0.1
2
13
41
120
Biomass energy and others
8.9
26
36
46
49
Ocean power generation
0
1
24
81
134
Sending-out solar capacity of equatorial regions
0
0
0
300
1,000
Mode of development
Total
300.5
366
469
926
1,745
Distributed type
0.5
16
60
130
280
Centralized type
300
350
409
496
465
Arctic and equatorial regions (intracontinental)
0
0
0
300
1,000
Arctic and equatorial regions (extracontinental)
0
0
0
0
0
5.4. Development Trend of Global Electricity Flow
The global landscape of electricity flows is shaped by export-oriented energy bases in the Arctic and equatorial regions, exchanges of electricity across neighboring continents, and balanced consumption at the intracontinental level achieved by large-scale energy bases. It holds the key to the world’s energy sustainability in the future.
5.4.1. Power Exports from Arctic and Equatorial Regions
Taking an integrated view of global power demand, renewable resources and their development potential, transmission paths, economic competitiveness, and other factors, priority should be accorded to the development of solar resources in North Africa in building the export capacity of the Arctic and equatorial regions. An export capacity of 920 TWh is initially considered for the Arctic and equatorial regions for 2030, with the equatorial regions accounting for 870 TWh of solar energy and the Arctic region, 50 TWh of wind power. In 2040, the Arctic and equatorial regions are expected to have an export capacity of 4200 TWh, including 3600 TWh of solar energy from the equatorial regions and 600 TWh of wind power from the Arctic region. In 2050, the Arctic and equatorial regions are projected to boast an export capacity of 12,000 TWh that accounts for 16% of global power demand. Of this export capacity, 3000 TWh will come from the Arctic region in the form of wind power and 9000 TWh from the equatorial regions in the form of solar energy. See Table 4.10 for the development timetable and export capacity of the Arctic and equatorial regions.
Table 4.10
Development Timetable and Export Capacity of Arctic and Equatorial Regions (TWh)
Type
2030
2040
2050
Wind power in Arctic region
50
600
3,000
Solar energy generation in equatorial regions
870
3,600
9,000
Total
920
4,200
12,000
As shaped by the electricity flows from the renewable energy bases in the Arctic and equatorial regions, a pattern of movement will present itself showing power radiating southwards from the Arctic region and radiating northwards and southwards from the equatorial regions. Asian power demand is huge and fast expanding. Europe’s total power demand is also massive with an urgent need for renewable energy development due to a lack of resources. Because of their strategic positions, Asia and Europe enjoy a clear geographical advantage in developing wind power in the Arctic region, while Europe is better placed to develop solar energy in the equatorial regions. By 2050, 12% of Asia’s and 24% of Europe’s power requirements are expected to be met by imported renewable energy sourced from the Arctic and equatorial regions. Africa and South America are continents that both stretch across the equatorial regions with rich solar energy resources. But as solar resources are unevenly distributed at the intracontinental level, the condition and potential is right for developing transnational transmission across the continent. In 2050, the transnational transmission capacity of solar energy in Africa’s equatorial regions will meet 32% of the continent’s total power consumption. The comparative figure for South America is approximately 20%.
With its abundant wind, solar and hydropower resources, North America can basically satisfy its future power demand. Transcontinental power transmission can accommodate mutual backup operations across regions in different time zones and the outward power transmission from the Arctic region. The continent is expected to import wind power from the Arctic and equatorial regions to meet approximately 10% of its energy requirements. See Fig. 4.68 for the power export capacity of the Arctic and equatorial regions and the receiving capacity by continent. The export capacity and direction of electricity flows of the Arctic and equatorial regions are shown in Fig. 4.69 and Table 4.11.
Figure 4.68Export Capacity of Arctic and Equatorial Regions and Receiving Capacity by Continents
Figure 4.69Export Capacity and Direction of Electricity Flows of Arctic and Equatorial Regions
Table 4.11
Export Capacity and Direction of Electricity Flows of Arctic and Equatorial Regions (TWh)
2030
2040
2050
Arctic region
50
600
3,000
Kara Sea/Bering Strait → Northeast Asia
50
500
1,200
Greenland, Norwegian Sea and Barents → Europe
0
50
800
Greenland → North America
0
50
1,000
Equatorial regions
870
3,600
9,000
North Africa → Europe
410
1,300
1,500
North Africa, East Africa → West Africa, South Africa
200
800
3,000
Middle East → Asia
200
800
2,500
Australia → Asia
0
300
1,000
Peru, Chile → Brazil
60
400
1,000
5.4.2. The Direction and Capacity of Electricity Flows Across Continents
Before 2030, electricity flows across countries on each continent and also the region between North Africa and Europe, being close to each other, are given priority for development as part of the bigger efforts to build transcontinental interconnections. But the capacity of electricity flows is limited at the initial stage of development. At this stage, the major areas for building transnational electricity flows at the intracontinental level include Mongolia for wind and solar energy, Russia for hydropower, central Asia for renewable power generation destined for load centers in Northeastern Asia (including China), the Arctic regions of the Kara Sea and the Bering Strait for wind power destined for load centers in north-east Asia, the equatorial regions of North Africa and East Africa for solar and wind power destined for western and southern Africa. At this stage, the most important transcontinental electricity flows are mainly those that deliver solar power from solar energy bases in North Africa to Europe, at a transmission level of 100 million kW, and also Eurasian interconnections for delivering power from Central Asia to Europe where large renewable energy bases are built in Kazakhstan, Xinjiang (China), and Siberia (Russia) to deliver power to load centers in Europe. See Fig. 4.70 for the world’s electricity flows across continents and across countries at the intracontinental level in 2030.
Figure 4.70World’s Electricity Flows Across Continents and Across Nations at Intracontinental Level in 2030
From 2030 to 2050, the renewable energy bases in the Arctic and equatorial regions will enter a period of significant growth, with the growing maturity of clean energy and transmission technologies. On each continent, wind and solar energy resources with favorable conditions have already been well developed on a centralized basis. Distributed wind and solar energy development is now mainly focused on densely populated urban areas and on a large scale to address community power demand. As mankind’s knowledge of the Arctic deepens, the conditions for large-scale wind power development in the region are falling into place. The focus of global renewable energy development will shift gradually from large-scale clean energy bases on each continent to the Arctic and equatorial regions. The development of wind power in the Arctic region and solar energy in the equatorial regions can satisfy the increasing demand from load centers in Asia, Europe, and North America. At this stage, global electricity flows mainly constitute transnational transmission at the intracontinental level and electricity outflows from the Arctic and equatorial regions. With growing power demand and clean energy replacement, the large-scale renewable energy bases on each continent will focus on satisfying local power demand and the original Eurasian intercontinental interconnections will transform themselves into an interconnected network between Asia and Europe. As the demand for transcontinental electricity flows grows further with the renewable energy bases in the Arctic and equatorial regions moving into the stage of major development, global electricity flows across continents will be centered on the delivery of power from the Arctic and equatorial regions to all continents at a capacity of over 100 million kW. A globally interconnected grid system featuring global allocations of clean energy will come into being, with the focus on clean energy bases in the Arctic and equatorial regions. See Fig. 4.71 for the world’s major electricity flows in 2050.
Figure 4.71The World’s Major Electricity Flows in 2050
The previous discussion is based on an overall consideration of global electricity flows under a scenario for quicker development of clean energy and global energy interconnection. In the course of actual development, the capacity of future electricity flows will be uncertain due to concerns over the economics of clean energy development on each continent and clean energy technologies, as well as the economics of power development and transmission concerning the Arctic and equatorial regions.
5.4.2.1. The Arctic
Despite its exceptionally rich wind power resources, the Arctic region faces tough conditions in power-related development, construction, operation and maintenance, as well as the problems of long transmission distances. The transmission of wind power from the Arctic region to load centers in Europe, Asia, and North America will largely depend on the economics of wind power development and transmission in the Arctic region, especially in comparison of economic competitiveness with the supply costs of various power sources in the receiving regions. Under a scenario for delivery of 3000 TWh from the Arctic region in 2050, it is assumed that major breakthroughs can be achieved in wind power development and transmission technologies, with greatly improved economics. Considering the uncertainty surrounding the technology economics of wind power development and transmission in the Arctic region, the export capacity of the Arctic region in 2050 may drop to approximately 2000 TWh, and the wind power bases in Greenland, the Norwegian Sea, the Barents Sea, the Kara Sea and the Bering Strait will likewise see a decline in operational capacity.
5.4.2.2. Africa
Judging by the electricity flows across the continent, Africa’s demand centers in 2011 were concentrated in the southern and northern regions. The short- to medium-term planning developed by the Southern African Power Pool, the Eastern African Power Pool, and other organizations envisages a flow of electricity to the south from major power bases in the northern and central regions. In the future, with the disappearance of the “without access to electricity” population and rising consumption per capita, the total electricity consumption in West Africa, southern Africa, North Africa, and East Africa will grow to a relatively high level, though power consumption in Central Africa will remain relatively low (see Fig. 4.72). Given the abundance of water resources in central and eastern Africa with stable output and long utilization hours, together with the world-leading quality solar energy resources in eastern and southern Africa, the central, eastern and southern regions of Africa will see large-scale development in hydropower and solar resources. This will have an impact on the capacity of power transmission from solar power bases in North Africa to central and southern Africa. In view of this, the capacity of electricity flows from North Africa and East Africa to the west and south of the continent may drop to 1000 TWh in 2050, from the 3000 TWh envisaged under a previous scenario.
Figure 4.72Forecasts of Africa’s Future Power Demand by Region
5.4.2.3. South America
Judging from the development conditions of solar energy bases in South America, the cost of solar power development is relatively high in Peru and Chile where wind and hydropower resources are abundant. In addition, the transmission of solar power from energy bases in South America eastwards to load centers in Brazil and other countries will have to overcome the challenge of traversing the Andes mountains and rainforest reserves, which will affect the development and export capacity of solar energy bases in the equatorial regions of Peru, Chile, and other South American countries.
5.4.3. Research and Forecasts by other Organizations
Systematic research has been conducted by relevant international organizations on future energy development in a bid to address climate change issues and the requirements of low-carbon energy development. Different research objectives and boundary conditions have been set, with the following findings obtained.
The IEA predicts bigger room for growth in global nuclear energy over the next 20 years, from 390 GW in 2013 to 620 GW in 2040. In the New Policies Scenario,21 conventional fossil fuel-fired generation is expected to increase from 15,000 TWh in 2012 to 22,000 TWh in 2040, with its share of total power generation decreasing from 68% to 55%. Over the same period, nonhydrorenewable energy generation is expected to increase from 1000 TWh to 7000 TWh, with its share of total power generation rising from 5% to 17%.
According to a WEC research report, taking into account the future energy demand of different countries, coal-fired generation is expected to increase from 8700 TWh in 2010 to 20,000 TWh in 2050. The portion of coal-fired generation with carbon capture and storage (CCS) is estimated at 1000 TWh. Over the same period, nuclear power generation is expected to grow from 2800 TWh to 3300 TWh, with installed nuclear capacity rising from 370 GW to 420 GW. Under the Symphony Scenario, nuclear energy generation and installed nuclear capacity will reach 7000 TWh and 880 GW, respectively.
According to the BP Energy Outlook 2035 issued by BP, coal-fired generation will increase by 35% and nuclear energy by 53% in 2012–2035. See Fig. 4.73 for the generation mix by energy type in 2035.
Figure 4.73The Generation Mix by Energy Type, 2035Source: BP, BP Energy Outlook 2035.
All in all, while a consensus has been reached among research institutions on the determination to tackle climate change issues in the future, views differ over how climate change has progressed. According to an IPCC report, to meet the target of limiting global temperature rise to 2°C, global efforts need to be stepped up to pursue clean energy substitution and electricity substitution. And human society’s sustainability targets can only be better accomplished by improving the development of renewable energy and its share in power generation. To achieve this objective, the development of large-scale renewable energy bases in the Arctic and equatorial regions and on each continent should be expedited and expanded to incorporate the world’s major renewable energy bases into the sphere of global allocations.
Summary
1. Based on a study of future socioeconomic development, energy resource supply, energy environment constraints, energy technology advancement, and energy policy regulation, global primary energy consumption is expected to rise from 18.8 billion tons of standard coal in 2010 to 30 billion tons of standard coal in 2050, at an annual rate of 1.2%, lower than the average rate of economic growth. Global power demand will rise from 21,000 TWh in 2010 to 73,000 TWh in 2050, at an annual rate of 3.1%, higher than the average rate of economic expansion and energy demand growth. The energy structure will undergo a fundamental change from one oriented towards fossil fuels and supplemented by clean energy to one focusing on clean energy and supplemented by fossil fuels. Asia, Africa, and South America will play a growing role in global power consumption. Despite their falling share in electricity consumption, the developed regions of Europe and America will remain the world’s most energy-intensive regions in terms of electricity consumption.
2. Wind power resources in the Arctic region, solar energy resources in the equatorial regions, and renewable energy resources on each continent will be fully developed. Clean energy generation is expected to reach 66,000 TWh by 2050, accounting for a dominant 90% share of total generation. Of this capacity, 26,000 TWh is attributable to solar energy (photovoltaic and photothermal), accounting for a higher share of 35%, and 22,000 T kWh to wind power generation, accounting for 31%. Both solar and wind resources will become the absolute key drivers of clean energy generation in the future.
3. Before 2030, global electricity flows will orient towards transnational transmission at the intracontinental level and transcontinental transmission between two locations close to each other (for instance, North Africa–Europe and Central Asia–Europe). The capacity of transcontinental electricity flows is still at the initial stage of strong growth. After 2030, the centralized development of wind and solar resources with good conditions and easy access will be gradually completed. The focus of development will then slowly shift to the Arctic and equatorial regions. The capacity of electricity outflows from these regions is expected to reach 12,000 TWh in 2050, accounting for 16% of global electricity demand, which will necessitate the development of a globally interconnected energy network to optimize the global allocations of clean energy. In the event of the hydropower and solar resources in central and southern Africa having been fully developed, the capacity of electricity outflows from the Arctic and equatorial regions may decline to 10,000 TWh in 2050, accounting for 14% of global electricity demand.


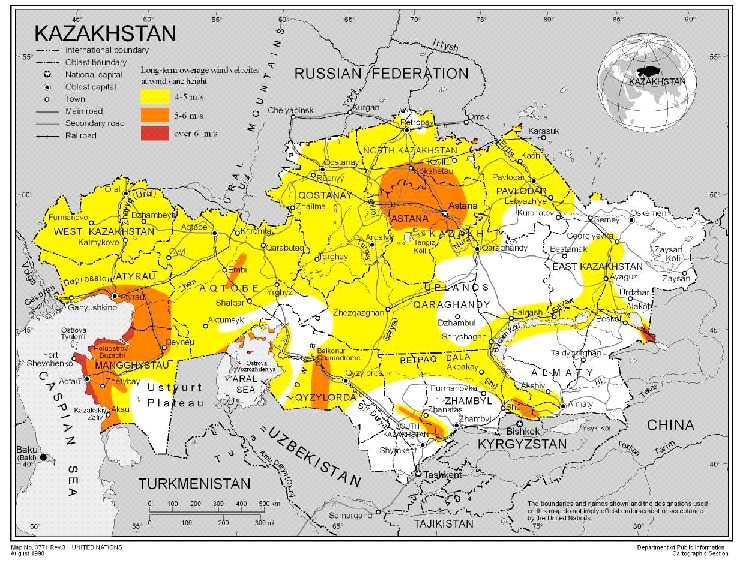


