
Reading ADS1x15 values, press Ctrl-C to quit...
| 0 | 1 | 2 | 3 |
| 0 | 4320 | 4496 | 4528 |
| 0 | 4224 | 5104 | 4432 |
| 0 |
4352
|
4688
|
5104
|
|
6128
|
4640
|
4384
|
5552
|
|
10928
|
4592
|
4592
|
5056
|
|
18736
|
4384
|
4992
|
4384
|
|
23312
|
4496
|
4912
|
4784
|
|
26512
|
4912
|
4800
|
5968
|
|
25968
|
4816
|
4800
|
5008
|
|
16528
|
4416
|
4928
|
4928
|
|
9280
|
4656
|
4416
|
5312
|
|
2688
|
4240
|
5008
|
4464
|
| 0 |
4384
|
4352
|
5360
|
| 0 |
4336
|
4624
|
4272
|
| 0 |
4256
|
4432
|
4592
|
16. Press Ctrl-C to terminate the script.
As you can see, turning the dial on the potentiometer changes
the voltage coming into channel 0 of the ADS1x15. The code in the
example does a little bit of math to determine the voltage value
from the data coming from the ADC. Of course, your math will vary
depending on what kind of sensor you use.
You can look inside that example script to see how it works, or try
out the even simpler example that follows to learn how to take
readings from the ADC. Create a new file with the code from Exam-
ple 8-1 and execute it.
Example 8-1.Writing the code to read the ADC
from Adafruit_ADS1x15
from time import sleep
adc = Adafruit_ADS1x15.ADS1115()
while True:
result = adc.read_adc(0)
print result
sleep(.5)
0 1 2 3 4 5 6 7 8 9 a b c d e f
00: -- -- -- -- -- -- -- -- -- -- -- -- --
10: -- -- -- -- -- -- -- -- -- -- -- -- --
20: -- -- -- -- -- -- -- -- -- -- -- -- --
30: -- -- -- -- -- -- -- -- -- -- -- -- --
40: -- -- -- -- -- -- -- -- 48 -- -- -- -- -- -- --
50: -- -- -- -- -- -- -- -- -- -- -- -- --
60: -- -- -- -- -- -- -- -- -- -- -- -- --
70: -- -- -- -- -- -- -- --
Analog Input and Output 133
GSW_RASPI_4ED_FIN.indd 133GSW_RASPI_4ED_FIN.indd 133 10/28/21 10:54 AM10/28/21 10:54 AM
Import Adafruit’s ADS1x15 library.
Create a new ADS1x15 object called adc.
Get a reading from channel 0 on the ADS1x15 and store it in
result.
When you run this code, it will output raw numbers for each reading
twice a second. Turning the potentiometer will make the values go
up or down.
Once you get it all set up, the Adafruit ADS1x15 library does all
the hard work for you and makes it easy to use analog sensors in
your projects. For instance, if you want to make your own Pong-like
game, you could read two potentiometers and then use Pygame to
draw on the game on the screen. For more information about using
Pygame, see pygame.org.
Variable Resistors
Not all analog sensors work like the potentiometer, which provides
a variable voltage based on some factor (such as the amount the
dial on the pot is turned).
Some sensors are simply variable resistors that change the flow of
electricity through the circuit, based on some factor. For instance,
a photocell like the one in Figure 8-6 is a resistor that changes values
based on the amount of light hitting the cell. Add more light, and
the resistance goes down. Take away light, and the resistance goes
up. On the other hand, a force-sensitive resistor decreases its resis-
tance as you put pressure on the pad.
134 Getting Started with Raspberry Pi
GSW_RASPI_4ED_FIN.indd 134GSW_RASPI_4ED_FIN.indd 134 10/28/21 10:54 AM10/28/21 10:54 AM

Figure 8-6.
The photocell and force-sensitive resistors act as
variable resistors and can be used as analog inputs.
To read sensors like these with analog input pins, you’ll need to
incorporate a
voltage divider
circuit.
Voltage Divider Circuit
When you’re working with sensors that offer variable resistance,
the purpose of a voltage divider is to convert the variable resis-
tance into a variable voltage, which is what the analog input pins
are measuring. First, take a look at a simple voltage divider.
In Figure 8-7, you’ll see two resistors of the same value in series
between the positive and ground. A single wire is connected to
analog input 0,
between the two resistors
. Because both resistors
are the same, 10KΩ, the voltage is divided neatly in half. Since the
source voltage is 3.3V, there’s about half of that, 1.65V, going to
analog input 0.
Analog Input and Output 135
GSW_RASPI_4ED_FIN.indd 135GSW_RASPI_4ED_FIN.indd 135 10/28/21 10:54 AM10/28/21 10:54 AM
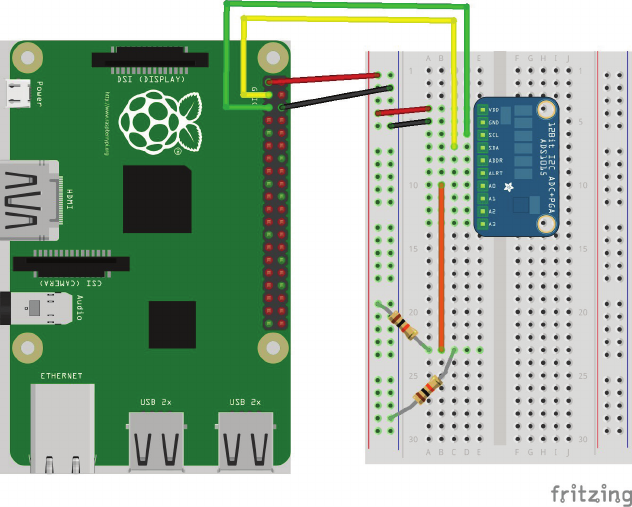
Figure 8-7.
With two of the same value resistors between voltage
and ground, the voltage between the two would be half of the total
voltage.
Without getting bogged down in the math involved, if you removed
one 10K resistor and replaced it with a resistor of a higher value,
the voltage going into the analog pin would
decrease
. If you removed
that 10K resistor and replaced it with one of a lower value, the volt-
age going into the analog pin would
increase
. We can use this princi-
ple with sensors that are variable resistors to read them with analog
input pins. You’ll simply replace one of the resistors with your sensor.
To try the circuit out, you’ll have to wire up a type of variable resis-
tor called a
force-sensitive resistor
, or FSR.
Force-Sensitive Resistor
A force-sensitive resistor is a variable resistor that changes based
on the amount of pressure placed on its pad. When there’s no pres -
sure on the pad, the circuit is open. When you start placing
pressure on it, the resistance drops.
136 Getting Started with Raspberry Pi
GSW_RASPI_4ED_FIN.indd 136GSW_RASPI_4ED_FIN.indd 136 10/28/21 10:54 AM10/28/21 10:54 AM
The exact figures will depend on your particular FSR, but typi-
cally you’ll see 100KΩ of resistance with light pressure and 1Ω
of resistance with maximum pressure. If you have a
multimeter
,
you can measure the changes in resistance to see for yourself,
or you can look at the component’s
datasheet
, which will tell you
what to expect from the sensor.
If you’re going to replace the resistor connected to 3.3V in Figure
8-7 with a variable resistor like an FSR, you’ll want the value of the
other resistor to be somewhere in between the minimum and max-
imum resistance so that you can get the most range out of the sen-
sor. For a typical FSR, try a 10KΩ resistor. To give the force-sensitive
resistor a test drive:
1. Wire up an FSR to the ADC as shown in Figure 8-8.
2. Execute the code in Example 8-1 again.
3. Watch the readings on the screen as you squeeze the FSR.
If everything is working correctly, you should see the values rise as
you increasingly squeeze harder on the FSR. As you press harder,
you’re reducing the resistance between the two leads on the FSR.
This has the effect of sending higher voltage to the analog input.
You’ll encounter many analog sensors that use this very same
principle, and a simple voltage divider circuit, along with an ana-
log-to-digital converter, will allow your Raspberry Pi to capture that
sensor data.
Analog Input and Output 137
GSW_RASPI_4ED_FIN.indd 137GSW_RASPI_4ED_FIN.indd 137 10/28/21 10:54 AM10/28/21 10:54 AM
..................Content has been hidden....................
You can't read the all page of ebook, please click here login for view all page.