
Smarter packaging for consumer food waste reduction
Abstract:
In this chapter we concentrate on post-consumer food waste in the home from a sustainability perspective. Ecological footprint analysis (EFA) data is first used to estimate different types of food and food packaging by sustainability impact. To this data is combined food waste data from the UK Waste & Resources Action Programme (WRAP) together with consumer insights on why and where people are wasting food. From this complete picture, innovative food-saving packaging solutions are suggested that should help consumers manage their food inventory better, and waste less food. The data also allow a comparison to be made of any new packaging concepts on the overall sustainability of the food supply chain.
20.1 Food waste: scale of problem
It has long been recognized that in our developed society there are significant losses in the agricultural supply chain of growing, harvesting, processing and delivering food to consumers. Food losses begin on the farm, pre- and postharvest, and continue into processing and retailing. Many of the early stage losses are unavoidable, such as losses due to weather, insect attack, molds, spoilage and rodent damage, and in storage, processing and transportation. Quantification of these losses in the literature appears currently confined to US and UK sources, and estimates vary considerably –generally ranging from about 10% to 40% (Kantor et al, 1997).
American anthropologist Dr Timothy Jones, of the University of Arizona, was an early pioneer in helping to quantify the size and scope of food waste in the US. What he found surprised and shocked him. Americans were throwing away still-edible food representing around 14% of total food purchased, costing a family of four nearly US $600 per year and depriving the US economy of US $43 billion annually. Some 14% of the waste turned out to consist of perfectly edible food still in its original packaging and not out of date (Jones, 2004, 2006).
Over the last few years, remarkably similar statistics for the UK have been generated, both in terms of the amount and type of food wasted, initially focusing just on post-consumer food waste (WRAP, 2008), with a later updated report including drink waste (WRAP, 2009), These detailed studies showed that an estimated 8.3 million tonnes of household food and drinks waste is produced each year; by comparison the UK produces approximately 4.6 million tonnes of packaging waste. The food waste is equivalent to a third of all food bought, representing more than £8 billion in retail value and costing families between £420 and £610 per year (dependent on household size).
The avoidable food waste represented 61% of the total, with ‘possibly avoidable’ another 20%, a total of 81%. Only 1.3 Mt, or around 19% of the total food waste of 6.7 Mt, corresponded to unavoidable food waste – things like meat and fish bones, peelings, egg shells, banana skins, etc. By analyzing the avoidable component of food waste further, it was possible to shed some light on where and why food was being wasted (Fig. 20.1). This breakdown of how consumers end up wasting food, and which types are most commonly wasted and why, is a critical component in understanding how packaging might be modified, improved or subject to the introduction of new technologies, with the aim of helping consumers manage their food inventory more effectively.
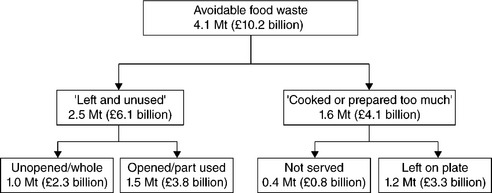
Fig. 20.1 Avoidable food waste in the UK by weight and cost, showing the major reasons for waste. (WRAP, 2008)
Consumers volunteered over 30 reasons for wasting food – preparing and cooking too much, not planning meals, buying too much, changing plans, not eating food in time (loss of quality) and not liking the food prepared – being some of the most common ones. Also frequently quoted in the WRAP research was consumer confusion over date coding, with one in five rigorously rejecting food close to its ‘best before’ date, even when it was still perfectly safe to eat.
The core consumer attitude to food waste, identified initially by Jones and confirmed by WRAP’s later research, is that consumers have largely lost touch with food, what it is, where it comes from and how it is produced. They perceive that food is cheap and plentiful and in interviews can sometimes create a perfect disconnect, that allows them to throw left-over food away and at the same time state that they do not waste food.
Despite the significant growth in environmental awareness in the developed countries of the world over the last few years, there has been little real attention paid to food waste as an environmental issue nor any attempt to place it within a wider sustainability context. While consumers are broadly in denial about food waste and largely ignorant about its environmental impact, by contrast they hold strong and in some cases extreme views about the environmental impact of food packaging.
In this chapter we will concentrate on post-consumer food waste in the home, from a UK perspective. In order to place the problem within an overall sustainability framework, we first need a methodology that allows different types of food to be assessed by sustainability impact. From this, and the data and insights provided by WRAP on why and where people are wasting food, we should be in a position to suggest potentially food-saving packaging and other innovative solutions to alleviate the food waste problem, and allow us to compare the impact of any new packaging concept on the overall sustainability of the food supply chain.
20.2 Sustainability and ecological footprinting
The environmental impact of food and packaging waste can be evaluated and compared by ecological footprint analysis (EFA), which takes into account the amount of land needed to provide the resources to produce a product or measure a level of consumption (Wackernagel and Rees, 1996). The impact of any human activity, or groups of people living in towns, cities or even countries, can be estimated, and compared through a standard measurement of ‘global hectares’, the notional land area needed to supply the necessary resources and absorb the resulting wastes. Since EFA compares the footprint with biocapacity, when a population’s footprint is greater than the earth’s biocapacity, we have a non-sustainable situation referred to as ecological overshoot. The use of EFA to measure resource use is becoming established and a growing number of academics and practitioners now use the methodology.
The Stockholm Environment Institute together with the University of York provided an EFA study performed in 2000 of the consumption characteristics of the population of 179,800 people living in the City of York, UK, where the level of detail is sufficient to extract the effects of food and packaging (Barrett et al., 2002). The overall results presented are broadly similar in other parts of the UK and most of the developed world in terms of ecological overshoot, so it is reasonable to draw some general conclusions from this very specific study.
From studies such as this, and for cities in particular, an eco-skyline provides a powerful visual image of sustainability with building height representing the ecological impact of each consumer activity in global hectares per capita (see Fig. 20.2). It can be seen that the single biggest ecological impact comes from the growing, harvesting, processing, storage, packaging, transporting, waste processing and disposal of food and drink. Food and drink, food packaging and the transportation of food from country of origin to retailers (food miles) are shown as separate ‘buildings’ in the schematic. To put things in context, if food packaging were a ten-storey building, food/ drink production would be a skyscraper more than 68 storeys tall, and food miles a building less than a storey high.
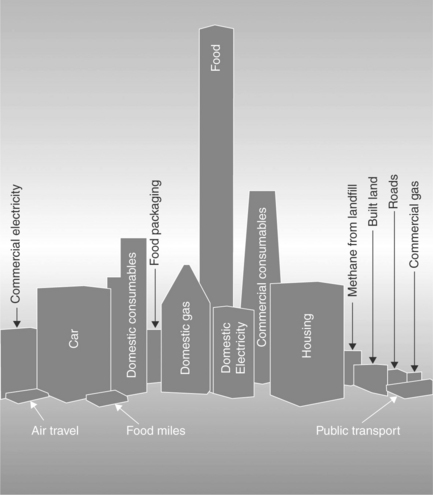
Fig. 20.2 The ‘eco-skyline’ for the inhabitants of the City of York for the year 2000 with building height related to environment impact as quantifi ed by ecological footprint analysis (EFA). Data from Barrett et al. (2002).
Thus a key feature of EFA is that the environmental potency of various human activities can be estimated and this level of detail in the analysis can be extended to different types of food and even to different packaging materials. Hence a direct environmental comparison, albeit rather crude, can be made between, say, throwing away a few slices of bread, and throwing away the empty plastic bag the bread was packaged in. Although the EFA factors used in this calculation are not precise, they do offer significant insight into where efforts should be placed in order to improve the overall sustainability of food packaging.
Combining EFA data with the detailed analysis of UK food waste by weight from the WRAP studies offers an opportunity to look at innovative packaging for various food types in a truly sustainable data-driven way. This framework approach is in stark contrast to most current sustainability initiatives involving packaging that largely concentrate on removing weight from a package and are therefore little more than cost reduction exercises in disguise.
Fig. 20.3 shows the EFA factors for food types, expressed in hectares per tonne, taken from the SEI/York document. The figure shows that, generally, the more food is processed, the greater the ecological footprint, and that, not surprisingly, intensively reared beef has the highest impact on sustain-ability per weight of product produced. By contrast, fresh fruit, bread and fresh vegetables have low EF factors of between 0.5 and 1.5 ha per tonne. This figure hides the true sustainability impact of wasted food by type, which can be revealed by multiplying this data by the WRAP tonnages of each food wasted. Using this information allows a new figure to be created showing the actual worse food types by total ecological impact (Fig. 20.4). This figure shows the large impact of wasted meat or fish-containing meals and, more surprisingly, that many of the low EF factor foods from Fig. 20.3, such as bread, potatoes and apples, are significant in the overall picture of food waste from a sustainability point of view, becoming ‘top ten’ candidates because they are wasted in such vast quantities.
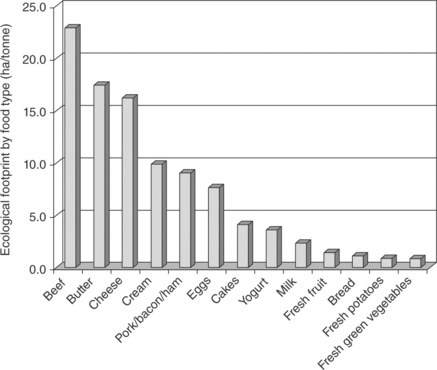
Fig. 20.3 Ecological footprint factors for various food types per tonne, fromBarrett et al. (2002).
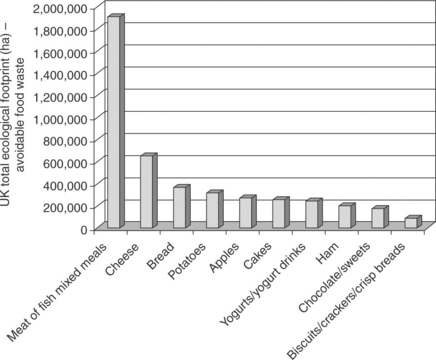
Fig. 20.4 Top ten wasted foods in the UK by ecological impact, created by combining data from WRAP (2008) with the EF factors of Barrett et al. (2002).
20.3 Sustainability of food waste versus packaging waste
20.3.1 Case study – sliced bread
In the UK, around 20 million slices of bread are discarded each day according to the WRAP studies, with crusts the main rejected part of the loaf. A comprehensive 2007 survey by the manufacturers of Hovis bread (FemaleFirst, 2007) found that in a typical UK family household, crusts from two slices of bread are thrown away every day, with one in five families (22%) throwing away the crusts from four slices daily. Furthermore it was revealed that 67% of British children do not like crusts and that 35% of parents cut the crusts off sandwiches for their children, thereby wasting up to 45% of the bread. Sandwich makers routinely throw away the two end crusts and the next slice at each end from each loaf (Stuart, 2009, p. 45).
We can compare by EFA this very typical food waste (say, two bread crusts) with the associated food packaging – in this case the LDPE plastic bag typically used to package a loaf of sliced bread in the UK. The total weight of two crusts on a typical 800 g loaf is around 116 g; this represents about 14–15% of the loaf wasted. One slice of sliced white bread is typically around 34 g, representing 4.25% of the loaf. A discarded empty LDPE bread bag weighs around 8 g. The corresponding SEI/York EF factors are 1.11 for bread and 2.42 for the plastic bag, in units of ha per tonne. A graph of the EF values in hectares (×106) comparing the plastic bread wrapper packaging waste with one slice, two end-crusts and half a loaf of bread waste (Fig. 20.5), shows that it is between six and seven times worse to throw away bread crusts than the bread packaging.
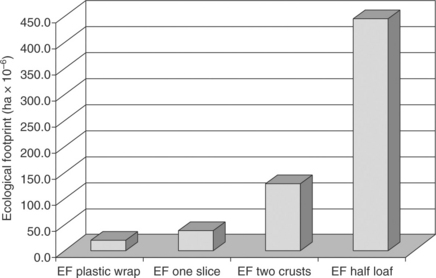
Fig. 20.5 Ecological footprint of sliced bread and its packaging. The environmental impact of throwing just one slice away is typically about twice that of the plastic bag containing the bread.
What this calculation underscores is the fact that even for a low EF food product like bread, the environmental impact of food packaging is minimal compared with the product it protects, and the greater the process steps a food goes through, the greater this difference is likely to be. For sliced white bread, throwing the plastic bag away is about equivalent in EF terms to wasting half a slice of bread.
20.3.2 Case study: yogurt packaging
Much is made in fashionable packaging circles of developments in ‘sustainable packaging’ – the idea that a particular package can be isolated from the rest of the supply chain and worked on by design, by changing packaging materials and by general lightweighting, to morph it into a more Earth-friendly container. Such efforts ought to be encouraged if the changes do not lead to greater product loss by reduced product quality or product damage, but even so they really do not amount to very much in terms of their impact on overall sustainable living and consumption. We can see this by examining the two different 150 g yogurt containers shown in Fig. 20.6.
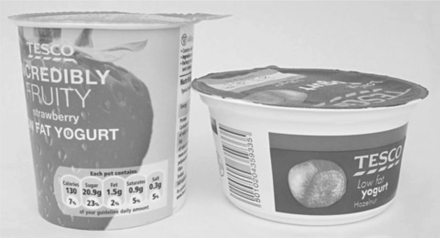
Fig. 20.6 Two 150 g yogurt containers with different sustainability ‘scores’ because of their weight and the materials used in their construction.
Container 1, on the left, weighs 6.60 g when empty (a 6.35 g PE-coated paperboard container with a 0.25 g heat-sealed plastic film lid). Container 2, on the right, weighs 7.60 g (a 6.75 g polypropylene in-mold labeled container with a 0.85 g heat-sealed aluminum foil lid). Container 2 is likely to have longer shelf life characteristics than container 1 on account of the use of superior barrier (lid and body) protection, but if these differences are ignored for the moment, it would be expected that container 1 would be the more ‘sustainable’ package because it is lighter and avoids the use of foil lidding which is the product of an energy intensive manufacturing process and is often poorly recycled.
The following EF factors in ha per tonne from the SEI/York study allow a comparison to be made of the two containers and the yogurt product: PE-coated paperboard ~ 2.6 (normal paperboard 2.56), plastic film = 2.79, polypropylene (assumed to be similar to HDPE) = 2.2, aluminum foil = 8.36, and yogurt = 3.61 (assuming plain yogurt, not flavored where the EF factor would be expected to be greater). The calculations give container 1 an EF of 17.2; while for container 2 the EF is 28% higher at 22.0 (units are hectares ×10‒6). This result is shown in Fig. 20.7 together with the EF impact of wasting 5%, 10% and the whole yogurt. The figure illustrates how insignificant a 28% more ‘sustainable’ yogurt package is, relative to the real problem – that of 1.3 million unopened yogurts and yogurt drinks discarded each day in the UK. The immediate thought is: why not work on packaging approaches that might encourage and assist consumers not to waste the product in the first place?
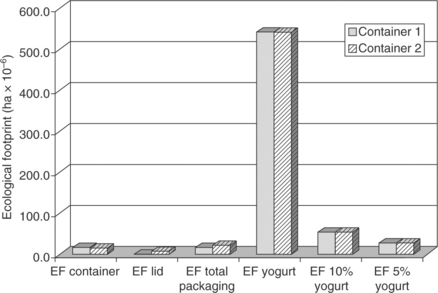
Fig. 20.7 The ecological footprint of the two yogurt containers when empty compared with wasting 5%, 10% and 100% of the yogurt. The impact of the packaging is minimal compared to the product it contains.
The figure also shows how even small residual quantities of yogurt left in the container can exceed the EF of the packaging itself. Consumers might be expected to easily leave 5% residual even with careful scraping of the yogurt pot. So this begs a further question: would it also not be better to work on packaging design and internal surfaces of yogurt containers that allowed consumers to fully empty and consume the product? We will return to this theme in Section 20.5.3 when discussing improvements in ‘hard-to-get-out’ packaging.
20.4 Food packaging and food waste
The principal role of packaging in the supply chain is to contain and protect the product. Adding a label or printing on the package provides information to the consumer. Protection against damage, contamination and spoilage is particularly important in perishable food products. There is good evidence to suggest that without packaging, food losses would be substantially worse than they currently are. Data from US municipal solid waste studies for example (Alter, 1991) have shown a roughly inverse linear relationship between the amount of food waste residues and packaging residues. So generally as packaging use (and subsequent disposal as waste) increases, food wastage decreases.
This means that the fashionable trend of retailing more and more fresh food without packaging needs to be questioned if we are serious about sustainability. Simply stripping away packaging from food to the point where consumers are happier, since there is less observable packaging waste in their homes, but food losses are driven up in another part of the supply chain, and possibly in the home itself, makes no sense. Obviously we should be concerned about packaging waste, and do all we can to minimize it, but it is the overall sustainability of a particular activity, such as the food supply and waste chain that needs to be considered. Since packaging waste is insignificant environmentally compared to food waste, we can feel confident that any packaging innovation with improved functionality and convenience, or in some cases simply more packaging, is of overall benefit if it helps reduce food waste.
20.5 Food-saving packaging
Having identified the most important foods that are wasted in the UK, and their ecological impact in the tonnages that go to landfill, we can now also use the WRAP insights into where and why consumers waste food to suggest packaging approaches that are likely to lead to reduced postconsumer food waste, by helping consumers manage their food inventory better.
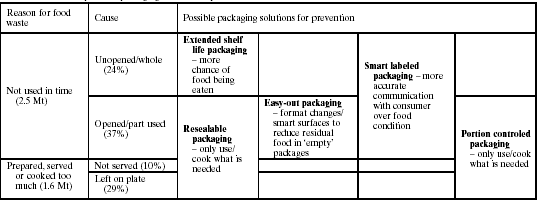
Recalling the most recent data for UK food waste (Fig. 20.1) and the reasons and possible causes, it is possible to map out where some existing packaging technologies and newly developed approaches might offer solutions to post-consumer food waste (see Table 20.1). Each of the five types of packaging innovation shown in Table 20.1 could have a direct bearing on avoidable food waste. For example, reducing the food waste component associated with ‘preparing, serving or cooking too much’ requires packaging to do much more to facilitate portion control and ensure foolproof resealability. Reducing the food waste component associated with ‘not used in time’ could be significantly impacted by the use of smart labels which give accurate information to the consumer about food condition. Each of these innovations will now be considered in more detail.
20.5.1 Portion-controlled packaging
When preparing food, consumers seem to find it difficult to gauge correct portion sizes and tend to err on the side of excess. According to the WRAP data (see Fig. 20.1), 39% of the UK avoidable food waste by weight falls into the category ‘prepared, served or cooked too much’. We do not know how much of this part of waste is food left on the plate simply because it is disliked rather than because the portion size was excessive, but smaller and portion-sized packaging would avoid the common problem of partially opened food drying out, and even if this resulted in a small increase in the amount of packaging used to create individual smaller ‘portions’, it might lead to useful reductions in the amount of food thrown away in the home. Society is rapidly changing too, with more elderly people, often living on their own, family members frequently taking meals separately so each can participate in their chosen social or sporting activities, and a rise in single person households. As a result this would also suggest that portion sizes need to get smaller not larger.
There is some evidence that, in the UK, some food retailers are beginning to offer consumers more sensible, smaller portion sizes. For example, Asda has three package sizes for pâté – 300 g, 150 g and individual 40 g servings (Fig. 20.8(a)); Marks and Spencer has embraced this trend with sliced bread, with the ubiquitous 800 g loaf appearing together with 400 g half and 200 g quarter-sized cousins (Fig. 20.8(b)).
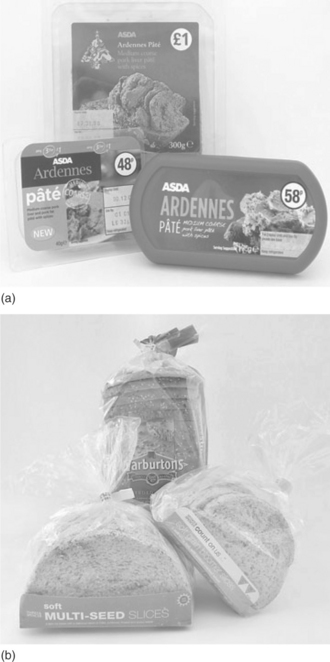
Fig. 20.8 Smaller portion sizes are slowly becoming available which might lead to useful reductions in the amount of food thrown away in the home. Pâté (a) and sliced bread (b) are two examples shown here.
Portioning can obviously be overdone, with the danger of appearing to consumers to be one more example of overpackaging. The growth in package sizes corresponding to 100 calories rather than weight is driven by marketing focused on consumer obesity concerns rather than food waste, but maybe a side effect of these smaller sizes might be reduced consumer food waste.
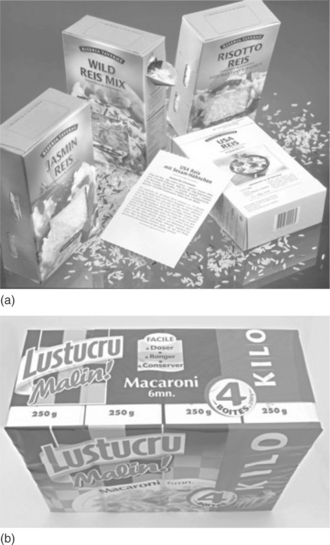
Frequently package sizes are too large and do not encourage or facilitate accurate portioning, nor do they, in general, make it easy to reseal either, exacerbating the problem of ‘preparing too much’. The packaging for rice and pasta-type products seems to suffer the most with, in general, no format or design features that might help consumers to correctly gauge a ‘portion’. Two examples illustrate what is possible in assisting consumers to get this right. The rice packaging shown in Fig. 20.9(a) helps the consumer by featuring an integral metal pouring spout and transparent windows down the box side showing 100 g 200 g, 300 g and 400 g marks indicating how much product has been used; the pasta packaging of Fig. 20.9(b) simply divides 1 kg into four smaller boxes, with each box producing an average serving as a side dish for four people.
20.5.2 Resealable packaging
This type of packaging can play a part in helping partially consumed food to remain palatable and therefore more likely to be consumed rather than wasted. It ought to be an essential element of packaging on large sizes of food packaging where portioning is not appropriate, e.g. for larger family packs. Again things in the UK are changing very slowly and there are many examples of packaging where the simple task of opening is not only difficult but also, when successful, virtually destroys the pack integrity, as in the sliced ham example shown in Fig. 20.10(a). Such packs are then worthless as receptacles for residual food to be kept for another day. The technologies of package resealablity are widely available (for example Fig. 20.10(b)) and ought to be ubiquitous in sliced and deli meat packaging of more than single portion sizes.
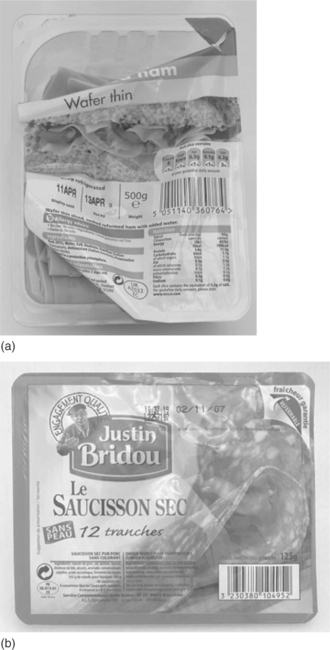
Fig. 20.10 Sliced deli meats dry out quickly once opened, increasing the chances of being rejected as food waste after a day or two in the refrigerator. Packaging that can be resealed to keep the rest of the slices fresh until they can be eaten (b), are preferred over packaging whose structural integrity is completely destroyed by the act of opening the pack (a).
Cheese is one of the foods that appears to have received this message, at least for some cheese brands (Fig. 20.11), and as one of the ‘top 10’ culprits for food waste, this development is welcome. In many other countries the use of zipped pouches for cheese is commonplace, but heat-sealed plastic is still widely used, as shown on the right of Fig. 20.11. This form of packaging cannot be resealed once opened. Note in this figure, the empty weight of both cheese packages is about same, so there would be no increase in packaging weight waste via this change but a big change with respect to consumer convenience, and possibly consumer food waste.
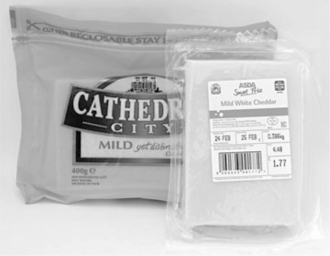
Fig. 20.11 Cheese is the second worse food type wasted in the UK (see Fig. 20.4). Zippered, resealable pouches as shown at the back are likely to keep cheese fresher for longer and hence more likely to be eaten, compared with the conventional heatsealed vacuum pack (front, right) which cannot be resealed once opened.
20.5.3 ‘Easy-out’ packaging
Any food packaging format that makes it difficult to remove food, particularly the last 5–10% cannot claim to possess positive sustainability credentials. As can be seen from Fig. 20.7, the embedded energy typically in that last 5–10% of product can be far in excess of that of the package. ‘Hard-to-get-out’ packaging is commonplace on today’s supermarket shelves, for example in the packaging of peanut butter, jam, honey, pasta sauces and many other products. High-on-shoulder glass jars containing viscous products (for example, Fig. 20.12) are a particular challenge; representing great design in many cases but a poor choice from a sustainability point of view.
Fig. 20.12 High-on-shoulder glass jars are a challenge to empty completely and residuals of 5–10% are common. Such containers are a poor choice from a sustainability point of view.
Real innovation in sustainability terms ought to come from innovative food packaging that leaves zero residues (waste) when emptied by the average consumer. In the US, Hellmann’s have developed a modern inverted plastic squeeze container for mayonnaise that has an inside coating or treatment to make it non-stick, so less is wasted when the container is ‘empty’ (Fig. 20.13).
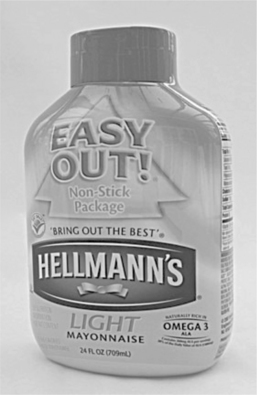
Fig. 20.13 Positive packaging sustainability efforts from Unilever’s Hellmann’s division – recognition that great products should not be wasted by poor packaging.
This insight poses yet another question: is the approach of concentrating a product, fashionable in sustainable circles as a means of reducing pack size and claiming environmental benefits, really valid if more of the product is left in the container?
20.5.4 Smart labeled packaging
In general, packaging needs to become smarter and deliver improvements in how the consumer experiences the product. For food products a major drive is for smarter labeling that better informs the consumer about aspects of food quality and safety, enabling the consumer to make better choices over whether food will be consumed or discarded. The smart labels currently being considered are color-change indicators, based on inexpensive chemical reactions, and fall into three different categories:
1. Time-temperature indicators to show shelf life more accurately.
2. Ripeness indicators for fruit that is difficult to judge whether or not it is ready to eat.
3. Freshness indicators to monitor signs of food degradation and hence food quality and safety.
Time-temperature indicators (TTIs)
The current ubiquitous date coding system is fatally flawed (Butler, 2006). Food degrades according to time duration at its exposure temperature, so date coding is only accurate if temperature is constant. For example, food stored in a refrigerator at 10°C might deteriorate anything from two to twelve times faster than if stored at 0°C depending on the mechanisms of deterioration. It follows that date coding is the least accurate way of informing the consumer about food quality and safety, since it assumes correct and proper storage of the food at microbiological dormant temperatures between 0 and 4°C.
In practice, widespread temperature excursions occur as food is transported home after purchase, taken in and out of the refrigerator, which may or may not to be set to the correct temperature, and occasionally left out of the refrigerator for extended periods. Since temperature is such a powerful destroyer of food quality, and safety if microbiological activity is rife, even a few hours at an elevated temperature could reduce quality to an unacceptable level or even compromise food safety. Furthermore, current date coding is not only inaccurate but is also poorly understood by consumers. In the UK, the recommended shelf life of short shelf life food is currently registered via a ‘use by’ or a ‘best before’ date label. In a recent FSA survey (Food Standards Agency, 2007), dramatically, only one-third of UK respondents correctly interpreted each term and less than half of the people surveyed mentioned looking for the date as a source of information.
In the UK, ‘use by’ dates relate to food safety while ‘best before’ dates relate to food quality. Food can safely be consumed after a ‘best before’ date albeit with some compromise in eating quality. A major reason for throwing food away is that the food is ‘out-of-date’, according to WRAP data. Nearly a quarter of avoidable food waste in terms of cost thrown away was disposed of because the ‘use by’ or ‘best before’ date had expired; this equates to a fifth of avoidable food by weight (WRAP, 2008, p. 140).
It is the inaccuracy and confusion over date coding terminology that leads directly to this food waste. There is no differentiation in consumers’ minds between the different types of date terminology so that according to the WRAP report, a majority of 61% say they never eat any type of food past the date on the label, 21% will not ‘take a risk’ with a product close to its date, even if it appears fine; 53% never eat past the date for fruit and vegetables and 56% never eat past the date for bread and cakes. Given that many foods have ‘best before’ dates, including the latter two types, they are almost certainly being discarded unnecessarily because consumers are interpreting a ‘best before’ date as a ‘use by’ date (Stuart, 2009, p. 63).
Similar confusion reigns in the US, leading to references to ‘confuse by’ dates (Bloom, 2009) and resulting in a similar by large proportion of avoidable food waste to the UK. Since date coding is very conservative (Bloom, 2009), when products are stored at the correct refrigeration temperature they are almost all perfectly good for about a week after the ‘sell by’ date passes, and the same is true for items with ‘use by’ dates, which in the US specifically relate to food quality and not food safety.
To help clarify the situation, what is needed are more accurate shelf life indicators that integrate time and temperature according to what excursions the food has experienced, and change color accordingly when the food is no longer safe to eat or has passed some point of significant quality degradation.
Time-temperature indicators (TTIs) use chemical reactions to exhibit an irreversible change of color in response to the combined effects of time and temperature, so offer the opportunity to measure cumulative abuse of products along the cold chain and in the consumer home. Applied as labels, they provide manufacturers, retailers and consumers with a simple, yet effective method of controlling the safety of perishable food product inventories. The consumer can then look for a simple color change rather than attempting to decipher esoteric date codes.
TTIs have been successfully used for more than 10 years by the leading French supermarket chain Monoprix (Fig. 20.14), and recently British Airways conducted trials with TTIs for their catered food served onboard aircraft. The technology also plays a critical role for the World Health Organisation in the distribution of temperature-sensitive products such as vaccines in developing countries.
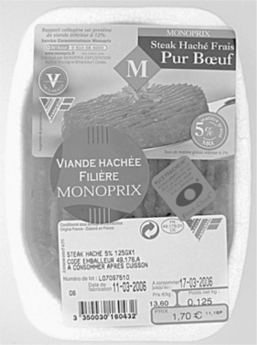
Fig. 20.14 A short shelf life food product from Monoprix with a TTI label to visually communicate freshness – when the central bull’s-eye of the ‘Puce Fraîcheur’ label turns darker than the outer layer, the product is no longer safe to eat. Color change time temperature labels are far more accurate than current printed date codes.
Ripeness indicators
Some smart label developments have taken inspiration from nature, where there are many color change chemical reactions at work associated with food degradation and ripening. As an example, the ripening of many fruit is accompanied by the emission of ethylene gas – easily detected by animals but not by humans, who therefore have real difficulty in deciding whether certain types of fruit are ripe in the absence of a color change. So ripe bananas are easy to spot, but fruit like winter pears, avocados and melons are not.
Scientists at the HortResearch laboratories in New Zealand have developed and commercialized the RipeSense® label (RipeSense, 2004), which is responsive chemically to ethylene inside the pack. This creates a smart package that informs the consumer via a color change label when pears are ready to eat and at a certain level of ripeness (Fig. 20.15). Since fruit and vegetables are a major source of post-consumer food waste, this innovation ought not only help consumers enjoy fruit more but also reduce the tendency for consumers to throw away unripe or overripe fruit.
Freshness indicators
Other smart freshness labels rely on the detection, and subsequent color change, if present, of certain metabolites – the gaseous by-products of microbial activity within packaged fresh food. For example, the generation of hydrogen sulfide in fresh poultry products and volatile amines in fresh meat and fish are known to be early indicators of microbiological activity and hence reduced freshness. Despite several start-up companies promising the emergence of a new era of freshness indicators on packaged meat products based on metabolite detection, there does not appear to be actual commercial examples in the marketplace at the time of writing (July 2010).
Details of TTIs and other ripeness and freshness color change indicators in development for foods such as fish, seafood, poultry and fruit, have been comprehensively discussed and reviewed in the book co-authored by Kerry and Butler (2008).
20.5.5 Extended shelf life packaging
Oxygen is the nemesis of food freshness, rapidly accelerating microbial and enzymatic degradation and other undesirable reactions. For this reason, both oxygen scavenging technologies and controlled or modified atmosphere packaging (MAP) are commonly used formats for perishable food to extend shelf life.
Oxygen scavenging as a technology has been available for a number of years and is in widespread use in the Japanese market, which favors a packaging format using oxygen absorber sachets. Inside the sachets are activated iron filings and the process of oxygen absorption is one of iron oxidation which is claimed to absorb oxygen inside sealed packaging to less than 0.01% and maintain it at this level. European market analyzers have looked at sachet forms of oxygen scavengers but have generally concluded that consumers may mistake the sachet contents for condiments. New developments in adhesive label or flat printed card versions which can be incorporated into the packaging are much less likely to cause this confusion. This is likely to be a more cost-effective approach to scavenging oxygen from a package than employing oxygen scavenging polymers as packaging materials.
Modified atmosphere packaging is commonplace in food packaging to slow down spoilage and thus extend the shelf life of the product without changing it, as is the case with preservatives. During the packaging process, the air is evacuated from the pack and replaced by other nitrogen/carbon dioxide/oxygen gas mixtures, according to food type. For example, carbon dioxide dissolves in water and forms carbonic acid (H2CO3), which acts as a preservative film on the surface of products that contain water. The acid environment inhibits microbial growth.
CO2/O2 mixtures, with nitrogen, are used for fruit and vegetables to extend shelf life, and it has been known for some time that for every harvested product there is an optimum ratio of oxygen, carbon dioxide and nitrogen, at which its shelf life and freshness are lengthened considerably. The product is surrounded by an optimized atmosphere initially, but over time the gaseous components change as the product continues its natural respiration. Some form of package permeation to gases is necessary to try to keep the modified atmosphere reasonably constant. One way this can be done is to micro-perforate the top packaging film (Multivac, 2009) to control gas permeation according to product type and gas need. This technology allows defined amounts of oxygen to enter the pack while carbon dioxide and ethylene can escape at the same time. Degradation is delayed, enabling shelf life to be extended.
However, pre-cut vegetables and certain fruit have high respiration rates, leading to early product deterioration, particularly if there are temperature fluctuations when polymer permeation rates cannot keep up with the necessary rate of gaseous exchange. To solve this problem, packaging materials have been developed to better control the modified atmosphere. They involve the use of smart breathable polymer films that change gas permeability according to temperature, adjusting the modified atmosphere accordingly, and have been commercialized in the US for a number of years (Breatheway, 1995). The technology involves the use of an acrylic side-chain crystallizable polymer for part of the packaging, tailored to phase change reversibly at various temperatures from 0 to 68°C. As the side-chain components melt, gas permeation increases dramatically, and by further tailoring the package and materials of construction, it is possible to fine tune the carbon dioxide to oxygen permeation ratios for particular products. The package is ‘smart’ because it automatically regulates oxygen ingress and carbon dioxide egress according to the prevailing temperature, allowing a further shelf life extension for fresh produce, increasing the chances that once bought the produce will be consumed rather than wasted (see Fig. 20.16).
20.6 Summary and conclusions
In the UK during 2008 and into 2010, the serious issue of food and drink waste has slowly moved up the social and political agenda. The communication associated with the issue, largely spearheaded by WRAP and supported by a recent book on the subject (Stuart, 2009), has helped raise public awareness, suggested positive ways in which consumers could reduce food waste, and contributed to a better understanding of the environmental and financial consequences. A growing number of people subscribe to the view that ‘reducing food waste should become one of the highest priorities on the environmental agenda’ (Stuart, 2009, p. 294).
Ecological footprint analysis is a useful methodology to quantify both individual and collective components of sustainability in complex systems such as supply chains. It leads directly to a greater insight into what factors have the greatest impact and conversely which have the smallest. Contrary to popular opinion, for example, it suggests that the media favorites of food miles and air travel have a very small effect on global sustainability. A key EFA insight is that the environmental impact of packaging is minimal compared with the product it protects, and this is particularly true for food. This result has consequences for well-meaning packaging professionals intent on making their particular package more ‘sustainable’.
A second insight is that small quantities of food left in ‘empty’ packages might be a greater sustainability problem than the packaging itself. This suggests that a rich vein of innovative packaging format and design thinking could usefully be devoted to new forms of packaging for thick or viscous products to try to ensure the package can be fully voided by the consumer without excessive effort, and food is not inadvertently wasted. Such efforts would significantly eclipse efforts to make a package, in isolation more ‘sustainable’, by for example lightweighting and substituting more eco-friendly materials of construction.
When combined with the WRAP data, EFA reveals that although foodstuffs like bread, apples and potatoes have a low environmental impact in their production, they are discarded in such vast quantities that their total environmental impact is almost as great as that of more highly processed foods.
On a practical note, five innovative food-saving packaging approaches are suggested that might impact on a typical consumer’s production of food waste – portion-controlled packaging, resealable packaging, ‘easy-out’ packaging, smart labeled packaging and extended shelf life packaging.
Of the five, it is considered that smart labeled packaging has the greatest potential, providing a solution to the defects inherent in the current consumer/packaging interface, where instructions are in many instances confusing, and difficult to read and follow. There is strong evidence to suggest that as an indication of shelf life, date coding is the single biggest problem in creating post-consumer food waste. Accurate shelf life data can most easily be provided by color change labels which integrate the passage of time and the various storage temperature excursions, changing color when a composite sum of exposure has been reached. Additionally, color change freshness and ripeness indicators could help consumers decide in a very visual way whether food is at the appropriate stage for consumption or rejection. It is anticipated that eventually the technology will move from color change chemistry to low-cost printed electronics on labels, leading to electronic self-adjusting use-by dates and other sensing/displays and a dramatically improved user interface with food packaging of the future.
Packaging has a key positive role to play in the prevention of food waste, both in getting food to the consumer and in providing the consumer with better ways of managing their food inventory, resulting in less waste. In the drive for a less wasteful society, food packaging should be minimized but this can only go so far before it has a negative effect. Lighter packaging may be fine but not if it creates greater product loss elsewhere. Controversially, there is an argument for adding more packaging if this would help consumers reduce food waste by an ecologically more significant factor in the home. The struggle to reduce food and packaging waste is now shifting from simple considerations aimed at reducing the direct weight of packaging. It is clear that what is needed is to take a fresh holistic view of sustain-ability rather than a narrow one which focuses on ‘sustainable’ packaging, particularly when it comes to food. To get this message across is a communication challenge of some magnitude, given the current public perception about packaging.
Packaging alone will not solve the food waste problem – food-saving packaging initiatives suggested in the previous sections should certainly help, but consumer awareness and changes in consumer behavior remain the key factors to solving the problem. Packaging has an important role and is a very visible statement to consumers of how we view our food products. If food is cheaply packaged, often in bulk quantities and poorly protected, this sends a distinct message to the consumer that this is a product with little intrinsic value, and can therefore be wasted without concern.
However, within this new framework of thinking, it is possible to reposition the packaging industry as a powerful pro-environmental force with a great sustainability story to tell – that of protecting products and helping to keep them out of the waste stream. In this vision of the world, there are a multitude of opportunities for real packaging innovation, some of which have been outlined and suggested here, that are consistent with a truly sustainable society.
20.7 Acknowledgment
The author wishes to thank Andrew Parry of WRAP for his encouragement, advice and assistance in our joint work to help understand the role of packaging in post-consumer food waste reduction.
20.8 References
Alter, H. The Future Course of Solid Waste Management in the US. Waste Management & Research. 1991; 9:3–20.
Barrett, J., Vallack, H., Jones, A., Haq, G. A Material Flow Analysis and Ecological Footprint of York, Technical Report, Stockholm Environment Institute, Stockholm, 2002. http://www.una.edu.ni/~cuadra/Post-Doc/biofuel%20proposal/literatura%203%20Feb/EF/york%20technical%20report.pdf [Available from: (accessed 3 August 2010).].
Bloom, J. Expiration Dates: They’re Helpful – and Confusing. Culinate Inc, Portland, Oregon, USA, 2009. http://www.culinate.com/articles/culinate8/expiration_dates [Available from:, (accessed 3 August 2010)].
Breatheway. 1995. http://www.breatheway.com/ [Available from: (accessed 3 August 2010).].
Butler, P. Developing a new dating game. Materials World. 2006; 24–25. [May].
Femalefirst Fussy kids waste a staggering 209 tonnes of crusts daily. First Active Media Ltd, 2007. https://www.femalefirst.co.uk/parenting/food-800.html [Available from: (accessed 3 August 2010)].
Food Standards Agency. Consumer Attitudes to Food Standards: Wave 8, England Summary Report, London, Food Standards Agency. http://www.food.gov.uk/multimedia/pdfs/cas2007ukreport.pdf, 2007. [Available from:, (accessed 3 August 2010)].
Jones, T.W. What a waste! ABC The Science Show, 4 December 2004, 2004. http://www.abc.net.au/rn/scienceshow/stories/2004/1256017.htm [Transcript available from: (accessed 2 August 2010).].
Jones, T.W., Food Loss and the American Household. BioCycle. 2006;47(3). http://www.redorbit.com/news/science/456435/food_loss_and_the_american_household/index.html [March. Available from: (accessed 2 August 2010).].
Kantor, L.S., Lipton, K., Manchester, A., Oliveira, V., Estimating and Addressing America’s Food Losses. Food Review. United States Department of Agriculture – Economic Research Service, 1997. http://www.ers.usda.gov/publications/foodreview/jan1997/jan97a.pdf [No. FR-20-1, January-April, Available from: (accessed 2 August 2010)].
Kerry, J., Butler, P. Smart Packaging Technologies for Fast Moving Consumer Goods. London: Wiley; 2008.
Multivac. The packaging solution for fresh fruit and vegetables, 2009. http://www.multivac.com/fileadmin/multivac/en/emag/solutions/customized-packaging-solutions/packaging-technologies/emap/freshsafe/index.html#/1/ [Available from:http: (accessed 3 August 2010).].
Ripesense. 2004. http://www.ripesense.com [Available from: (accessed 3 August 2010).].
Stuart, T. Waste – Uncovering the Global Food Scandal. New York: Norton & Company; 2009.
Wackernagel, M., Rees, W. Our Ecological Footprint. BC, Canada, Gabriola Island: New Society Publishers; 1996.
Wrap. The Food We Waste, food waste report v2, project code: RBC405-0010, Banbury, Waste & Resources Action Programme, 2008. http://www.wrap.org.uk/downloads/The_Food_We_Waste_v22_.bdc90813.5635.pdf [Available from: (accessed 26 March 2009).].
Wrap. Household Food and Drink Waste in the UK. Final report, Banbury, Waste & Resources Action Programme, 2009. http://www.wrap.org.uk/downloads/Household_food_and_drink_waste_in_the_UK_-_report.cdd02863.8048.pdf [Available from: (accessed 30 July 2010).].