
Chapter 5
Radiated Immunity Tests in a Reverberation Chamber
5.1. Introduction
Radiated immunity tests in reverberation chambers are the most frequently used test method. Because of its different properties, its use is particularly adapted for the evaluation of the immunity of electronic equipment. The very nature of the electromagnetic illumination leads to a global solicitation of the equipment, whereas the latter remains static. The electromagnetic illumination results indeed from a combination of illuminations uniformly distributed in incidence and in polarization.Readers can refer to Chapter 2 of this book for a description of the parameters controlling a cavity in such a way that it operates as a reverberation chamber. They are also invited to consult Chapter 3 for the statistical approach of the electromagnetic field, under the hypothesis of the ideal random field. Generating high field levels in order to notably answer the increasing strictness of the specifications, is a process facilitated by the density of the excited resonant modes.Obtaining cavities with a high composite quality factor creates this opportunity.
Readers can also refer to section 4.2.3 of Chapter 4, which describes the essential parameters controlling the composite quality factor, which is associated with the resonance of a reverberation chamber. This property has undoubtedly been another predominant factor in the promotion of this type of test.
The experience accumulated over many studies carried out around the world has led to the development of various propositions of test standards, which have now been enforced for several years [IEC 03, MIL 99, RTC 07]. We will come back to the context of these standards later in this chapter. In this context, the reverberation chamber is proposed as an alternative to the test methods previously defined in an anechoic chamber.
The aim of this chapter is to describe the main steps of the implementation of a radiated immunity test in reverberation chambers. We will take a more specific look at the calibration stage. Its objective is to ensure that the Faraday enclosure behaves like a reverberation chamber on the entire frequency band of the test. The strictness of the calibration criteria is a matter of assessment. In the context of electromagnetic compatibility tests, the goal is to ensure a reasonable level of reproducibility. We will then present the main properties of the test itself. In all the following stages, the statistical evaluations are carried out from samples collected at one or sever allocations within the reverberation enclosure. The statistics of the field in one specific location is observed during the rotation of a stirrer and is implicitly considered equivalent to the one we would obtain by carrying out statistics on a set of measurement points: this is the ergodic hypothesis, which is discussed in Appendix 1 of this book.
5.2. The calibration process
The calibration process of a reverberation chamber is systematically required prior to the start of these tests. This is quite a long process which is why it is only carried out periodically, i.e. once a year or so. Only a brief check process of the calibration may be required during the test on electronic equipment.
This process uses an amplification chain leading to the supply of an antenna.This antenna, placed in the reverberation chamber, produces the electromagnetic field in the Faraday enclosure. The calibration aims to check one or several criteria ensuring that the cavity behaves as a well-operated reverberation chamber.Generally, the criterion selected by the standards is the statistical uniformity of the distribution of the electromagnetic field radiated in the enclosure. Strictly speaking,this is not a check for the stationary nature of the field statistic but rather an evaluation of the statistical uniformity or spread of some moments of the field distribution. The conformity with standard minimum requirements is then established with reference to a template indicating the uniformity threshold which is to be taken into account. It is also necessary to specify that these properties are generally checked for a continuous wave signal, and therefore carried out for many signal frequencies on the entire frequency band of the test. Obtaining a satisfactory reverberation behavior is harder to ensure when the cavity is not sufficiently oversized compared to the wavelength. Indeed, we have seen that the mode density in the chamber must be significant enough and that this density tends to become lower because of the decrease of the operating frequency. As a result, calibration is a process which is more critical in the low frequency domain of the spectrum commonly envisaged for the tests. We describe below the method typically used for the calibration of the reverberation chambers.
5.2.1.Measurement methods of the statistical uniformity of the field distribution
The measurement of the statistical uniformity must be carried out with the help of a significant amount of data received with a field probe. Indeed, we admitted in Chapter 3 the behavior of the field was similar to that of a random variable.Thereupon, any estimate of a characteristic of this random variable must be based on a sufficient population of realization of this random variable: this is the law of large numbers. However, on the practical side, we will naturally look for an acceptable compromise, which will enable us to limit the measurement time. To evaluate the statistical uniformity of the spatial distribution of the field, we need in principle to reproduce the same statistical estimate at several points of the enclosure.
Finally, we need to determine the nature of the statistical estimate, the number and the position of the measurements points and lastly the calculation of a quantity leading to the evaluation of the uniformity of the empirical statistical distribution.
5.2.1.1. Nature of the statistical estimate
There is a large range of possible estimators to be calculated from a series of realizations of a random variable. The simplest estimate is the empirical arithmetic mean of the sample that converges on the first moment for an infinite sample..Another useful estimate is the standard deviation (square root of the second moment) of this population. More generally, the empirical probability densities from one sample to another can also be evaluated. It is then about checking the stationary state of the random “electric field” variable in the working volume.
However, in terms of electromagnetic immunity, the indication of the maximum field amplitude generated in a reverberation chamber is considered to be relevant in terms of possible susceptibility of the equipment under test. We can indeed admit that electronic equipment can be sensitive to a disturbance when a critical field threshold has been overcome [HOI 06, HOI 08]. Consequently, it is thus this maximum field value which will be carefully examined in the chamber. Most of the time we seek to closely control this maximum field value.
At this stage, it is necessary to highlight an important point for the understanding of the immunity test in reverberation chambers. Let us assume that we estimate the maximum electric field according to one of its rectangular components: denoted byEr_max . This does not mean at all that the volume corresponding to the future location of the device under test is illuminated by a uniform field of Er _max value. The electromagnetic field is indeed distributed in an almost random way in the space, following the process described in Chapter 3. More specifically, this is true in any pair of points for which the spatial uncorrelation property presented in Chapter 4(section 4.2.4) is admitted, i.e. when these points are distant from one another by at least λ/2 [HIL 02]. This however means that during the test, the excursion of the electric field will reach a value close to Er max , at any place of this volume and according to one or another polarization.
During the stirring process and at any point of the space, this excursion can reach this value, but in a totally asynchronous way. We thus highlight here the local and arbitrary nature of the illumination during the estimate of the electric field maximum.
The spatial uniformity of the distribution of maximum field amplitude evaluated at some places in the test volume is then observed. The collection of the realizations forming this empirical distribution is carried out with the help of the mode stirring method used (or rather using a step by step rotation, i.e. a mode tuning procedure).Most of the time, this method uses a mechanical mode stirrer. The current standards are all based on the use of a mechanical stirrer in rotation. However, other stirring methods could be considered, notably frequency agitation around the working frequency, as is described in Chapter 4.
In the context of mechanical stirring, it is then about selecting a sufficient number of stirrer positions during its rotation. This evaluation relies on the uniformity criterion, which is effectively required. A preliminary theoretical analysis enables us to anticipate the nature of the result.
By assuming that a rectangular component of the electric field follows Rayleigh’s distribution, we can recall the cumulative distribution function associated with FR described in Chapter 3 (see equation [3.94]), so that:
[5.1] 
The FR_ Max cumulative distribution function of the Er_max maximum for N independent trials (Er1 , Er2 ,…, ErN ) of this random variable is deduced from the cumulative distribution function of the initial variable as follows:
[5.2] 
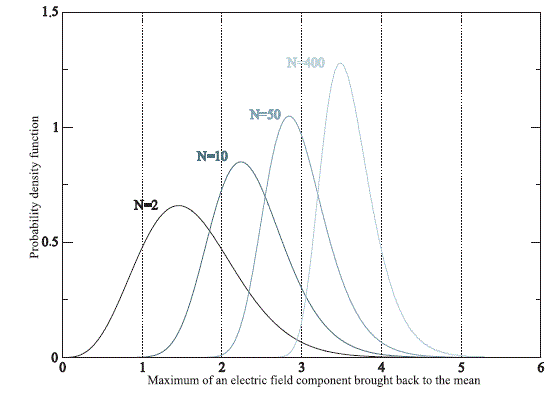
Figure 5.1.Probability density function of the maximum to mean ratio of a rectangular component of electric field following Rayleigh’s distribution, according to the number N of independent realizations collected for the estimate of this ratio
We can then deduce, from a theoretical point of view, the probability density function of this maximum of a field component, by deriving expression [5.2]. To free ourselves from the quantity of power injected in the chamber, it is useful to standardize the obtained result by bringing it back to the mean of this fieldcomponent.
Figure 5.1 shows the evolution of the probability density of this ratio as a function of the sample size N. These pdfs of a field component maximum are plotted for N = 2, 8, 32, 128 or 512. We notice that the evolution of this ratio is very sensitive to this number N, especially when N is low. Indeed, when we have very few measurements of a random variable, the probability to extract from it a significant extreme value is not so high1. Moreover, the spreading of the distribution of the probability distribution is lower with the increase of N. Beyond a significant number of observations, the expectation of the maximum tends to increase more and more moderately. Several tens of measurements are sufficient in this context to estimate a maximum value of an electric field component, with a reasonable margin for measurements of electromagnetic compatibility. For N = 32, the expectation of this maximum value is about 2.2 (i.e. about 7 dB above the mean), where as for N = 128, it reaches 2.6 (8.3 dB above the mean). The standard deviation of this estimate is lower than 15% and the spreading of the distribution measured with a confidence interval of 95%, is about +/-25%. Let us recall that all of this is established under the assumption of an ideal chamber corresponding to interferences of plane waves with random incidence and polarization as formulated by Hill. At this stage, it is necessary to stress the hypotheses, enabling us to establish this theory[HIL 98].
Hill’s model assumes in reality that the cavity is spherical, for which no propagation direction is favored. In addition, this cavity is assumed to be without losses and the mode density is assumed to be infinite. Figure 5.1 lets us however think that, by increasing the sample size N with appropriate stirring procedures, it is always possible to increase the expectation of the maximum field. Some physical factors will however strongly limit this theoretical point of view. First, indefinitely increasing N is only useful if the mode density is precisely infinite. In reality, this mode density is limited and the number of independent excitable states through the intervention of the mode stirrer is also consequently limited. Second, the finite composite quality factor of the chamber obviously limits the maximum field level.This model is however sufficiently realistic in order to depict with satisfactory precision the behavior of the reverberation chambers, for reasonable values of N(tens or hundreds) and when the wavelength is small in front of with respect to the cavity dimensions.
These curves also show that the expected statistical uniformity of the maximum field is evidently assessed within some margin to be defined in line with users’ requirements. This is even true for a model based on the idealizing hypotheses, such as the one applied for Figure 5.1 The standards describing the calibration methods indicate minimum uniformity requirements under the form of a limit criterion. This criterion is necessary to ensure that the uncertainty of the maximum field value in the working volume of the chamber lies within acceptable limits. Several criteria enable us to assess this uniformity. The general form of the criterion that is typically used is related to the observation of the deviations between several local estimates indifferent points of the working volume of the maximum electric field value. Let us note S , the parameter quantifying this deviation. This parameter is expressed as follows:
[5.3] 
with:
[5.4] 
and:
[5.5] 
with ![]() , the empirical estimate of the standard deviation of the maximum of a field component, and P, the number of independent experiments of estimation of the maximum of a rectangular field component carried out in P loci of the chamber’s working volume. The presence of the P-1 factor in expression [5.5] is justified by the fact that the empirical estimator of the standard deviation of a distribution tends asymptotically to the second moment of a distribution according to:
, the empirical estimate of the standard deviation of the maximum of a field component, and P, the number of independent experiments of estimation of the maximum of a rectangular field component carried out in P loci of the chamber’s working volume. The presence of the P-1 factor in expression [5.5] is justified by the fact that the empirical estimator of the standard deviation of a distribution tends asymptotically to the second moment of a distribution according to:
[5.6] ![]()
This property was recalled in section 3.4.3 of Chapter 3. This is thus a corrective factor applied for low numbers of realizations [PAP 02]. The P samples can correspond to several field components which are measured at the same point or to the measurement in several points of the volume of the reverberation chamber. We thus implicitly check in this last case, the ergodicity property (see Appendix 1) of the measured signals. For this ergodicity property, it is equivalent to observing the evolution of the signals at several points of the reverberation chamber.
For each one of the P samples of data, we carry out an estimate of the maximum of the chosen electric field component. This estimate is achieved for N independent situations of field distribution in the chamber, N being the sample size. These independent situations are generally obtained via the rotation of a mode stirrer by steps of 360/N degrees. Thus for the ith sample, that corresponds to measurements at the ith probe position or orientation, we obtain:
[5.7] ![]()
where Er(i)j corresponds to the measurement of the electric field component at thejth position of the stirrer for the ith position of the probe.
On theoretical, but unrealistic point of view, the perfect statistical uniformity in the reverberation chamber thus corresponding to ![]() would result in (equation [5.1]) S = 1. Figure 5.1, resulting from a Monte-Carlo type simulation, shows that the cumulative distribution function decreases because of the number of observations, without even allowing us to do a perfect estimate, even with 512 independent observations. A reverberation chamber is known to conform with the standard requirements, when the S parameter is lower than a maximum threshold which can be dependent on the frequency, so that:
would result in (equation [5.1]) S = 1. Figure 5.1, resulting from a Monte-Carlo type simulation, shows that the cumulative distribution function decreases because of the number of observations, without even allowing us to do a perfect estimate, even with 512 independent observations. A reverberation chamber is known to conform with the standard requirements, when the S parameter is lower than a maximum threshold which can be dependent on the frequency, so that:
[5.8] ![]()
For the main part, a calibration process thus consists of validating the correct behavior of the stirring process established in the cavity on the basis of this criterion.It is naturally necessary to determine the specific evaluation conditions of this criterion (the number of measurement points P and positions of the stirrer N) and to determine the acceptable limit Smax ( f ) , with the prospect of implementing tests. The measured magnitudes (field components, total field, power collected at the terminals of an antenna) must also be selected. The number of observation points P and number of positions N of the stirrer must also be adjusted in order to carry out the calculation of S. We will study these different points in greater depth in the next sections in the following description of the calibration methods.
5.2.1.2. The Smax ( f ) limit
The gauge imposed with the prospect of the validation of the test device evidently plays an important role. It first reflects the tolerance that the standard-developer gives to the test laboratories, in terms of field uniformity and thus of the reproducibility of the measurements from one laboratory to another. Indeed, if the Smax ( f ) constraint is not sufficiently strict, the spreading of the calibration curves from one chamber to another is likely to be significant. This would thus result in possibly large variation of maximum field amplitudes in the working volume. These variations or non-uniformities may be very different from one chamber to another.As far as reproducibility requirements are concerned, the radiated immunity test in reverberation chambers is defined by standard bodies in relation with the performances described for the test methods in an anechoic chamber. An example of these test methods is found in [IEC 02].
We will take, for a first example, the template proposed in the framework of the standard document of the international electrotechnical commission (IEC),referenced CEI-61000-4-21 [IEC 03] (see Figure 5.2).
Figure 5.2. Limit of ( 20log(Smax ) in dB) proposed by the CEI-61000-4-21 standard,as a function of the usage frequency (MHz) of the reverberation chamber
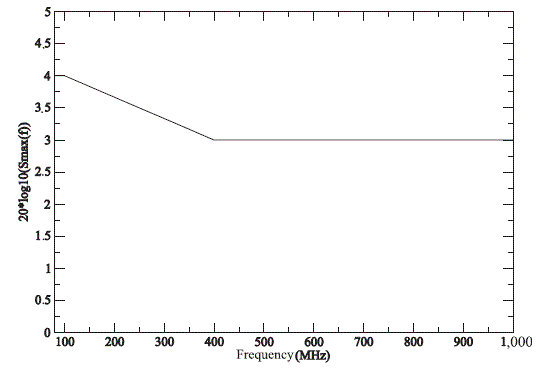
Beyond the frequency of 400 MHz, the requirement set by the standard no longer depends on the working frequency. Below this threshold, a higher tolerance is admitted and Smax ( f ) can reach the limit value of 4 dB for any frequency lower than 100 MHz.
Considering what has been previously said, increasing the limit Smax ( f )corresponds to a lesser requirement on the statistical uniformity of the field maximum in low frequency regime. It is mainly the consequence of current Faraday enclosures set up as reverberation chambers, which are currently used to perform the radiated immunity test, in many test labs. Finally, no recommendation for the minimum dimension of the reverberation chamber is a priori required. However, it has been empirically noticed that the behavior of a Faraday enclosure can only be compared to an ideal random behavior beyond about five or six times the first resonance frequency of the chamber.
Let us evaluate, at least approximately, the geometrical volume of the chamber which would result from such a constraint for the first resonance frequency of the cavity. Suppose a Faraday enclosure with a square base reaching a state close to the ideal statistical properties at 80 MHz, would require a chamber with a 15 m side.The usual dimensions of the anechoic installations equivalent for the same type of radiated immunity test are about 8 m x 4 m x 3m. These installations are also typically used from 80 MHz. A Faraday enclosure of equivalent dimension would have an almost ideal behavior beyond 240 MHz.
The low-frequency behavior is characterized by the shortfall of the mode density in the cavity. This leads to the limitation of the distribution degrees of freedom of the electromagnetic field. It also corresponds to a lesser performance of the mechanical stirrer, whose dimension must be compatible with the dimension of the elementary modal cell, as was explained in section 2.4.2 of Chapter 2. Consequently, the distribution of the samples can significantly move away from a Rayleigh model and secondly, the number of independent realizations really available can be considerably reduced. It can thus lead to larger spatial fluctuations of the field distribution, and in particular, such fluctuations are also found with regard to the level of the maximum electric field.
In a high-frequency behavior, the threshold set at 3 dB by the standard taken as an example has also been adopted by other standard documents. This number is to put into relation with the spreading properties observed in an ideal framework,according to Figure 5.1. To evaluate the scope of it, it is necessary to set the number of positions of field measurements and the number N of collected measurements,which is evidently specified by the standard. In the following, we will continue to rely on the CEI-61000-4-21 document. The number of points set to observe the spatial uniformity of the electric field is eight. These points are distributed at the summit of a dummy parallelepiped which includes the entire working volume. We can also note that this choice is not really significant: any other point inside this zone could have been selected. The points at the border of the working zone can however be closer to the cavity walls. Below a distance lower than a quarter of the wavelength, the statistical uniformity properties of the field according to these three components are difficult to find again. At these eight points, resorting to a tri-axial field probe enables us to measure the three rectangular components of the field. The analysis of the distribution of the maximum field amplitude over the different positions can also be carried out according to each component or to the total field.
In the case of an ideal reverberation chamber, it is possible to simulate the statistical distribution of S as a function of the number N of independent observations, with the help of a Monte Carlo simulation process [PAP 02]. Figure5.3 represents the expectation and the 2.5% and 97.5% quantiles of this distribution for eight positions of the field probe, for which the rectangular components of the electric field are recorded at N positions of the stirrer. Let us note that, from the statistical point of view, the analysis on eight values of the rectangular field components (a component according to ox, oy or oz) leads to a higher statistical variation for S than the one on 24 values of rectangular field components (i.e. the accumulation of the three components according to x, y, z; components which are measured in eight points). This situation, the most pessimistic one, is thus interesting compared with the Smax ( f ) limit, which is imposed, for an electric field component, as well as for all the components combined.
Figure 5.3. Expectation and 2.5% and 97.5% quantiles of the magnitude ( 20log(Smax ) in dB)for an ideal reverberation chamber (Hill model). Results obtained by a Monte Carlo simulation on the observation of eight rectangular components of the electric field following a Rayleigh distribution
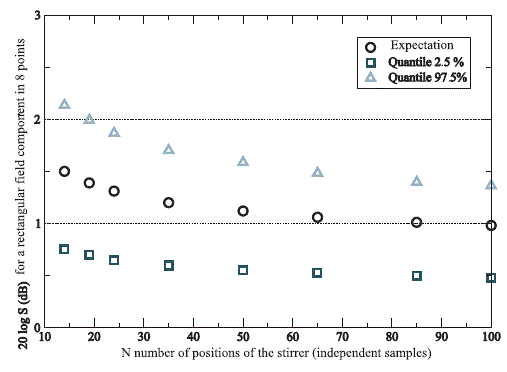
We can conclude that satisfying the Smax ( f ) limit, as is proposed in Figure 5.2, is systematic, as soon as a reverberation chamber is ideal. The threshold at 3 dB is an important margin in this context, because from 12 positions of the stirrers, the quantile at 97.5% is located far below 2.3 dB. This margin includes the imperfections of a real reverberation chamber compared to the ideal Hill model.These imperfections can first come from the non-uniformity of the incidence angles of the waves which are associated with the different propagation modes created in the rectangular chamber. The finite mode density and the value of the composite quality factor may also contribute to some departure from the ideal random field distribution. The result in Figure 5.2 shows that if the Hill model is valid, it is quite unlikely to cross a Smax ( f ) threshold of 3 dB, which is the stipulated limit on a major part of the frequency band of the tests.
In practice, the ideal model is the reference for the upper part of the operating frequency spectrum of the reverberation chamber. The drift compared to the ideal model (Hill model) is larger when the observation is carried out in a long wavelength regime, for which the cavity is less oversized and the mode density is lower. The threshold at 3 dB can be interpreted as a margin connected to this imperfection. This threshold is therefore also compatible with the uniformity levels usually considered in an anechoic chamber for equivalent immunity tests. The modification of this threshold in the low frequency band of testing, is an additional allowance, empirically determined, whose justification is less clear.
Indeed, according to what has been previously said, getting close to 3 dB is already the sign of a significant drift of the experiment, in reference to the Hill model. Introducing an upper limit for Smax ( f ) at 4 dB (or even at 6 dB in the most recent version of the standard for aeronautical equipment, i.e. the RTCA DO 160 F document [RTC 07]) in the low frequency regime, clearly consists of moving away from the usual criteria enabling us to qualify the behavior of a reverberation chamber, such as those presented in Chapter 4. The examples of the calibration results presented in section 5.3 of this chapter will illustrate this matter.
5.2.1.3. Selection of the measurement points and of the stirrer positions for the calibration. EN 61000-4-21 and DO 160 section 20.6 standards
We will mainly rely on the two test standards which are the most widely spread nowadays: the EN61000-4-21 standard which has already been discussed and the standard devoted to aeronautical equipment, the DO 160 standard, section 20.6. Both follow the same calibration process, however, with a few minor differences.The DO 160 standard potentially uses nine measurement locations, i.e. an additional position at the center of the parallelepiped.
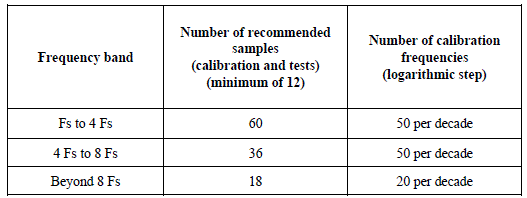
Tables 5.1 and 5.2 summarize the calibration parameters in terms of numbers of the required implementations, i.e. the number of positions of the mechanical stirrer.They also specify the number of frequency points for which the empirical statistic Sis checked to be less than the Smax ( f ) limit. We will notice that the instructions relative to the number of stirrer positions are different from one standard to the other. The recommended number of measurements is also related to the frequency,according to empirical rules. This can also explain that the two standards do not quite converge on the same numbers. However, the two documents are in agreement on the minimum number of required positions of the stirrer at the end of the calculation: 12.
Table 5.1. Calibration parameters required by the EN 61000-4-21 standard (2001).The starting frequency Fs is in principle fixed at 80 MHz
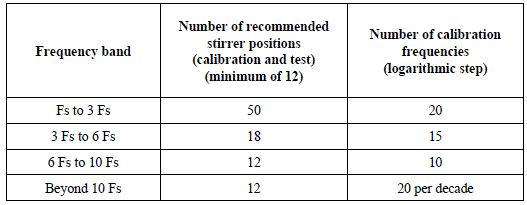
Table 5.2. Calibration parameters required by the DO 160 standard section 20.6.The starting frequency Fs is in principle set at 100 MHz
As mentioned above, the curve in Figure 5.3 confirms that for a chamber with ideal statistical properties, a low number of independent observations forming the eight collected samples is sufficient to notice, with a very high probability, a statistic S lower than 3 dB. The limitation of this number of stirrer positions evidently has a practical consequence, because it leads to time saving for the calibration process, but above all for the test procedure. The number of independent realizations is thus not a very critical piece of data in relation to the calibration process. The standard-developer thus advocates a significant number of positions, but indeed requires only a very low number of positions. However, the impact is not the same when we consider carrying out the radiated immunity test on the equipment itself. Regarding the evaluation of the immunity of the device under test, the objective is not to check a threshold at 3dB, but can be to establish a susceptibility level with an acceptable precision. In this context, the number of stirrer positions which are practiced during the test, condition quite strongly the uncertainty of the measurement.
We can refer to this matter once again in Figure 5.1 for which, for example, it is easy to notice that the variations of the maximum field estimation from measurements is significantly higher when N is low. However, in the frame of a standardization document, its means that it is possible to reach higher measurement accuracy at the cost of a longer test time, but it is not always necessary with regard to the measurement uncertainties tolerated for any other test facilities.
5.3. Examples of calibration results
We give in this section a few examples of calibration results, which are obtained in different reverberation chambers of quite different dimensions. In the following,the protocol used is the one dictated by the DO 160 standard. Concerning the calibration procedure, this standard differs by the use of nine probe positions instead of eight for the CEI 61000-4-21 standard. Beyond the instructions of this document and in the frequency band for which we give the results, the number of stirrer positions is constant and fixed at 60.
The first result presented here concerns the reverberation chamber A, whose volume is about 24 m3. The excitation of the chamber is ensured by a biconic antenna between 80 MHz and 200 MHz, and then by a log-periodical antenna from 200 MHz. The transmitting antenna is set outside the working volume and positioned so that the main radiation lobe is not directed towards this volume. The antenna is supplied with a signal with adequate amplification provided by a wide band power amplifier connected at the output of a continuous wave generator. This amplification is necessary because of the poor efficiency of the field probe used in reception. The chosen probe is a small-size triaxial probe which is sensitive to electric field levels of about 1 V/m. This allows us to simultaneously record the three orthogonal components of the electric field. The total number of measurements required for the chamber calibration for only one frequency of the input signal is thus of three field components times nine positions of field probes times 60 stirrer positions, i.e. a set of 1,620 individual field measurements. The positions of the probe correspond to the angles and to the center of the parallelepiped forming the working volume. The dimensions of this volume are chosen so that any point of the working volume is located at a distance greater than λ/4 at 80 MHz, i.e. about one meter away from any device or any metal wall.
Figure 5.4. shows the layout of the criterion of deviation S calculated according to expression [5.3], and for each one of the rectangular field components according to the three perpendicular directions. The objective here is not to precisely establish the working frequency from which this reverberation chamber is in conformity with the reference standard, but to find the main tendencies of these curves. We first need to note that the lower zone of the spectrum (from 80 MHz to about 150 MHz) result sin significant deviations, which reveal that the mode density is probably not sufficient. The significant S deviation shows in this context the ability of a chamber to locally create resonances whose maximum field distributions are not uniformly distributed within the working volume. Beyond 600 MHz, this deviation tends to decrease below 2 dB. We then get close from the results expected in the hypothesis of an ideal random field. Indeed, according to Figure 5.3, the expectation of S is slightly higher than 1 dB. The theoretical distribution function plans that S is located between about 0.5 and 1.5 dB, with a confidence interval set at 95%. The distribution of the experimental results is apparently located slightly above this interval. In reality, this is the sign of a minor drift compared to the Hill model. At the origin of such a small drift, several explanations are possible. In addition to the fact that it is not certain that the set of 60 measurements made during the stirrer rotation are perfectly independent realizations, it is also possible that the mode density is slightly insufficient to totally satisfy Hill’s hypotheses; these hypotheses are relative to the uniformity of the incidence angles of the plane wave spectrum. A more in-depth analysis, such as in Chapter 8, is generally necessary for the detection of the existence and the origin of these imperfections [ARN 02, LEM 08, ORJ 06].However, from the point of view of the objective of a normative test, which is to guarantee a minimum reproducibility level, the 3 dB threshold is respected in this chamber from about 270 MHz.
These results can be compared to those obtained for the same conditions in the reverberation chamber B, whose volume is about four times larger (93 m3). The length of this reverberation chamber B is in particular much longer than its other dimensions. The general form of the evolution of the S deviation as a function of the frequency, is quite similar to the one observed for the reverberation chamber A. We distinguish two zones: one where the statistical uniformity is insufficient in low frequency regime (below 200 MHz), and the other where this statistical uniformity gets close to the ideal conditions beyond 400 MHz. The B reverberation chamber does not create much better results than the A reverberation chamber. The mean statistical deviation is on average located below the A chamber in the upper part of the spectrum. This is probably revealing of a denser plane wave spectrum. In the lower part, the 3 dB threshold is reached from about 250 MHz, which is not significantly lower. However, beyond 250 MHz, there are no more frequency points for which the deviation remains close to the 3 dB threshold. If we refer to the 3 dB threshold, this point shows that the increase of the volume of a chamber following only one of these dimensions is not necessarily sufficient to reduce the lowest usable frequency. It naturally enables us to increase the working volume according to this dimension.
Figure 5.4. Deviation criterion compared to the mean of the maximum field amplitude on nine points for each one of the three field components, resulting from the calibration of the A reverberation chamber (24 m3)

Let us complete these observations this time by gathering the measurements carried out on three field components. This grouping enables us to extract, from among 60 x 3 measurements in only one spatial point, a maximum field amplitude according to any of its components. The S deviation is then brought back to the mean of these maximums on the nine spatial measurements carried out. We compare, in Figure 5.6, the S deviation thus calculated for the two A and Breverberation chambers, as well as for another reverberation chamber: the Creverberation chamber. This other chamber is of intermediate dimension, with a volume of about 35 m3. The 3 dB threshold is crossed from 200 MHz for the chamber of 24 m3, from 210 MHz for the chamber of 93 m3 and from 150 MHz for the chamber of 35 m3. The results can seem surprising at first.
However, in these frequency bands for which we can talk about intermediate regime, the increase of the volume according to a direction (A chamber) is probably slightly detrimental to the perfect equilibrium between the three field components.On the contrary, the C chamber presents an increase of the volume according to more than one dimension. We can refer to Chapter 2, where the mode of evaluation of the mode density in a rectangular cavity is given.
Figure 5.5. Deviation criterion compared to the mean of the maximum field amplitude on nine points for each one of the three field components, resulting from the calibration of the B reverberation chamber (93 m3)
The shape of the curves in Figure 5.6 conforms once again with the shapes presented in Figures 5.4 and 5.5. Seemingly, the observation of the standard deviations of the maximums for all the rectangular components merged at the same point or on the separated rectangular components, does not alter the conclusions. We can thus deduce from this that the electromagnetic field is distributed in a sufficiently uniform way according to the three directions of the space. The general level of the curves is located below the curves drawn for the rectangular components, which are taken separately: the margin compared to the observed threshold is thus more important. The analysis of the maximum is carried out among the set of the three merged components which are observed at 60 positions of the stirrer. In the hypothesis of an ideal chamber, these three components can be considered as independent and the process comes down to observing a sample of 3 x 60 measurements. The observation of the curves tendency in Figure 5.3 could enable us to anticipate this result. It is thus not surprising to obtain a decrease in the mean standard deviation. Although the three chambers are of different geometry, it is difficult to distinguish between the three results.
Figure 5.6. Deviation criterion compared to the mean of the maximum field component on nine points for all of the field components; this criterion results from the calibration of the A reverberation chamber (24 m3), the B reverberation chamber (93 m3) and the C reverberation chamber (35 m3)

5.4. Implementing of the immunity test for a piece of equipment
The introduction of the device under test in the reverberation chamber systematically alters the field distribution in the enclosure. This modification can intervene in several different ways. Indeed, the device on its own is responsible for a new distribution of the energy in the chamber, for example by (back) scattering the incident electromagnetic energy or by absorbing part of this energy [HIL 94]. This latter effect is naturally involved in the limitation of the total energy stored in the enclosure and thus in the limitation of the maximum field amplitude. A device of moderate size can significantly alter the observed field amplitudes. However, it is almost not possible for it to alter the electromagnetic field distribution so that the stationary statistical properties of the field are no longer noticed. This alteration is however possible, especially in the lower part of the usable frequency spectrum of the chamber, when the device occupies a significant volume. Under these conditions, it becomes much more hypothetical to obtain resonant modes insufficient numbers.
In addition to the description of these tendencies, it is not possible to mathematically quantify a priori the modifications brought by the equipment under test. These modifications may concern its energy absorption and the statistical properties of the field distribution. It is thus necessary to carry out an experimental investigation in the presence of the equipment.
5.4.1. The loading effect of the device under test
The loading effect of the device under test is determined with a simple method,consisting of quantifying the variation of the energy stored in the enclosure in the absence and in the presence of the object, for a constant power transmitted to the chamber. The prescribed method by the standardization commission consists of measuring the average power received at the terminals of an antenna during the rotation of the stirrer. When the chamber is empty, the measurement of the power at the terminals of the antenna can be carried out simultaneously with the field measurements achieved with the field probe.
We then take advantage of the successive measurement sequences carried out for several positions of the probe, in order to also estimate the received mean power and the received maximum power in different positions of the receiving antenna. We then evaluate the loading factor L by carrying out the following calculation for the considered test frequency:
[5.9] 
In this expression, Prec_E represents the average power received by an antenna located in the working volume of the chamber, when the cavity is empty.Conversely, Prec_L represents this received power when the object is present. In the loaded configuration, it is important that the receiving antenna, still located in the working volume, is set at a distance from the device. Ptr _E and Ptr _L stand for the power actually available at the terminals of the transmitting antenna, which is used to produce the electromagnetic field in an empty enclosure and a loaded enclosure respectively.
Relation [5.9] is the quotient of the two ratios measured in an empty chamber and in a loaded chamber. The ratio evaluated in each case is the mean of the power received on an antenna during the stirrer rotation (measurements collected in N positions) brought back to the average power actually transmitted to the transmitting antenna. The approximation committed on the right of expression [5.9] corresponds to the invariance hypothesis of the power transmitted in the chamber by the transmitting antenna, whatever the load associated to the object under test. This hypothesis can seem trivial. However, it comes down to accepting that the average power transmitted by the transmitting antenna is not altered by the load of the equipment under test. This transmitted power can be directly measured with the help of a coupler set at the antenna input during the stirrer rotation.
The evolution of this mean coefficient in reality can be slightly affected by the modification of the field statistics, if the latter is too much altered by the presence of the load. In the reasonable hypothesis where we neglect this modification, the load factor L thus represents in a simpler way the ratio of the power received in empty state, to the power received in loaded state. L is higher than or equal to 1. The estimate of L becomes more accurate as the number of positions of the receiving antenna increases. For a sufficient number of positions, the uncertainty would be formulated by the Bienaymé–Chebychev inequality ([PAP 02] and expression [3.61] in section 3.3.3 of Chapter 3), with, as the underlying distribution, the ratio of the normal distributions corresponding to the estimate of the average powers in empty state and in load for N positions of the stirrer.
When L is close to the unit, we can estimate that the power to be generated in order to produce the desired field amplitude to carry out the test is identical to the power that we can directly deduce from the calibration process. This latter process gives a relation between the mean value of the maximum electric field amplitude in the chamber and the power injected at the output of the amplification chain used.
However, when L is significantly higher than one unit, it is necessary to again adjust the injected power level in order to obtain the prescribed level of electric field amplitude of the immunity test. The power injected for the test must thus be tuned so that:
[5.10] 
where Pcal corresponds to the power injected in the transmission chain towards the transmitting antenna, during calibration operations of the chamber at the considered frequency. The estimated value of the maximum of a field component 〈Er_max〉p is determined, this power being released during the calibration. Pinj corresponds to the power that we need to inject, in order to achieve a field distribution in the chamber such that the maximum amplitude of the electric field represents the required test level Er_test, taking into account the loading effect (L) of the equipment. We have here implicitly assumed that the power supply chain used to deliver the radiated field to the chamber remains identical to the one used for the calibration.
The next experiment shows the load effect brought by the installation of a few pedestrian absorbents, whose dimension is low compared to the volume of the chamber. This experiment is carried out here with a simple demonstration aim. We will be able to give a general idea of the experimental configuration from the corresponding picture in Figure 5.7.
Figure 5.7. Illustration of the loading effect of a reverberation chamber. Electromagnetic absorbing materials are placed on the floor of the reverberation chamber (their position is not a determining parameter of this experiment)

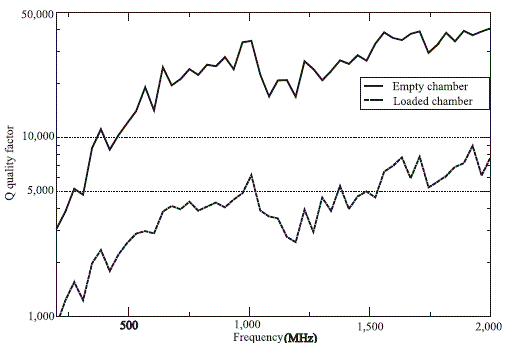
The curve in Figure 5.8. shows the existing contrast between the quality factor measured in an empty chamber and in a loaded chamber, within a frequency band located between 200 MHz and 2 GHz. The composite quality factors are evaluated under these two successive conditions on a stirrer rotation at each frequency. The ratio of these factors is directly homogeneous to the load factor L, which is evaluated in only one position of the receiving antenna. The received power is measured here with the help of the log-periodical antenna appearing in the Figure 5.7. and the transmission source is an identical antenna located outside the working volume. The drop of the quality factor is almost constant at least for frequencies over 500 MHz and corresponds to an L factor of about 5. In the lower part of the frequency band the composite quality factor is influenced by the antenna quality factor. Moreover, the cavity is not such a well-operated reverberation chamber for the lower frequencies and the performances of the absorbing material are not identical. The power balance is thus ostensibly deeply affected by the addition of a few absorbing material of a relatively moderate size. This situation can seem naturally extreme considering the usual nature of the devices under test, but such a load factor could be linked to the existence of several absorption zones, which are distributed in a voluminous object.
Figure 5.8. Effect of electromagnetic absorbing materials, placed on the floor of reverberation chamber A, on the measured composite quality factor
5.4.2. Incidence on the statistical uniformity of the field
The evaluation of the load factor L of the equipment is a necessity for the objects presenting significant losses by absorption, with reference to the other losses in the chamber associated with the finite conductivity of the walls and notably to the antennas. In this case, the modification of the supplied power level is compensation for this effect. It is however necessary to define the limits of thisapproach.
Indeed, the losses generated by the device under test can have an incidence on the statistical uniformity of the field. Thus, the S( f ) deviation, as it was introduced in section 5.2 of this chapter, can be positively or negatively affected. We can indeed consider that if the load is not too significant in volume, it will not substantially modify the mode density. On the contrary, at the cost of a weakening of the energy which is stored at the working frequency, it will introduce a widening of the mode bandwidth, which is favorable to the excitation of new modes. The result of this is that the observed S( f ) deviation can be lower and is even more compatible with the desired Smax ( f ) limit. When the volume of the load is too high, we notice a deterioration of the uniformity level. This deterioration can be explained by the fact that beyond a certain volume, some propagation modes may no longer be established or may be strongly altered. The quality factor of some of these modes may even be too low to significantly contribute to the global distribution of the electromagnetic field.
In practice, a rotation of the stirrer could not enable us to generate sufficient non-correlated field distributions. Beyond the maximum Smax ( f ) limit that can possibly be respected, we also ought to take a look at the possible consequences connected to the field distribution, which can significantly move away from Rayleigh’s distribution.
Finally, we ought to complete the calibration process of a reverberation chamber by estimating the maximum acceptable load, as a function of the frequency, enabling us to respect the fixed uniformity limit. Beyond this fact, statistical tests, which are not required by the standard documents, also give a more specific idea of the modifications induced relative to the obtained field statistics.
In the configuration visible in Figure 5.7 and despite the very significant influence of the presence of the electromagnetic absorbing materials on the composite quality factor which is observed in Figure 5.8. the deviation curves S( f ) remain quite similar to those in Figures 5.4, 5.5 and 5.6.
5.4.3. Observation of possible malfunctioning of the device under test
The test procedure essentially consists of observing the operational behavior of the device under test submitted to a field distribution, generated at the required test level, and this for the different positions of the stirrer. The principle chosen by the standardization commissions is to notice the unsuccessful test, as soon as the operation of the device under test is altered. This failure is noticed in various ways according to the imposed specifications. Alterations may consist of the device working in deteriorated mode or presenting a temporary or definitive malfunctioning.
Concretely, for each test frequency, the stirrer is placed in N successive positions. In each of these positions, the stirrer is stopped during a time interval T. We estimate that this interval must be sufficient to take into account the operational time constants of the system under test.
The immunity of the system at the considered frequency and at the level of the applied test is presumed, if no fault has been noticed for all of the stirrer positions.However, as soon as the first failure is noticed, the test is declared unsuccessful, the system is reset if necessary and the test carries on at the next test frequency.
We simply specify that, looking at the optimization of the test time, it is more relevant to carry out the tests on the entire frequency band for only one stirrer position, in order to avoid the numerous rotations of the stirrer.
The stochastic nature of the field thus does not lead to a statistical analysis of the failure rate of the device. This would be a possible extension of the use of reverberation chambers [MAR 07]. This is indeed difficult to plan in the framework of a standardization process, for which the test time must be optimized. However,the statistics of the defaults in the frame of the evaluation of the robustness of the studied function could turn out to be an interesting analysis tool.
5.4.4. An example of immunity tests
As an example, we will present the result of an immunity test, for which the procedure described in the 61000-4-21 standard has been followed. The example studied is a rain sensor on the windshield of a car leading to the automatic activation of the windshield wipers, as soon as the presence of water drops is detected. The obtained results are broad casted here with the kind authorization of the PSA-Peugeot–Citroën Automobile Company. These tests have also been carried out in the framework of a campaign of multi-site measurements within the collaborative workgroup PICAROS, which allows us to reproduce these results. The optical probe used as a rain sensor detects a light beam transmitted by a photodiode. This light ray is initially guided within the windshield. The presence of water drops is then detected by the optical probe, since it alters the propagation conditions of the light beam. An optoelectronic component then helps for the transmission of a signal of electronic control towards the windshield wiper motors. The integrity of this electric signal must naturally be ensured in the presence of an external electromagnetic field.
Figure 5.9. gives an idea of its shape and arrangement on one part of the windshield. We distinguish in particular the connecting cable between the probe and the electronic equipment of the vehicle.
Figure 5.9. Car rain sensor placed for a radiated immunity test in reverberation chambers

The rain sensor is installed in a previously calibrated reverberation chamber.This means that, in addition to the field statistical uniformity checked in the frequency band of the test, the power calibration leads to the generation of the desired test level of the electric field. The test level, in this reverberation chamber context, is represented by the mean value of the maximum (on the eight calibration points) of any rectangular component of the electric field. The test level is set at100 V/m for the whole frequency band, i.e. from 200 MHz to 1 GHz. The test then occurs as follows. With the stirrer in a fixed position, the generator synthesizes the first test frequency during the exposition time set at one second. If no malfunctioning is observed, we modify the position of the stirrer up to a new fixed position. The nature of the possible failure is for this device a disturbance signal,whose direct consequence is the unexpected start of the windshield wipers.
During the rotation of the stirrer, the power supply is turned off so that the device under test is not submitted to any electromagnetic field. We thus carry out the test until the last rotation, enabling us to reach the last position of the stirrer. There are 50 positions in total. If, during a complete rotation, no malfunctioning is noticed,we can conclude that, at this frequency, the susceptibility threshold of the rain probe is at least higher than an electric field, whose rectangular component is 100 V/m in the context of the considered standard.
On the contrary, as soon as a failure is noticed, we then need to seek the susceptibility threshold. This then consists of repeating the test; first by a low level test corresponding to a fraction of the initial test level. We progressively increase this test level in stages. The susceptibility level then corresponds to the maximum level, for which no malfunction has been observed on the whole set of stirrer positions. The method is then repeated for all of the test frequencies. The frequency step is itself fixed by the standard.
In reality, as mentioned above, we can carry out a measurement on all of the frequencies before the modification of the stirrer position.
The test configuration plans that the rain sensor is arranged in the working volume. To this effect, a supporting table or object for the device under test is necessary. Its effect on the surrounding field distribution must as limited as possible.
The result of the immunity test of the rain sensor is first observed in several reverberation chambers, which differ within the PICAROS group. As an example,we show inFigure 5.10. the shape of the susceptibility curve obtained in two different chambers for testing the same device.
Figure 5.10. Susceptibility levels measured for the same rain sensor tested in two reverberation chambers, for which the same calibration and test protocol is applied. The circles represent the frequencies for which the test is carried out

These curves both show that the device is sensitive to the interference in some frequency bands. The fact that points of these curves reach the level of 100 V/m is not significant of a susceptibility level, but rather represents a minimum threshold of susceptibility. Further tests at higher field levels would have been required to estimate the susceptibility level at those frequencies. However, any point of one of the two curves for which the level is lower than 100 V/m, attests to the observation of susceptibility for a higher level than the field level read on the vertical axis.
We observe, for example, susceptibility for electric field levels (i.e. of the maximum of one of its rectangular components) of about 25 to 50 V/m in the750 MHz to 1,250 MHz frequency band. The observation of these two curves leads to two comments.
On the one hand, the observed tendencies are common. On the other hand, if we describe the susceptibility threshold frequency by frequency, there are large differences between the two curves and fluctuations within neighboring frequencies.Considering the previous account, this result is not surprising. The common trends of the two curves is the sign of a satisfactory level of field uniformity. Differences between the two experiments are related to this uniformity level, whose order of magnitude has been observed with the help of the Smax ( f ) fluctuation, which is described in section 5.2.1.2 of this chapter. Let us note that this order of magnitude was provided by the previously accepted limits for the older standards associated with the use of the anechoic chambers.
Another interesting experiment consists of carrying out the evaluation of the same device; this time in different locations of the latter in the test enclosure. The objective is therefore to empirically check that the positioning of the device under test has a minor incidence on the susceptibility result obtained. The analysis is restricted here to the 750-1,000 MHz frequency band, for which its susceptibility is mainly observed. The curves in Figure 5.11. show the result of the susceptibility test for three different locations of the device. These positions are arbitrarily chosen in the working volume.
The general assessment is not very different from the previous assessment concerning the test in several reverberation chambers. These three curves confirm the previously observed result concerning the general behavior observed on the falling susceptibility level of the device in this particular frequency range. The observed fluctuations from one result to the other in the same chamber are probably of the same order of magnitude as the ones observed from one chamber to another.This could be confirmed by a study of the statistics operated on the location of the device under test, but would naturally require a long session of tests.
Figure 5.11. Susceptibility levels measured for the same rain sensor tested in three different positions. The symbols represent the frequencies for which the test is carried out

This section was about very simply illustrating the nature of the test results in reverberation chambers. This has naturally brought us to mention the susceptibility threshold notion for an electromagnetic immunity test and to illustrate the mode of use of a reverberation chamber. It seems however important to discuss the nature of the test in reverberation chambers in relation to the more traditional test carried out in an anechoic chamber.
5.5. Immunity test in reverberation and anechoic chambers
The radiated immunity test in reverberation chambers drastically modifies the view of this EMC test, with reference to the classic use of the illumination test in an anechoic chamber.
Any attempt to carry out a rigorous link of these two approaches is outside the scope of this book. However, it is necessary to evaluate their respective operating modes together with the significance of the test levels practiced in these two confined areas.
Our objective is not to establish the relative evaluation of these two alternative test facilities, but to quantify the risk of failure of electronic equipment when it is subjected to an external disturbance. We highlight however what distinguishes these test facilities which confine fields in different ways. The comparison between the two test methods enables us to establish a certain correlation between the test levels practiced in one and then in the other. This task is rather difficult since any comparison in terms of susceptibility level may not be carried out independently from the electromagnetic features of device of the test. This is still nowadays a subject of research.
5.5.1. The conventional approach of illumination in an anechoic chamber
The test in an anechoic chamber plans to illuminate the working volume with the help of an antenna with linear polarization. This antenna generates a polarized electric field either vertically or horizontally in a zone of the chamber where the device under test will be placed later on. In principle, this zone is located in the far-field of the transmitting antenna or, failing this, in a radiated close field zone(Fresnel region). The field in this zone is relatively uniform, i.e. it respects a uniformity criterion, i.e. the fluctuation of the field must lie below some limit. The electric field is calibrated so that it is at least equal to the reference field in the uniformity zone (in the absence of a device). To check this uniformity criterion, the electric field level according to the selected polarization is measured in different places of the assumed uniform zone. A field probe is also required to perform these measurements. The reference field is then equivalent to the minimum value within the set of measurements. The power transmitted to the transmitting antenna will also be adjusted for testing so that the reference field is made equal to the electric field value of the radiated immunity test.
We can consider, in a first approximation, that the incoming electric field vector is generated according to a horizontal or vertical field polarization, depending on the transmitting antenna configurations. Figure 5.12. draws a diagram of this matter. In particular, the transmitting antenna is related to a log-periodical type antenna, which is placed in this case in a vertical polarization. The field in the uniformity zone,called the homogeneous zone, keeps the same polarization. The action of the electromagnetic absorbing materials strongly contributes to this result. However, the homogeneity performance precisely depends on their own performance (partial absorption), as well as on radiation properties (radiation pattern) of the transmittingantenna.
If we admit the hypothesis of the plane wave propagation (Fraunhofer region,also called the far-field zone), we can estimate that the field in the uniform zone is given by:
[5.11] ![]()
In this expression, Pt is the power effectively transmitted to the transmitting antenna; G(θ,φ) is the gain of the transmitting antenna, as a function of the elevation angle θ and the azimuth angle φ; d is the horizontal distance between the uniform zone located in the y = d plane and the transmitting antenna; and n0 is the impedance of the electromagnetic wave propagating in a vacuum. In expression [5.11] Er is defined as the rms amplitude of the electric field.
Ideally, far enough from the transmitting antenna, at the cost of a more important amplification of the signals, the Er field is expressed in an even more simplified way by:
[5.12] 
Figure 5.12. Synthetic diagram of the radiated immunity test in an anechoic chamber
After calibration and calculation of the power to be injected in order to reproduce the desired test level for the field amplitude Er , the device under test is placed in the working zone of the chamber. The coupling between the field thus radiated and the device under test naturally depends on the characteristics of the device, i.e. on its own effective area of the device, seen as a receiving antenna. This effective area is related to the radiation pattern of this device, seen reciprocally as a transmitting antenna (see Chapter 6). The 360° rotation of the device under test in azimuth is the most frequently practiced rotation.
5.5.2. Illumination in a reverberation chamber
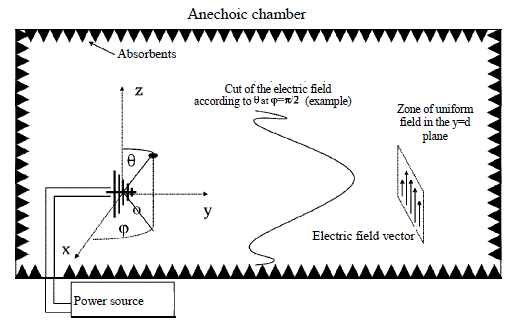
The test in a reverberation chamber follows the same process that was previously described in an anechoic chamber. The calibration of the chamber is also carried out in the absence of the device under test, as we described in section 5.2. Then, in the same way, the device is inserted into the chamber to be subjected to the test at the stipulated level. Figure 5.13. illustrates with a diagram the configuration of the test corresponding to the calibration phase. The transmitting antenna is placed so that the main radiation pattern of the antenna is not directed towards the zone designed for the creation of the statistically uniform field. Thus, we minimize the occurrence of anon-stirred field component, whose origin would be a direct illumination in line of sight of the transmitting antenna. The distance between the uniform zone and the transmitting antenna is not a dimensioning factor, unlike direct illumination in an anechoic chamber.
Figure 5.13. Process diagram of the radiated immunity test in reverberation chambers

When the device stands in the room, a major difference occurs. This is the possible required adjustment of the test level, due to the loading factor of the device under test, as described in section 5.5.1
This adjustment takes into account the fact that there is a much stronger coupling between the device under test and the reverberation room. However, in an anechoic chamber, the coupling of the device under test with the room remains very weak.The device under test may of course disturb the wavefront of the incoming wave according to the location and the size of the device under test, but with limited coupling effects with walls and the transmitting antenna.
On the contrary, in the reverberation chamber the coupling between the object under test and the walls of the room is very strong and can dramatically change the field distribution in the entire chamber volume. It is especially true when the device is large and composed of metal (such a mechanical stirrer built that way on purpose). However, when the effect of the device losses may be neglected, the random behavior of the data collected during the rotation of the stirrer remains stationary. For increasing losses of the device under test, the quality factor of the room is falling. This then leads to a significant decrease in the stored energy. As already mentioned, the energy stored in the chamber and correlatively the electric field level represent the strictness criterion of the test. This suggests compensating this loading factor with the corresponding increase of the power emission in thecavity.
Let us note that this mainly empirical approach is questionable. The losses are globally due to two factors. The first is the losses in the electric or electronic circuits. This is mainly the result of the coupling between the electromagnetic wave and the electronic circuits which are the main objects in the study of electromagnetic compatibility. We precisely wish to observe these effects and the motivation to compensate such circuit losses is not clear at all. The second factor consists of all the losses in the different materials that constitute the device, with minor impact on the electromagnetic compatibility of the latter. A dielectric lossy structure could, for example, play this role. In that case, the losses in the reverberation chamber may be effectively considered as an artifact and this legitimizes its compensation.
Finally, the field applied to the device under test is a sample of N measurements carried out at any point of the working zone of the chamber. In accordance with the ergodic hypothesis, the observation at this point is assumed to be similar to any other sample of measurements carried out on a set of points of the working zone. Were call that the working zone is very vast in reverberation chambers, since it includes any point of space located at a minimum distance in the order of λ/4 from any objector wall. Also by hypothesis, the field is isotropic, in a statistical sense, i.e. the statistics remain (at least approximately) identical according to its three components. As a consequence, these three rectangular components of the field Ex/ y/z (thus noted to differentiate from the Er component mainly generated in anechoic chamber, introduced in section 5.6.1) have the same probability density function.For an ideal reverberation chamber (see section 3.2 of Chapter 3 for the description of the model of ideal random field in a reverberation chamber), the statistical behavior tends towards Rayleigh’s distribution. Consequently, the fR probability density of Ex/ y/z is given by:
[5.13] 
where θ is the parameter of Rayleigh’s distribution. θ is connected to the square root of the mean of the total electric field in the chamber, so that:
[5.14] 
Readers can refer to Chapter 3 of this book for a more detailed description of the statistical distribution of an electric field component. Here E0 is comparable to the amplitude Ew of the plane waves the interference of which, constitutes the ideal random field distribution. The test in a reverberation chamber consists, moreover, of adjusting the input power (thus E02), so that the mean value of the maximum of distribution [5.13] reaches the value of the test level.
However, this mean value is only estimated with the help of the calibration process described in section 5.2.1.1 (expression [5.4]). This is thus with the uncertainty connected to the total number of selected positions of the stirrer (see Figure 5.1) from which we generate the test field 〈Er_max〉P.
Let us assume that the test level is given by the amplitude of the field level according to one of its components, noted Er_test. In an anechoic chamber, this field corresponds to the minimum field level in the uniformity zone (see section 5.5.1). Ina reverberation chamber, this level is similar to the estimate of the field maximum according to the three field components.
Finally, the incident field distribution on the device under test in a reverberation chamber has a stochastic behavior in time (rotation of the stirrer) and space, so that the upper extreme of the distribution of the different field components corresponds to the minimum field generated in an anechoic chamber according to only one rectangular component.
This random and statistically balanced distribution, according to the three components, is at the origin of the very low influence of the directivity of the device under test in a reverberation chamber. Its location or direction in the chamber is thus relatively unimportant.
We could deduce that the detection probability of a failure is stronger in a reverberation chamber since the solicitation of the device under test is global,whereas the test in an anechoic chamber does not cover all of the possible angles and polarizations of the incident wave.
It is however necessary to modulate this statement for devices with a strong directivity [MUS 03].These are devices whose dimensions reach or overcome the working wavelength. Illuminated by an almost plane wave in an anechoic chamber,they can have a maximum susceptibility. For this, it is sufficient that the incidence angle and the polarization of the illumination correspond to the direction and the polarization of the maximum directivity of the tested devices. We may note,however, that current test procedures do not provide any method to carefully match the incidence and polarization angles of the incident wavefront, especially for highly directive devices.
The device under test in a reverberation chamber is subjected to the stirring of a plane wave spectrum. The annihilation of the directivity characteristic of the device makes it less possible to obtain a level of identical coupling. This question is in fact complex and its development is not within the frame of the objective of this book.This matter is moreover not completely solved, because formalization of the tests practiced in reverberation chambers and in anechoic chambers is a difficult task.
5.6. Rectangular components of the electric field and the total electric field
The test level in a reverberation chamber can be established in several ways,because of the stochastic nature of the field. Up until now, we have only presented one option that consists of comparing the empirical mean value of the maximum of any projections (or rectangular components) component of the field to the test level.This option corresponds to the description of the CEI-61000-4-21 standard. On the contrary, the DO 160 standard section 20.6 takes as a reference test level, the estimation of the mean value of the maximum total field in the reverberation enclosure.
However, the relationship between the maximum of the total field and the maximum of one its rectangular component is not quite that trivial. Indeed, the modulus of the total field at any point of the chamber is such that:
[5.15] ![]()
Thus, for any stirrer position, the total field and its components evolve randomly.We recall that the Ex, Ey and Ez components behave as independent and identically distributed random variables and follow a Rayleigh process for an ideal reverberation chamber. This Rayleigh distribution is the direct consequence of the fact that the real and imaginary components of these field components are independent and both follow a normal distribution. The total field random variable is thus an additional contribution of six processes, which are independently established according to the normal distribution. The moment of the maximum total field is thus not the cube root of the moment of the maximum of one of these components.
We established in Figure 5.1 the probability density function of the maximum of a field component, normalized to the mean, with the help of the distribution function for N independent trials, starting from the hypothesis of a Rayleigh process.
A perfectly similar approach can be used for the maximum total field in the hypothesis of a process that is χ2 with six degrees of freedom (Appendix 3 gives some details about this distribution).
We can directly deduce the expectation of the total field maximum normalized to the maximum of a rectangular field component as a function of the number of stirrer positions. The layout of this ratio as a function of the number N of realizations is visible in Figure 5.14. This ratio tends to decrease with the increase in the number N of realizations. We already observed that the distribution of the maximum of a field component was moving towards higher amplitudes as a function of N (see Figure5.1).
Although normalized to the mean of this rectangular component, the curve in Figure 5.1 is thus interpreted by virtue of the central limit theorem. This trend is stronger than the one associated with the maximum amplitude of the total field. The ratio of the mean value of the maximum total field maximum to the mean value of the maximum of a field component is much lower than ![]() . This simply shows that the expectation of the maximum total field does not correspond to the simultaneity of the maximums of the rectangular components of the field. Observation of the structure and frequencies of the eigenmodes in a rectangular cavity described in section 2.3.2 of Chapter 2 also gives an explanation of such a result.
. This simply shows that the expectation of the maximum total field does not correspond to the simultaneity of the maximums of the rectangular components of the field. Observation of the structure and frequencies of the eigenmodes in a rectangular cavity described in section 2.3.2 of Chapter 2 also gives an explanation of such a result.
The underlying statistical hypothesis may also provide some explanation. For a quite high number of independent realizations (or stirrer positions), we tend to increase the probability of a maximum projection of the field according to an arbitrarily chosen component. The total field is obtained according to the combination formed by two orthogonal components associated with the first arbitrary component. Taking into account the distribution of a component according to Rayleigh’s distribution, and since these components are considered as statistically independent, the probability is low, that these two new components are as extremely high as the first component.
Figure 5.14. Evolution of the moment of the maximum amplitude of the total electric field brought back to the moment of the maximum amplitude of any component of the same field.This evolution is given as a function of log2(N), where N is the total number of stirrer positions considered to be independent. This evaluation relies on the hypothesis of an ideal random field

5.7. Discussion
5.7.1. The limits of statistical uniformity from one standard to another
The tolerance limits of statistical uniformity can be different from one standard to another or from one version of a standard to another. There is no definitive and indisputable criterion on the matter. The tolerance on this uniformity is thus more or less high. We need, however, to state that the 3 dB standard deviation is very commonly used for the frequency spectrum, for which the electromagnetic cavity appears as very large compared to the working wavelength. This choice is mainly dictated by the reproducibility level usually admitted in EMC. In lower frequency,the tolerated fluctuation can be higher. This is naturally a clue about the operation of the reverberation chamber in deteriorated mode. The risk is thus naturally in this case to content ourselves with a lesser reproducibility quality of the tests. The evaluation of this risk requires, in principle, an in-depth study of the behavior of the chamber in the context of a slightly oversized chamber. The objective of this study can be, on the one hand, to analyze the possible modification of the observed statistics, and on the other hand, the real number of stirrer positions for which the spatial distribution of the field differs. In Chapter 8 we will come back to the possible experimental approaches, in order to detail this matter.
5.7.2. The choice of the number of stirrer positions from one standard to another
Even more so than the uniformity tolerances, the number of stirrer positions recommended by the standards is also significantly different. This number can moreover be different in the calibration phase and in test phase. We will favor a higher number of stirrer positions in the calibration phase. However, we need to note that in terms of reproducibility, loosening the constraint of the number of stirrer positions tends to reduce the global reproducibility performance, i.e. to increase the uncertainties of the measurements. A small number of stirrer positions in a calibration phase can result in a vague estimate of the relation existing between the power injected in the chamber and the mean of the maximum generated field. We have seen in particular that this evaluation strongly depends on the N number of observations. This reveals the advantage of a sufficient number of observations in calibration phase, all the more since this calibration is only carried out periodically.On the contrary, during the test phase, we seek to decrease the number of observations, in order to optimize the measurement time. This can only be done at the cost of a higher measurement uncertainty.
5.7.3. The nature of immunity tests in reverberation chambers
We have tackled the nature of radiated immunity tests in reverberation chambers,and we have analyzed the electromagnetic field coupling to the device under test in comparison with radiated immunity tests in an anechoic chamber. This is evidently avast question, for which some aspects are directly discussed in various recent research works. These two means both establish a presumption of conformity of a device under test. The objective is to minimize, or even to negate the risk of device failure in real operation conditions. In other words, the question is in reality to know what type of test, in reverberation chambers or in anechoic chambers, is able to bring an acceptable answer to this question. This naturally overcomes the context of the choice of the type of test that will enable us to obtain the sough after result.
It is, however, not forbidden to move closer to the propagation of a wavefront established in an anechoic chamber for some situations of illumination by a source located in far-field in open space. On the contrary, the standing wave distribution in a reverberation chamber is more adapted to a situation of illumination by a source located in a confined environment at least partially shielded. It is probable that these connections are limited and of a qualitative order for a good number of common situations. We should thus probably count on an appropriate analysis of these environments, in order to extract optimal information relative to the analysis of the risk of failure.
5.8. Bibliography
[ARN 02] ARNAUT L.K., “Compound exponential distributions for under-moded reverberation chambers”, IEEE Transactions on Electromagnetic Compatibility, vol. 44,no. 3, p. 442–457, August 2002.
[HIL 94] HILL D.A., MA M.T., ONDREJKA A.R., RIDDLE B.F., CRAWFORD M.L., JOHNK R.T.,“Aperture excitation of electrically large Lossy cavities”, IEEE Transactions on Electromagnetic Compatibility, vol. 36, no. 3, p. 169–178, August 1994.
[HIL 98] HILL D.A., “Plane wave integral representation for fields in reverberation chamber”,IEEE Transactions on Electromagnetic Compatibility, vol. 40, no. 3, p. 209–217, August 1998.
[HIL 02] HILL D.A., LADBURY J.M., “Spatial-correlation functions of field and energy density in a reverberation chamber”, IEEE Transactions on Electromagnetic Compatibility,vol. 44, no. 1, p. 95–101, February 2002.
[HOI 06] HOIJER M., “Maximum power available to stress onto the critical component in the equipment under test when performing a radiated susceptibility test in the reverberation chamber”, IEEE Transactions on Electromagnetic Compatibility, vol. 48, no. 2, p. 372–384, May 2006.
[HOI 08] HOIJER M., “On maximum power available to stress onto the critical component in the equipment under test when performing a radiated susceptibility test in the reverberation chamber”, IEEE Transactions on Electromagnetic Compatibility, vol. 50,no. 4, p. 1020, November 2008.
[IEC 02] International Electrotechnical Commission, IEC 61000-4-3 Ed. 2.1.Electromagnetic Compatibility (EMC) – Part 4–3: Testing and Measurement Techniques –Radiated, Radio-frequency, Electromagnetic Field Immunity Test, 2002.
[IEC 03] International Electrotechnical Commission, IEC 61000-4-21 Ed. 1.0,Electromagnetic Compatibility (EMC) – Part 4–21: Testing and Measurement Techniques– Reverberation Chamber Test Methods, 2003.
[LEM 08] LEMOINE C., Contribution à l’analyse statistique des mesures en chambreréverbérante à brassage de modes. Applications à la détermination de l’efficacité debrassage et de l’incertitude de mesure dans un contexte CEM et radiofréquences, Thesis,INSA, Rennes, 2008.
[MAR 07] MARVIN A.C., KONEFAL T., DAWSON J.F., ROBINSON M.P., “The use of reverberation chambers in the quantitative assessment of the risk associated with installation of electronic systems on vehicles”, EMC Workshop Europe 2007, Paris, June2007.
[MIL 99] MIL-STD-461E, Department of Defence Interface Standard, Requirements for the Control of Electromagnetic Interference Characteristics of Subsystems and Equipment,Radiated Susceptibility 103, Alternative Test Procedures – Reverberation Chambers(Mode-tuned), 1999.
[MUS 03] MUSSO L., Assesment of reverberation chamber testing for automotive applications, Thesis, Politecnico di Torino, University of Lille, 2003.
[ORJ 06] ORJUBIN G., “Statistical model of an undermoded reverberation chamber”, IEEETransactions on Electromagnetic Compatibility, vol. 48, no. 1, p. 248–250, February 2006.
[PAP 02] PAPOULIS A., UNNIKRISHNA PILLAI S., Probability, Random Variables and Stochastic Processes, 4th edition, McGraw-Hill, New York, 2002.
[RTC 07] RTCA-DO-160, Radio Technical Commission for Aeronautics, Environmental Conditions and Test Procedures for Airborne Equipment, F version, 2007.
1 Comparison is not reason, but we can try to present an example. Rolling a perfect six-sided die two times gives a probability of 69.4% of not rolling a six. Rolling the same die twenty times gives a probability of 97.4% of rolling one. An experimented die player thus does not ever despair.