
Chapter 8: Understanding Plan Caching
In the previous chapter, we learned how the query optimization process produces an execution plan. In this chapter, we will focus on what happens to those plans. Understanding how the plan cache works is extremely important for the performance of your queries and SQL Server in general. Query optimization is a relatively expensive operation, so if plans can be cached and reused, this optimization cost can be avoided. Trying to minimize this cost saves on optimization time and server resources such as CPU. Plan caching also needs to be balanced with keeping the plan cache size to a minimum so that memory resources can be used by your queries.
However, there might be cases when reusing a plan is not appropriate and would instead create a performance problem, for example, with parameter-sensitive queries. This chapter will show you how to identify those performance problems and what the available solutions are. Although parameter sniffing is sometimes seen as something bad, it is, in fact, a performance optimization that allows SQL Server to optimize a query for the parameter values that were initially passed into a stored procedure. The fact that it does not work fine in all cases is what has given it somewhat of a bad reputation and is usually referred to as the parameter-sniffing problem.
Finally, this chapter will cover parameter-sensitive query optimization, which was introduced with SQL Server 2022 and is part of the intelligent query processing family of features. Parameter-sensitive query optimization intends to help with performance problems related to parameter-sensitive queries.
This chapter covers the following topics:
- Batch compilation and recompilation
- Exploring the plan cache
- Understanding parameterization
- Parameter sniffing
- Parameter sensitivity plan optimization
Batch compilation and recompilation
As mentioned in Chapter 1, An Introduction to Query Tuning and Optimization, every time a batch is submitted to SQL Server for execution, SQL Server checks the plan cache to see whether an execution plan for that batch already exists. Query optimization is a relatively expensive operation, so if a valid plan is available in the plan cache and can be used, the optimization process can be skipped and the associated cost, in terms of optimization time, CPU resources, and so on, can be avoided. If a plan is not found, the batch is compiled to generate an execution plan for all the queries in the stored procedure, trigger, or dynamic SQL batch.
The query optimizer begins by loading all the interesting statistics and also validating whether any of these statistics are outdated. Then, it updates any outdated statistics, except in cases where the AUTO_UPDATE_STATISTICS_ASYNC configuration option is used, in which case the query optimizer will use the existing statistics, even if they are out of date. In this case, the statistics are updated asynchronously, ready for the next query optimization that may require them. The query optimizer then proceeds with the optimization process, which was explained in detail in Chapter 3, The Query Optimizer.
If a plan is found in the plan cache or a new one is created, it can now be executed. Query execution technically begins at this point, as shown in the following diagram, but the plan is still validated for correctness-related reasons, which include schema changes. If the schema is not valid, the plan is discarded and the batch or individual query is compiled again. If the schema is valid, the query optimizer then checks for data statistics changes, looking for new applicable statistics or outdated statistics. If newer statistics are available, the plan is discarded and the batch or individual query is compiled again. Such compilations are known as recompilations. As you may have noticed, recompilations are performed for good reasons – both to ensure plan correctness and plan optimality (that is, to obtain potentially faster query execution plans). Recompilations may also need to be monitored to make sure they are not occurring too frequently and causing performance issues. The entire compilation and recompilation process is summarized in the following diagram:

Figure 8.1 – Compilation and recompilation process
You can look for excessive compiles and recompiles using the SQL Compilations/sec and SQL Re-Compilations/sec counters of the SQLServer:SQL Statistics object in Windows System Monitor. SQL Compilations/sec allows you to see the number of compilations per second. Because plans are cached and reused, after SQL Server user activity is stable, this value should reach a steady state. SQL Re-Compilations/sec allows you to see the number of recompiles per second. As shown earlier, recompilations are performed for good reasons, but generally, you want the number of recompiles to be low.
Once you know you have a high number of recompiles, you can use the SP:Recompile and SQL:StmtRecompile trace events or the sql_statement_recompile extended event to troubleshoot and get additional information. As an example, let’s look at the following exercise. Start a Profiler session on your test instance and select the following trace events (some of which were covered in Chapter 2, Troubleshooting Queries). These are located in the Stored Procedures event class and the TSQL event class:
- SP:Recompile
- SQL:StmtRecompile
- SP:Starting
- SP:StmtStarting
- SP:Completed
- SP:StmtCompleted
Run the following code to do so:
DBCC FREEPROCCACHE
GO
CREATE OR ALTER PROCEDURE test
AS
CREATE TABLE #table1 (name varchar(40))
SELECT * FROM #table1
GO
EXEC test
You should see the following sequence of events, which includes 3 – Deferred compile in the EventSubClass column in Profiler for both the SP:Recompile and SQL:StmtRecompile events:
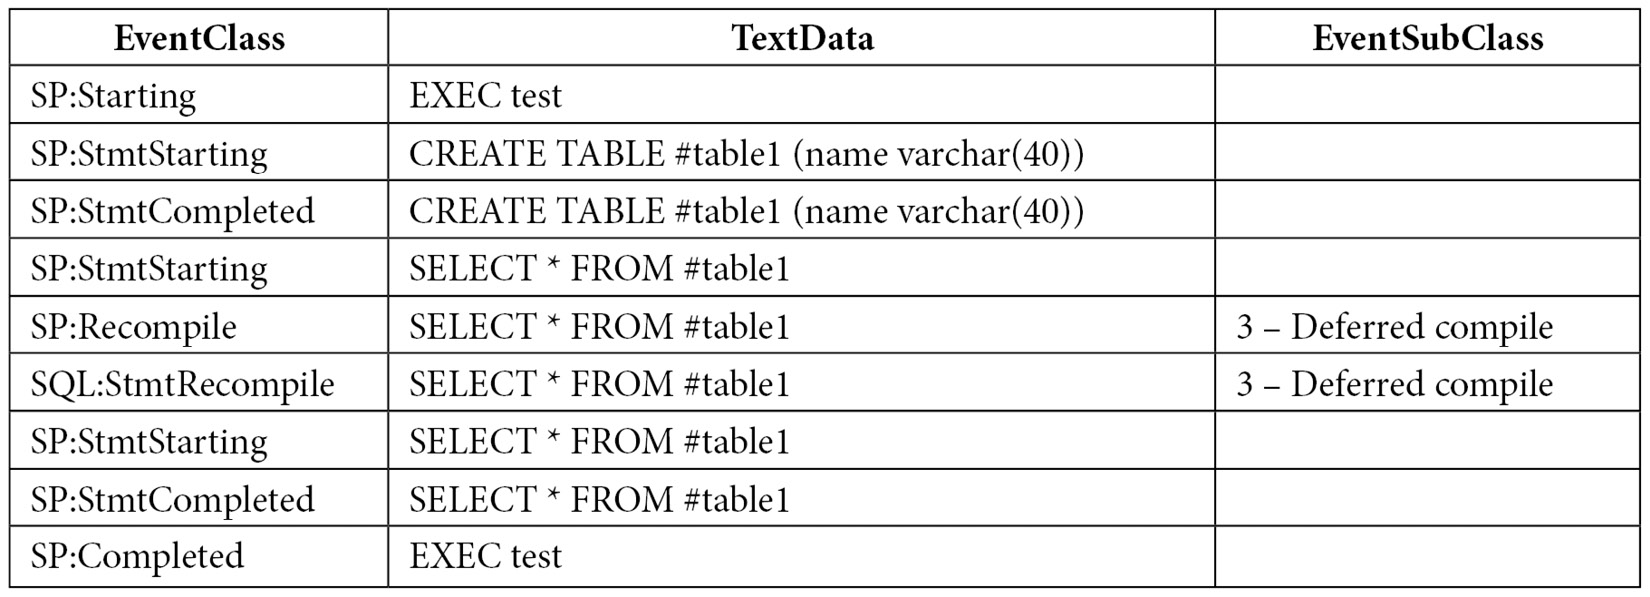
The captured events show a deferred compile caused by the SELECT statement as the reason for the recompiles. Remember that when a stored procedure is executed for the first time, it is also optimized, and an execution plan is created as a result. A plan can be created for the CREATE TABLE statement inside the stored procedure. However, the SELECT statement cannot be optimized at this moment because it references the #table1 table, which does not exist yet. Remember that this is still the optimization process, and to create the #table1 object, the resulting plan should be executed first. Only after the #table1 table is created during the execution of the stored procedure will SQL Server finally be able to optimize the SELECT statement, but this time, it will show as a recompile.
Deferred compile is one of the possible values for EventSubClass. You can find the other documented values by running the following query:
SELECT map_key, map_value FROM sys.dm_xe_map_values
WHERE name = 'statement_recompile_cause'
Running the previous query shows the following output:

Now that you know the methods for performing batch compilation and recompilation, let’s learn how to use queries to explore the plan cache.
Exploring the plan cache
As you saw in Chapter 2, Troubleshooting Queries, you can use the sys.dm_exec_query_stats DMV to return aggregate performance statistics for cached query plans in SQL Server, where each entry represents a query statement within the cached plan. You saw examples of how to find the most expensive queries using different criteria such as CPU, logical reads, physical reads, logical writes, CLR time, and elapsed time. We also indicated that to get the same information in the past, you would have to capture a usually expensive server trace and analyze the collected data using third-party tools or your own created methods, which was a very time-consuming process. However, although the information of the sys.dm_exec_query_stats DMV is available automatically without any required configuration, it also has a few limitations – mainly that not every query gets cached or that a cached plan can be removed at any time. Despite these limitations, using this DMV is still a huge improvement over running server traces manually.
Note
Starting with SQL Server 2016, you can use the query store to capture performance and plan information about all the queries running in your databases. The query store is now, by far, the recommended method to get query performance information.
In addition, as covered in Chapter 5, Working with Indexes, the Database Engine Tuning Advisor (DTA) can use the information on this DMV when you specify the plan cache as a workload to tune, which uses the most expensive queries based on the query’s elapsed time. This means that you don’t even have to search for the most expensive queries and input them on the DTA – everything is available directly with only a few mouse clicks.
Regardless of the method you are using to capture the most expensive queries in your system, you should always take into account cases where a query alone may not use many resources (for example, CPU cycles), but the cumulative cost could be very high because it is so frequently executed.
Another DMV that’s useful for looking at the plan cache is sys.dm_exec_cached_plans, which returns a row for each query plan that is cached by SQL Server. We will use this DMV to explore the plan cache in the remaining sections of this chapter, where we will focus mostly on the following three columns:
- usecounts: The number of times the cache object has been looked up
- cacheobjtype: The type of object in the plan cache, which can be one of the following:
- Compiled Plan.
- Compiled Plan Stub.
- Parse Tree: As mentioned in Chapter 3, The Query Optimizer, a query processor component called the algebrizer produces a tree that represents the logical structure of a query. This structure is called an algebrizer tree, although it may sometimes be referred to as a parse tree or a normalized tree, and is later handed off to the query optimizer, which uses it to produce an execution plan. Because the produced execution plan is cached, there is no need to cache these algebrizer trees – the only exception being the trees for views, defaults, and constraints – because they can be referenced by many different queries.
- Extended Proc: Cached objects that track metadata for an extended stored procedure.
- CLR Compiled Func.
- CLR Compiled Proc.
- Objtype: The type of object, which can be one of the following:
- Proc (stored procedure)
- Prepared (prepared statement)
- Adhoc (ad hoc query)
- ReplProc (replication-filter procedure)
- Trigger
- View
- Default
- UsrTab (user table)
- SysTab (system table)
- Check (check constraint)
- Rule
You can use the sys.dm_os_memory_cache_counters DMV to provide runtime information about the number of entries in the plan cache, along with the amount of memory allocated and in use. The following query provides a quick summary of what you can see in detail on the sys.dm_exec_cached_plans DMV:
SELECT * FROM sys.dm_os_memory_cache_counters
WHERE type IN ('CACHESTORE_OBJCP', 'CACHESTORE_SQLCP', 'CACHESTORE_PHDR','CACHESTORE_XPROC')
Notice that we are filtering the query to the following four cache stores:
- CACHESTORE_OBJCP: Used for stored procedures, functions, and triggers
- CACHESTORE_SQLCP: Used for ad hoc and prepared queries
- CACHESTORE_PHDR: Used for algebrizer trees of views, defaults, and constraints
- CACHESTORE_XPROC: Used for extended procedures
Finally, although not directly related to the plan cache, introduced with the SQL Server 2014 release (and only on the Enterprise edition), SQL Server allows you to use nonvolatile storage, usually solid-state drives (SSDs), as an extension to the memory subsystem rather than the disk subsystem. This feature is known as the buffer pool extension and is configured using the new BUFFER POOL EXTENSION clause of the ALTER SERVER CONFIGURATION statement. In addition, you can use the is_in_bpool_extension column of the sys.dm_os_buffer_descriptors DMV to return information about all the data pages currently in the SQL Server buffer pool that are also being used by the buffer pool extension feature. For more details about this new feature, refer to the SQL Server documentation.
How to remove plans from memory
So far in this book, we have made extensive use of the DBCC FREEPROCCACHE statement because it makes it very easy to clean the entire plan cache for testing purposes, and by this point, you should be aware that you need to be extremely careful about not using it in a production environment. Along with this, some other statements can allow you to be more selective when cleaning the plan cache, which is an instance-wide resource. You may clean the plans for a specific database, a resource governor pool, or even an individual plan. Here is a summary of these statements:
DBCC FREEPROCCACHE [ ( { plan_handle | sql_handle | pool_name } ) ]The following statement can be used to remove all the cache entries from the plan cache, a specific plan by specifying a plan handle or SQL handle, or all the plans associated with a specified resource pool:
DBCC FREESYSTEMCACHE ( 'ALL' [, pool_name ] )
The following statement releases all unused cache entries from all caches, in addition to the plan cache. ALL can be used to specify all supported caches, while pool_name can be used to specify a resource governor pool cache:
DBCC FLUSHPROCINDB( db_id )
This statement can be used to remove all the cache entries for a specific database.
In addition, you need to be aware that many other statements that you run in a SQL Server instance can remove the plans for the entire instance or a specific database. For example, detaching or restoring a database or changing some SQL Server configuration options can remove all the plans for the entire cache. Some ALTER DATABASE choices may remove all the plans for a specific database. For an entire list, please refer to the SQL Server documentation.
Finally, you can also remove all the plans for a specific database. You can either use DBCC FLUSHPROCINDB or, new with SQL Server 2016, ALTER DATABASE SCOPED CONFIGURATION CLEAR PROCEDURE_CACHE. DBCC FLUSHPROCINDB requires the database ID.
Understanding parameterization
We briefly introduced autoparameterization in Chapter 2, Troubleshooting Queries, while covering the query_hash and plan_hash values. To understand how SQL Server caches a plan, along with the different mechanisms by which a plan can be reused, you need to understand parameterization in more detail. Parameterization allows an execution plan to be reused by automatically replacing literal values in statements with parameters. Let’s examine those queries again, but this time using the sys.dm_exec_cached_plans DMV, which you can use to return each query plan currently cached by SQL Server. One particular column, usecounts, will be useful because it returns the number of times a specific cache object has been looked up in the plan cache, basically indicating the number of times the plan has been reused. The cacheobjtype and objtype columns, which were introduced in the previous section, will be used as well.
Let’s look at the following query:
DBCC FREEPROCCACHE
GO
SELECT * FROM Person.Address
WHERE StateProvinceID = 79
GO
SELECT * FROM Person.Address
WHERE StateProvinceID = 59
GO
SELECT * FROM sys.dm_exec_cached_plans
CROSS APPLY sys.dm_exec_sql_text(plan_handle)
WHERE text like '%Person%'
We get the following output, abbreviated to fit the page. You can ignore the first two result sets showing the data from the Person.Address table and the query using sys.dm_exec_cached_plans itself, which appears in the third result set:

In this case, we can see that each sentence or batch was compiled into an execution plan, even when they only differ on the value for StateProvinceID. SQL Server is, by default, very conservative about deciding when to autoparameterize a query, so in this case, no plan was reused because it is not safe to do so ("not safe" meaning that by doing so, there is the potential for performance degradation). If you take a look at the plan (for example, by using the sys.dm_exec_query_plan DMF, which was introduced in Chapter 1, An Introduction to Query Tuning and Optimization) and the plan_handle column of sys.dm_exec_cached_plans, as shown in the following query, you will see that they are different execution plans – one uses an Index Seek/Key Lookup combination and the second one uses Clustered Index Scan. The query will return the query text, along with a link that you can click to show the graphical plan:
SELECT text, query_plan FROM sys.dm_exec_cached_plans
CROSS APPLY sys.dm_exec_sql_text(plan_handle)
CROSS APPLY sys.dm_exec_query_plan(plan_handle)
WHERE text like '%Person%'
As mentioned in Chapter 2, Troubleshooting Queries, because a filter with an equality comparison on StateProvinceID could return zero, one, or more rows, it is not considered safe for SQL Server to autoparameterize the query. That is, if the query optimizer decides that, for different parameters, different execution plans may be produced, then it is not safe to parameterize.
Autoparameterization
However, let’s say we use the second version of the queries, as shown in the following code:
DBCC FREEPROCCACHE
GO
SELECT * FROM Person.Address
WHERE AddressID = 12
GO
SELECT * FROM Person.Address
WHERE AddressID = 37
GO
SELECT * FROM sys.dm_exec_cached_plans
CROSS APPLY sys.dm_exec_sql_text(plan_handle)
WHERE text like '%Person%'
We get the following output, again abbreviated to fit the page:

Because AddressID is part of a unique index here, an equality predicate on AddressID will always return a maximum of one record, so it is safe for the query optimizer to autoparameterize the query and reuse the same plan, as shown in the last row, with a usecounts value of 2 and an objtype value of Prepared. Autoparameterization is also called "simple parameterization" and is usually applied to those queries whose parameterized form would result in a trivial plan. The first two rows in this example are considered shell queries and do not contain a full execution plan, which you can verify by using the sys.dm_exec_query_plan DMF, as shown earlier.
The Optimize for Ad Hoc Workloads option
Optimize for Ad Hoc Workloads is a configuration option introduced with SQL Server 2008 that can be very helpful in cases where you have a large number of ad hoc queries with a low or no possibility of being reused. When this option is used, SQL Server will store a small, compiled plan stub in the plan cache when a query is optimized for the first time instead of the full execution plan. Only after a second optimization will the plan stub be replaced with the full execution plan. Avoiding plans that are never reused can help minimize the size of the plan cache and therefore free up system memory. There is no downside to using this option, so you may consider enabling it for every SQL Server installation.
Let’s look at an example of using sp_configure to enable this option. Execute the following statements:
EXEC sp_configure 'optimize for ad hoc workloads', 1
RECONFIGURE
DBCC FREEPROCCACHE
GO
SELECT * FROM Person.Address
WHERE StateProvinceID = 79
GO
SELECT * FROM sys.dm_exec_cached_plans
CROSS APPLY sys.dm_exec_sql_text(plan_handle)
WHERE text like '%Person%'
Here, we have enabled the Optimize for Ad Hoc Workloads configuration option at the instance level. After executing the first SELECT statement, we will see the following output:

As you can see, the compiled plan stub is a small object that uses a small number of bytes (in this case, 352). The usecounts column is always 1 for a compiled plan stub because it is never reused. It is also worth clarifying that a plan stub is not the same as the shell query mentioned earlier in this section.
Now, execute the following statements:
SELECT * FROM Person.Address
WHERE StateProvinceID = 79
GO
SELECT * FROM sys.dm_exec_cached_plans
CROSS APPLY sys.dm_exec_sql_text(plan_handle)
WHERE text like '%Person%'
This time, we get the following output:
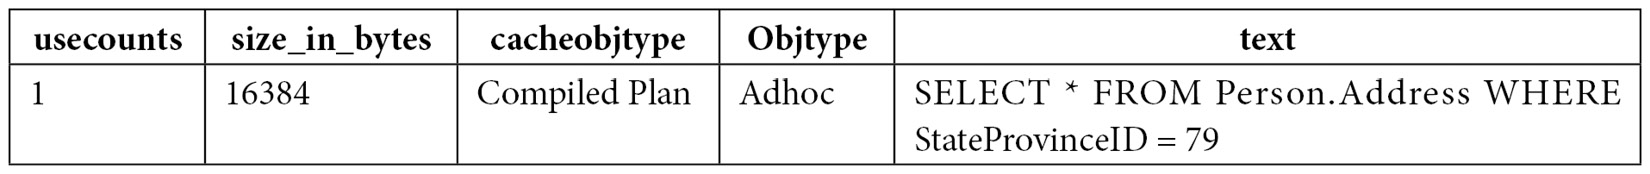
After the query is optimized the second time, the compiled plan stub is replaced with a full execution plan, as shown in the cacheobjtype column. Also, notice that the size of the plan is considerably larger than the plan stub (in this case, 16,384 bytes).
However, keep in mind that although this configuration option can be useful in scenarios where you may not have control over the queries submitted to SQL Server, it does not mean that writing a large number of ad hoc queries is recommended or encouraged. Using explicit parameterization (for example, with stored procedures) is recommended instead. Finally, although it is recommended to keep this configuration option enabled in your environments, don’t forget to disable it to continue testing the remaining code in this book using the default configuration:
EXEC sp_configure 'optimize for ad hoc workloads', 0
RECONFIGURE
Forced parameterization
Remember the first example in this section, where we used the StateProvinceID = 79 predicate and it wasn’t safe for SQL Server to parameterize? There might be some special cases where you want to parameterize similar queries if you know that using the same plan can provide better performance. Although you could create stored procedures to do just that, if your application generates ad hoc SQL calls, there is an option that was introduced with SQL Server 2008 that can help you do that – and without changing a single line of application source code. This option is forced parameterization, which can be set at the database level or for a specific query. Forced parameterization applies to the SELECT, INSERT, UPDATE, and DELETE statements, and it is subject to certain limitations, which are defined in the SQL Server documentation.
To enable this feature and test how it works, enable forced parameterization at the database level by running the following statement:
ALTER DATABASE AdventureWorks2019 SET PARAMETERIZATION FORCED
To test it, run the following queries again:
DBCC FREEPROCCACHE
GO
SELECT * FROM Person.Address
WHERE StateProvinceID = 79
GO
SELECT * FROM Person.Address
WHERE StateProvinceID = 59
GO
SELECT * FROM sys.dm_exec_cached_plans
CROSS APPLY sys.dm_exec_sql_text(plan_handle)
WHERE text like '%Person%'
Different from our first example, where we got two distinct plans, with one customized for each query, this time, we only get one, as shown in the following output:

In this case, we have only one query plan, as shown in the third row. The first two rows are not execution plans but rather shell queries, as indicated earlier in this section.
You may remember that the original plans that were created in the first example of this section included one with Clustered Index Scan and the other with an Index/Key Lookup combination. You may be wondering which plan was chosen to be shared for both executions. If you have made it this far in this book, you may easily guess that this plan is defined in the first optimization. If you use the query with the StateProvinceID = 79 predicate first, you will get a plan with Clustered Index Scan for both executions, whereas if you use the query with StateProvinceID = 59, you will get the Index/Key Lookup combination, again for both executions. Using some other values of StateProvinceID may even produce different execution plans.
However, because all the similar queries will be using the same plan, this may not be adequate in all scenarios and should be tested thoroughly in your application to verify that it is producing better query performance. The next section talks about problems with queries sensitive to parameters, or what many SQL Server users call the parameter-sniffing problem.
Finally, there are also the PARAMETERIZATION SIMPLE and PARAMETERIZATION FORCED query hints, which can be used to override the current database-level parameterization setting and can only be used inside a plan guide. For example, if you define the use of ALTER DATABASE AdventureWorks2019 SET PARAMETERIZATION FORCED, as shown earlier, you can define a plan guide that includes OPTION (PARAMETERIZATION SIMPLE) to override this behavior for a particular query.
Again, don’t forget to disable forced parameterization by running the following statement to return to the default parameterization setting:
ALTER DATABASE AdventureWorks2019 SET PARAMETERIZATION SIMPLE
Note
Forced parameterization should be used carefully and your database queries should be tested thoroughly.
Stored procedures
Finally, if you want to explicitly take advantage of parameterization and plan reuse, you have a few choices, which include using stored procedures, user-defined scalar functions, and multistatement table-valued functions. All these objects are designed to promote plan reuse and will show a value of Proc on the objtype column of the sys.dm_exec_cached_plans DMV. Therefore, let’s see what happens if you use a query that, by itself, was not automatically parameterized and see the behavior in a stored procedure using a parameter. Create the following stored procedure:
CREATE OR ALTER PROCEDURE test (@stateid int)
AS
SELECT * FROM Person.Address
WHERE StateProvinceID = @stateid
Run the following code:
DBCC FREEPROCCACHE
GO
exec test @stateid = 79
GO
exec test @stateid = 59
GO
SELECT * FROM sys.dm_exec_cached_plans
CROSS APPLY sys.dm_exec_sql_text(plan_handle)
WHERE text like '%Person%'
We get the following output:

Similar to the case with forced parameterization, where it was important to know which query was optimized first, in the case of a stored procedure, it is also critical to understand that the first optimization will use the parameter provided at that moment to produce the execution plan. In this case, where the 79 parameter is first used, you will notice that both plans are the same and use a Clustered Index Scan operator. You can run the following code, where the 59 parameter is used first, in which case the created plan will use an Index Seek/Key Lookup combination:
DBCC FREEPROCCACHE
GO
exec test @stateid = 59
GO
exec test @stateid = 79
GO
SELECT * FROM sys.dm_exec_cached_plans
CROSS APPLY sys.dm_exec_sql_text(plan_handle)
WHERE text like '%Person%'
Now that we’ve learned about parameterization, let’s learn what parameter sniffing is.
Note
If you are using SQL Server 2022 and especially for large amounts of data, SQL Server may trigger a parameter-sensitive plan optimization and you will get two different plans. Parameter-sensitive plan optimization will be covered at the end of this chapter.
Parameter sniffing
In this section, we will cover the cases in which reusing a plan can create performance problems. As you saw in Chapter 6, Understanding Statistics, SQL Server can use the histogram of statistics objects to estimate the cardinality of a query and then use this information to try and produce an optimal execution plan. The query optimizer accomplishes this by inspecting the values of the query parameters. This behavior is called parameter sniffing, and it is a very good thing: getting an execution plan tailored to the current parameters of a query improves the performance of your applications. This chapter has explained that the plan cache can store these execution plans so that they can be reused the next time the same query needs to be executed. This saves optimization time and CPU resources because the query does not need to be optimized again.
However, although the query optimizer and the plan cache work well together most of the time, some performance problems can occasionally appear. Given that the query optimizer can produce different execution plans for syntactically identical queries, depending on their parameters, caching and reusing only one of these plans may create a performance issue for alternative instances of this query that would benefit from a better plan. This is a known problem with T-SQL code using explicit parameterization, such as stored procedures. In this section, we will learn more about this problem, along with a few recommendations on how to fix it.
To see an example, let’s write a simple stored procedure using the Sales.SalesOrderDetail table on the AdventureWorks2019 database. As usual, you may have to use ALTER PROCEDURE if the procedure already exists:
CREATE OR ALTER PROCEDURE test (@pid int)
AS
SELECT * FROM Sales.SalesOrderDetail
WHERE ProductID = @pid
Run the following statement to execute the stored procedure:
EXEC test @pid = 897
The query optimizer estimates that only a few records will be returned by this query and produces the execution plan shown in Figure 8.2, which uses an Index Seek operator to quickly find the records on an existing nonclustered index, and a Key Lookup operator to search on the base table for the remaining columns requested by the query:

Figure 8.2 – A plan using the Index Seek and Key Lookup operators
This combination of the Index Seek and Key Lookup operators was a good choice because, although it’s a relatively expensive combination, the query was highly selective. However, what if a different parameter is used, producing a less selective predicate? For example, try the following code, which includes a SET STATISTICS IO ON statement to display the amount of disk activity generated by the query’s execution:
SET STATISTICS IO ON
GO
EXEC test @pid = 870
GO
The Messages tab will show the following output:
Table 'SalesOrderDetail'. Scan count 1, logical reads 18038, physical reads 57, read-ahead reads 447, lob logical reads 0, lob physical reads 0, lob read-ahead reads 0.
As you can see, on this execution alone, SQL Server is performing 18,038 logical reads when the base table only has 1,246 pages; therefore, it’s using over 14 times more I/O operations than just simply scanning the entire table. As you saw in Chapter 4, The Execution Engine, performing Index Seeks plus Key Lookups on the base table, which uses random I/Os, is a very expensive operation.
Now, clear the plan cache to remove the execution plan currently held in memory and run the stored procedure again, using the same parameter, as shown here:
DBCC FREEPROCCACHE
GO
EXEC test @pid = 870
GO
This time, you’ll get a different execution plan. The I/O information will now show that only 1,246 pages were read, and the execution plan will include Clustered Index Scan, as shown in Figure 8.3. Because there was no optimized version of the stored procedure in the plan cache, SQL Server optimized it from scratch using the new parameter and created a new optimal execution plan:

Figure 8.3 – A plan using Clustered Index Scan
Of course, this doesn’t mean you’re not supposed to trust your stored procedures anymore or that maybe all your code is incorrect. This is just a problem that you need to be aware of and research, especially if you have queries where performance changes dramatically when different parameters are introduced. If you happen to have this problem, you have a few choices available, which we’ll explore next.
Another related problem is that you don’t have control over the lifetime of a plan in the cache, so every time a plan is removed from the cache, the newly created execution plan may depend on whichever parameter happens to be passed next. Some of the following choices allow you to have a certain degree of plan stability by asking the query optimizer to produce a plan based on a typical parameter or the average column density.
Finally, as mentioned earlier, new with SQL Server 2022, a new feature of the intelligent query processing family, parameter-sensitive plan optimization, was introduced to help with this problem. This will be covered at the end of this chapter. Next, we will cover some other traditional solutions that you can use if you are still on an older version of SQL Server or have to use an older database compatibility level.
Optimizing for a typical parameter
There might be cases where most of the executions of a query use the same execution plan and you want to avoid an ongoing optimization cost by reusing that plan. In these cases, you can use a hint that was introduced with SQL Server 2005 called OPTIMIZE FOR, which is useful when an optimal plan can be generated for the majority of values that are used in a specific parameter. In addition, it can provide more plan stability. As a result, only a few executions that use an atypical parameter may not have an optimal plan.
Suppose that almost all the executions of our stored procedure would benefit from the previous plan using Index Seek and a Key Lookup operator. To take advantage of this, you could write the following stored procedure:
ALTER PROCEDURE test (@pid int)
AS
SELECT * FROM Sales.SalesOrderDetail
WHERE ProductID = @pid
OPTION (OPTIMIZE FOR (@pid = 897))
When you run the stored procedure for the first time, it will be optimized for a value of 897, no matter what parameter value was specified for the execution. If you want to check this, test the case by running the following command:
EXEC test @pid = 870
You can find the following entry close to the end of the XML plan (or the Parameter List property in a graphical plan):
<ParameterList>
<ColumnReference Column="@pid" ParameterCompiledValue="(897)"
ParameterRuntimeValue="(870)" />
</ParameterList>
This entry clearly shows which parameter value was used during optimization and which one was used during execution. In this case, the stored procedure is optimized only once, and the plan is stored in the plan cache and reused as many times as needed. The benefit of using this hint, in addition to avoiding optimization costs, is that you have total control over which plan is produced during the query optimization process and stored in the plan cache. The OPTIMIZE FOR query hint can also allow you to use more than one parameter, separated by commas.
Optimizing on every execution
If using different parameters produces different execution plans and you want the best performance for every query, the solution might be to optimize for every execution. You will get the best possible plan on every execution but will end up paying for the optimization cost, so you’ll need to decide whether that’s a worthwhile trade-off. To do this, use the RECOMPILE hint, as shown here:
ALTER PROCEDURE test (@pid int)
AS
SELECT * FROM Sales.SalesOrderDetail
WHERE ProductID = @pid
OPTION (RECOMPILE)
Using OPTION (RECOMPILE) can also allow the values of local variables to be sniffed, as shown in the next section. Not surprisingly, this option will return Option (Recompile) requested in the EventSubClass column in SQL Trace for both the SP:Recompile and SQL:StmtRecompile events, as you saw earlier in this chapter.
Local variables and the OPTIMIZE FOR UNKNOWN hint
Another solution that has been traditionally implemented in the past is the use of local variables in queries instead of parameters. As mentioned in Chapter 6, Understanding Statistics, the query optimizer can’t see the values of local variables at optimization time because these values are usually only known at execution time. However, by using local variables, you are disabling parameter sniffing, which means that the query optimizer will not be able to access the statistics histogram to find an optimal plan for the query. Instead, it will rely on just the density information of the statistics object, a subject also covered in Chapter 6, Understanding Statistics.
This solution will simply ignore the parameter values and use the same execution plan for all the executions, but at least you’re getting a consistent plan every time. A variation of the OPTIMIZE FOR hint shown previously is the OPTIMIZE FOR UNKNOWN hint. This hint was introduced with SQL Server 2008 and has the same effect as using local variables. A benefit of the OPTIMIZE FOR UNKNOWN hint compared to OPTIMIZE FOR is that it does not require you to specify a value for a parameter. Also, you don’t have to worry if a specified value becomes atypical over time.
Running the following two versions of our stored procedure will have equivalent outcomes and will produce the same execution plan. The first version uses local variables, while the second one uses the OPTIMIZE FOR UNKNOWN hint:
ALTER PROCEDURE test (@pid int)
AS
DECLARE @p int = @pid
SELECT * FROM Sales.SalesOrderDetail
WHERE ProductID = @p
ALTER PROCEDURE test (@pid int)
AS
SELECT * FROM Sales.SalesOrderDetail
WHERE ProductID = @pid
OPTION (OPTIMIZE FOR UNKNOWN)
In this case, the query optimizer will create the plan using the Clustered Index Scan shown previously, no matter which parameter you use to execute the stored procedure. Note that the OPTIMIZE FOR UNKNOWN query hint will apply to all the parameters used in a query unless you use the following syntax to target only a specific parameter:
ALTER PROCEDURE test (@pid int)
AS
SELECT * FROM Sales.SalesOrderDetail
WHERE ProductID = @pid
OPTION (OPTIMIZE FOR (@pid UNKNOWN))
Finally, keep in mind that parameter sniffing is a desired optimization, and you would only want to disable it when you have any of the problems mentioned in this section and if it improves the general performance of your query.
It is interesting to note that as of SQL Server 2005, where statement-level compilation was introduced to allow you to optimize an individual statement, it was technically possible to sniff the values of local variables in the same way as with a parameter. However, this behavior was not implemented because there was already a lot of code using local variables to explicitly disable parameter sniffing. Local variables, however, can be sniffed while using the RECOMPILE query hint, which was explained earlier. For example, let’s use the following code with both local variables and the OPTION (RECOMPILE) hint:
ALTER PROCEDURE test (@pid int)
AS
DECLARE @p int = @pid
SELECT * FROM Sales.SalesOrderDetail
WHERE ProductID = @p
OPTION (RECOMPILE)
Then, run the following:
EXEC test @pid = 897
The query optimizer will be able to see the value of the local variable (in this case, 897) and get a plan optimized for that specific value (in this case, the plan with the Index Seek/Key Lookup operations, instead of the plan with Clustered Index Scan, which was shown earlier when no value could be sniffed).
Although Chapter 6, Understanding Statistics, explained how to use the histogram and the density vector of the statistics object to estimate the cardinality of a query, let’s review this again here from the point of view of disabling parameter sniffing. Any of the stored procedures at the beginning of this section – either using local variables or the OPTIMIZE FOR UNKNOWN hint – will return the following plan, with an estimated cardinality of 456.079:

Figure 8.4 – Cardinality estimate with parameter sniffing disabled
Let’s see how SQL Server is obtaining a value of 456.079 and what the reasoning behind this is. As explained in Chapter 6, Understanding Statistics, density is defined as follows:
1 / number of distinct values
The SalesOrderDetail table has 266 distinct values for ProductID, so the density is calculated as 1 / 266, or 0.003759399, which you can verify by looking at the statistics object (for example, using the DBCC SHOW_STATISTICS statement). One assumption in the statistics mathematical model that’s used by SQL Server is the uniformity assumption and because in this case, SQL Server cannot use the histogram, the uniformity assumption tells us that for any given value, the data distribution is the same. To obtain the estimated number of records, SQL Server will multiply the density by the current total number of records (0.003759399 * 121,317, or 456.079), as shown in the plan. This is also the same as dividing the total number of records by the number of distinct values (121,317 / 266, which also equals 456.079).
Finally, the benefit of using the OPTIMIZE FOR UNKNOWN hint is that you only need to optimize the query once and can reuse the produced plan many times. Also, there is no need to specify a value like in the OPTIMIZE FOR hint.
Disabling parameter sniffing
As mentioned in the previous section, when you use local variables in a query to avoid using a stored procedure parameter or when you use the OPTIMIZE FOR UNKNOWN query hint, you are disabling parameter sniffing. Microsoft has also published trace flag 4136 to disable parameter sniffing at the instance level. As described in Microsoft Knowledge Base article 980653, this trace flag was first introduced as a cumulative update for older versions of SQL Server such as SQL Server 2005 SP3, SQL Server 2008 SP1, and SQL Server 2008 R2, and it is available on the latest versions as well, including SQL Server 2014. There are still three cases where this trace flag has no effect:
- Queries that use the OPTIMIZE FOR query hint
- Queries that use the OPTION (RECOMPILE) hint
- Queries in a stored procedure that use the WITH RECOMPILE option
As with using forced parameterization at the database level, this should be considered an extreme option that can only be used in some limited cases and should be used with caution. You should make sure you test your application thoroughly to validate that it improves performance. In addition, you could use this trace flag if the majority of your queries benefit from disabling parameter sniffing and still use any of the three exceptions listed previously for queries that may not. At least, Microsoft has recommended that users of their Dynamics AX application consider using this trace flag, as documented at http://blogs.msdn.com/b/axperf/archive/2010/05/07/important-sql-server-change-parameter-sniffing-and-plan-caching.aspx.
Finally, starting with SQL Server 2016, you can disable parameter sniffing at the database level or the query level by using ALTER DATABASE SCOPED CONFIGURATION SET PARAMETER_SNIFFING = OFF or the DISABLE_PARAMETER_SNIFFING hint, respectively.
Parameter sniffing and SET options affecting plan reuse
One interesting problem that we have sometimes been asked to troubleshoot is when a stored procedure is taking too long to execute or is timing out on a web application but returning immediately when executed directly in SQL Server Management Studio – even for the same parameters. Although there could be a few reasons for a performance problem like this, including blocking, the most frequent reason for this happening is related to a behavior where two different plans were created with different SET options, and at least one of those plans was optimized using a combination of parameters that produced a "bad" plan for some other executions of the same stored procedure with different parameters. Although you may be tempted to just run sp_recompile to force a new optimization and allow the application to continue working, this does not fix the problem, and it may eventually come back. You may also encounter a similar scenario where you have updated statistics, rebuilt an index, or changed something else to find out that, suddenly, the problem seems to be fixed. It is not. Those changes probably just forced a new optimization with the "good" parameter you were just testing. The best thing to do for this kind of problem is to capture the "bad" plan for further analysis to provide a permanent solution. In this section, we will learn how to do that.
Remember that, in general, query optimization is an expensive operation, and to avoid this optimization cost, the plan cache will try to keep the generated execution plans in memory so that they can be reused. However, if a new connection running the same stored procedure has different SET options, it may generate a new plan instead of reusing one already in the plan cache. This new plan can then be reused by later executions of the same stored procedure, but only if the same connection settings are used. A new plan will be needed because some of these SET options may impact the choice of an execution plan. This is because they affect the results of evaluating constant expressions during the optimization process. Another connection setting, FORCEPLAN, acts similarly to a hint, requesting that the query optimizer preserves the join order, as specified on the query syntax, and uses nested loop joins only. The following SET options will affect the reuse of execution plans:
- ANSI_NULL_DFLT_OFF
- ANSI_NULL_DFLT_ON
- ANSI_NULLS
- ANSI_PADDING
- ANSI_WARNINGS
- ARITHABORT
- CONCAT_NULL_YIELDS_NULL
- DATEFIRST
- DATEFORMAT
- FORCEPLAN
- LANGUAGE
- NO_BROWSETABLE
- NUMERIC_ROUNDABORT
- QUOTED_IDENTIFIER
Note
The ANSI_NULLS OFF, ANSI_PADDING OFF, and CONCAT_NULL_YIELDS_NULL OFF SET statements and database options have been deprecated. In future versions of SQL Server, these SET statements and database options will always be set to ON.
Unfortunately, management and development tools such as SQL Server Management Studio, the ADO.NET framework, and even the sqlcmd utility have different SET options in their default configuration. You will find that often, the problem is that one of the options, ARITHABORT, is OFF by default in ADO.NET and ON by default in Management Studio. Therefore, it may be possible that, in our example, Management Studio and the web application are using distinct cached plans, but the plan that was created for the web application was not good for some other executions of the same stored procedure with different parameters.
Now, let’s learn how to prove that optimizing with different parameters is, in fact, the problem for your specific instance of the issue. We’ll look at how to extract the plans to inspect both the parameters and the SET options that are used during optimization. Because AdventureWorks2019 does not have the default SET options of a new database, we’ll create our own database, copy some data from AdventureWorks2019, and create a new stored procedure. Run the following code to do so:
CREATE DATABASE Test
GO
USE Test
GO
SELECT * INTO dbo.SalesOrderDetail
FROM AdventureWorks2019.Sales.SalesOrderDetail
GO
CREATE NONCLUSTERED INDEX IX_SalesOrderDetail_ProductID
ON dbo.SalesOrderDetail(ProductID)
GO
CREATE OR ALTER PROCEDURE test (@pid int)
AS
SELECT * FROM dbo.SalesOrderDetail
WHERE ProductID = @pid
Let’s test two different applications by executing the stored procedure from both SQL Server Management Studio and a .NET application (the C# code for this application is included at the end of this section). For this test, we want to assume that a plan with a table scan is a bad plan and that a plan that uses an Index Seek/RID Lookup is the optimal one.
Start with a clean plan cache by running the following command:
DBCC FREEPROCCACHE
Run the .NET application from a command prompt window and provide a value of 870 as a parameter. Note that the only purpose of this .NET application is to run the test stored procedure we created earlier:
C:TestApp est
Enter ProductID: 870
Now, we can start inspecting the plan cache to see the plans that are available in memory. Run the following script from the Test database (we will be running this script again later in this exercise):
SELECT plan_handle, usecounts, pvt.set_options
FROM (
SELECT plan_handle, usecounts, epa.attribute, epa.value
FROM sys.dm_exec_cached_plans
OUTER APPLY sys.dm_exec_plan_attributes(plan_handle) AS epa
WHERE cacheobjtype = 'Compiled Plan') AS ecpa
PIVOT (MAX(ecpa.value) FOR ecpa.attribute IN ("set_options", "objectid")) AS pvtWHERE pvt.objectid = OBJECT_ID('dbo.test')You should get an output similar to the following:

The preceding output shows that we have one execution plan in the plan cache, it has been used once (as indicated by the usecounts value), and that the set_options value (taken from the sys.dm_exec_plan_attributes DMF) is 251. Because this was the first execution of the stored procedure, it was optimized using the 870 parameter, which in this case created a plan using a table scan (here, this is considered a "bad" plan). Now, run the application again using a parameter that returns only a few records and that should benefit from an Index Seek/RID Lookup plan:
C:TestApp est
Enter ProductID: 898
If you inspect the plan cache again, you will notice that the plan has been used twice, as noted by the usecounts column; unfortunately, this time, it was not good for the second parameter that was used. In a real production database, this second execution may not perform as expected, taking too long to execute, and it may cause the developer to try to troubleshoot the problem by running the stored procedure in Management Studio using something like this:
EXEC test @pid = 898
Now, the developer may be confused by the fact that SQL Server is returning a good execution plan and the query is returning its results immediately. Inspecting the plan cache again will show something similar to the following:

As you can see, a new plan was added for the Management Studio execution with a different value for set_options (in this case, 4347).
What should we do next? It is time to inspect the plans and look at the SET options and parameters that were used during the optimization. Select plan_handle of the first plan that was created (the one with a set_options value of 251 in your example) and use it to run the following query:
SELECT * FROM sys.dm_exec_query_plan(0x050007002255970F9042B8F801000000010000000000000000000 …)
You can find the SET options at the beginning of the XML plan (also available using the Properties window of a graphical execution plan):
<StatementSetOptions QUOTED_IDENTIFIER="true" ARITHABORT="false"
CONCAT_NULL_YIELDS_NULL="true" ANSI_NULLS="true" ANSI_PADDING="true"
ANSI_WARNINGS="true" NUMERIC_ROUNDABORT="false" />
You will find the used parameters at the end (also available in the graphical execution plan):
<ParameterList>
<ColumnReference Column="@pid" ParameterCompiledValue="(870)" />
</ParameterList>
Do the same for the second plan. You will get the following information for the SET options:
<StatementSetOptions QUOTED_IDENTIFIER="true" ARITHABORT="true"
CONCAT_NULL_YIELDS_NULL="true" ANSI_NULLS="true" ANSI_PADDING="true"
ANSI_WARNINGS="true" NUMERIC_ROUNDABORT="false" />
You will get the following parameter information:
<ParameterList>
<ColumnReference Column="@pid" ParameterCompiledValue="(898)" />
</ParameterList>
This information shows that the ARITHABORT SET option has a different value on these plans and that the parameter that was used to optimize the query on the web application was 870. You can also verify the operators that were used in the plan – the first one used a table scan, while the second one used an Index Seek/RID Lookup combination. Now that you have captured the plans, you can force a new optimization so that the application can use a better plan immediately (keeping in mind that this is not a permanent solution). Try this:
sp_recompile test
Optionally, you could use the following script to display the configured SET options for a specific set_options value:
DECLARE @set_options int = 4347
IF ((1 & @set_options) = 1) PRINT 'ANSI_PADDING'
IF ((4 & @set_options) = 4) PRINT 'FORCEPLAN'
IF ((8 & @set_options) = 8) PRINT 'CONCAT_NULL_YIELDS_NULL'
IF ((16 & @set_options) = 16) PRINT 'ANSI_WARNINGS'
IF ((32 & @set_options) = 32) PRINT 'ANSI_NULLS'
IF ((64 & @set_options) = 64) PRINT 'QUOTED_IDENTIFIER'
IF ((128 & @set_options) = 128) PRINT 'ANSI_NULL_DFLT_ON'
IF ((256 & @set_options) = 256) PRINT 'ANSI_NULL_DFLT_OFF'
IF ((512 & @set_options) = 512) PRINT 'NoBrowseTable'
IF ((4096 & @set_options) = 4096) PRINT 'ARITH_ABORT'
IF ((8192 & @set_options) = 8192) PRINT 'NUMERIC_ROUNDABORT'
IF ((16384 & @set_options) = 16384) PRINT 'DATEFIRST'
IF ((32768 & @set_options) = 32768) PRINT 'DATEFORMAT'
IF ((65536 & @set_options) = 65536) PRINT 'LanguageID'
This will return the following output for the set_options value of 4347:
ANSI_PADDING
CONCAT_NULL_YIELDS_NULL
ANSI_WARNINGS
ANSI_NULLS
QUOTED_IDENTIFIER
ANSI_NULL_DFLT_ON
ARITH_ABORT
Now that you have identified that this is a problem related to parameter sniffing, you can apply any of the techniques shown earlier in this section.
Finally, the following C# code can be used for the .NET application that was used in this section. You may need to reformat and keep the connection string in a single line to avoid any compilation errors:
using System;
using System.Data;
using System.Data.SqlClient;
class Test
{static void Main()
{SqlConnection cnn = null;
SqlDataReader reader = null;
try
{ Console.Write("Enter ProductID: ");string pid = Console.ReadLine();
cnn = new SqlConnection("DataSource=(local);Initial Catalog=Test;
Integrated Security=SSPI");
SqlCommand cmd = new SqlCommand();
cmd.Connection = cnn;
cmd.CommandText = "dbo.test";
cmd.CommandType = CommandType.StoredProcedure;
cmd.Parameters.Add
("@pid", SqlDbType.Int).Value = pid;cnn.Open();
reader = cmd.ExecuteReader();
while (reader.Read())
{Console.WriteLine(reader[0]);
}
return;
}
catch (Exception e)
{throw e;
}
finally
{if (cnn != null)
{if (cnn.State != ConnectionState.Closed)
cnn.Close();
}
}
}
}
Same as with the C# code shown in Chapter 2, Troubleshooting Queries, to compile this code, you need to run the following in a command prompt window, assuming the code was saved in a file named test.cs:
csc test.cs
Visual Studio is not required to compile this code, just the Microsoft .NET Framework, which is needed to install SQL Server. Therefore, it will already be installed on your system. You may need to find the location of the .csc executable, though, if it is not included on the system PATH (although it is usually inside the C:WindowsMicrosoft.NET directory). The connection string in the code assumes you are connecting to a default instance of SQL Server using Windows authentication, so you may need to change these values if they are different in your installation. In the next section, we will learn about one of the most interesting features in SQL Server 2022 – that is, parameter-sensitive plan optimization.
Parameter-sensitive plan optimization
One of the most exciting features of SQL Server 2022 is, without a doubt, parameter-sensitive plan optimization, which is part of the intelligent query processing family of features. Parameter-sensitive query optimization intends to help with performance problems related to parameter-sensitive queries. So, in this section, we will cover how it works and how to use it.
Let’s explore and learn how the technology works; we will explain the details along the way. If you have followed all the examples in this book so far, after many changes, perhaps this could be a good moment to restore a fresh copy of AdventureWorks2019. You may notice that the database has a compatibility level of 140 or SQL Server 2017 (even when the database was given a 2019 name). As mentioned previously, this is a new SQL Server feature and it is only available under database compatibility level 160, so you need to run the following statement:
ALTER DATABASE AdventureWorks2019 SET COMPATIBILITY_LEVEL = 160
Although not required, it is highly recommended that you also enable the query store so that you can get additional insights into the parameter-sensitive plan optimization feature and the available execution plans. Run the following statements:
ALTER DATABASE AdventureWorks2019 SET QUERY_STORE = ON
ALTER DATABASE AdventureWorks2019 SET QUERY_STORE (OPERATION_MODE = READ_WRITE)
ALTER DATABASE AdventureWorks2019 SET QUERY_STORE CLEAR ALL
Create our test procedure once again:
CREATE OR ALTER PROCEDURE test (@pid int)
AS
SELECT * FROM Sales.SalesOrderDetail
WHERE ProductID = @pid
Run the following statement, which we know must return only two rows:
EXEC test @pid = 897
Now, run the following statement:
EXEC test @pid = 870
Parameter-sensitive plan optimization does not seem to work so far. SQL Server seems to have the same behavior that we saw previously and has reused the same plan. In addition, by inspecting the XML plan, we can’t see some new elements that we will cover soon.
SQL Server 2022 brings a new extended event, parameter_sensitive_plan_optimization_skipped_reason, which triggers when the parameter-sensitive plan optimization feature is skipped. As such, we can use this event to find out why parameter-sensitive plan optimization was skipped in our test. Create the following extended events session:
CREATE EVENT SESSION psp ON SERVER
ADD EVENT sqlserver.parameter_sensitive_plan_optimization_skipped_reason
WITH (STARTUP_STATE = ON)
Start the session you just created:
ALTER EVENT SESSION psp
ON SERVER
STATE=START
Run the example again:
EXEC test @pid = 897
An easy way to see captured events is to use Watch Live Data, as explained in Chapter 2, Troubleshooting Queries. In our case, the reason that was returned was SkewnessThresholdNotMet, so if a specified skewness threshold was not met, perhaps we need more data to test this feature.
Note
Other reasons returned for some other queries in my test included LoadStatsFailed, UnsupportedComparisonType, UnsupportedObject, SystemDB, OutputOrModifiedParam, DatatypesIncompat, ConjunctThresholdNotMet, UnsupportedStatementType, NonCacheable, and QueryTextTooLarge. Although these names suggest the reason without additional explanation, at the time of writing, they are undocumented. You can get the entire list by running the following code:
SELECT name, map_value
FROM sys.dm_xe_map_values
WHERE name = 'psp_skipped_reason_enum'
So, let’s try a new data setup instead. Drop the dbo.SalesOrderDetail table if you still have it and create the following in AdventureWorks2019:
CREATE TABLE dbo.SalesOrderDetail (
SalesOrderID int NOT NULL,
SalesOrderDetailID int NOT NULL,
CarrierTrackingNumber nvarchar(25) NULL,
OrderQty smallint NOT NULL,
ProductID int NOT NULL,
SpecialOfferID int NOT NULL,
UnitPrice money NOT NULL,
UnitPriceDiscount money NOT NULL,
LineTotal money,
rowguid uniqueidentifier ROWGUIDCOL NOT NULL,
ModifiedDate datetime NOT NULL)
Run the following code:
INSERT INTO dbo.SalesOrderDetail (
SalesOrderID,
SalesOrderDetailID,
CarrierTrackingNumber,
OrderQty,
ProductID,
SpecialOfferID,
UnitPrice,
UnitPriceDiscount,
LineTotal,
rowguid,
ModifiedDate)
SELECT * FROM Sales.SalesOrderDetail
WHERE ProductID = 897
-- WHERE ProductID = 870
-- GO 50
First, execute the code as is. This will insert two records for ProductID 897. Execute the code a second time with the following changes, changing the comments in the last three lines:
-- WHERE ProductID = 897
WHERE ProductID = 870
GO 50
This second version of the code will insert 4,688 records for ProductID 897 and will run it 50 times for a total of 234,400 records. Now, create an index:
CREATE INDEX IX_ProductID ON dbo.SalesOrderDetail(ProductID)
We need this index to easily find the records with high selectivity. We will also use it to easily identify the query optimizer statistics later in this exercise. Change the test procedure so that it accesses the new table instead:
ALTER PROCEDURE test (@pid int)
AS
SELECT * FROM dbo.SalesOrderDetail
WHERE ProductID = @pid
Run our queries, as shown here, and inspect the resulting execution plans:
DBCC FREEPROCCACHE
GO
EXEC test @pid = 897
GO
EXEC test @pid = 870
Parameter-sensitive plan optimization seems to be working now. We got two different plans, each tailored for the submitted parameters. The first one uses Index Seek, while the second one uses Table Scan, as we saw earlier in this chapter. The first plan is shown here:

Figure 8.5 – A plan using parameter-sensitive plan optimization
Now, let’s see how the feature works. Run the following code:
DBCC FREEPROCCACHE
GO
EXEC test @pid = 897
GO
EXEC test @pid = 870
GO 4
EXEC test @pid = 897
GO 2
SELECT * FROM sys.dm_exec_cached_plans CROSS APPLY
sys.dm_exec_sql_text(plan_handle)
You can find our original test procedure information by looking at the row with the objtype = 'Proc' column and the text column corresponding to the procedure definition. It has a usecount value of 7, which corresponds to the total number of executions. More interesting is to look at the two rows with objtype = 'Prepared' with usecounts values of 3 and 4, which correspond to each procedure and parameter number of executions. The text column on these two rows looks like this:
(@pid int)SELECT * FROM dbo.SalesOrderDetail WHERE ProductID = @pid option (PLAN PER VALUE(QueryVariantID = 3, predicate_range([AdventureWorks2019].[dbo].[SalesOrderDetail].[ProductID] = @pid, 100.0, 100000.0)))
Here, we have a few new concepts such as QueryVariantID and predicate_range, which we will cover next. We have the following two entries on the XML plan, which are also new. You will notice the Dispatcher element from one of the plans:
<ParameterSensitivePredicate LowBoundary="100" HighBoundary="100000">
<StatisticsInfo … Statistics="[IX_ProductID]" ModificationCount="0" SamplingPercent="100" />
<Predicate>
<ScalarOperator ScalarString="[AdventureWorks2019].[dbo].[SalesOrderDetail].[ProductID]=[@pid]">
<Compare CompareOp="EQ">
…
</Dispatcher>
There’s also the QueryVariantID attribute of the QueryPlan element:
<QueryPlan … QueryVariantID="3">
So, how does parameter-sensitive plan optimization work? When you run the query for the first time, the query optimizer will inspect the statistics histogram to identify non-uniform distributions and evaluate up to three out of all available predicates. Let’s see the histogram of our trivial example:
We will get the following trivial histogram:

The initial optimization produces a dispatcher plan, which contains the optimization logic in what is called a dispatcher expression. A dispatcher maps to query variants based on the cardinality of the predicate boundaries. As shown in the XML fragment earlier, the Dispatcher element includes details about the predicate boundaries, which are based on the histogram. This can be found in the ParameterSensitivePredicate entry. It also includes the query variants as QueryVariantID in the QueryPlan element. In our case, it showed QueryVariantID values 1 and 3 for our two execution plans.
Also, notice the equality operator (EQ). On this first release, only predicates with EQs are supported. According to data collected by Microsoft, these cases represent 90% of parameter-sensitive problems.
Finally, you can disable this feature if needed, such as in the typical case of performance regressions. You can use the ALTER DATABASE SCOPED CONFIGURATION SET PARAMETER_SENSITIVE_PLAN_OPTIMIZATION = OFF statement or the DISABLE_PARAMETER_SENSITIVE_PLAN_OPTIMIZATION hint to disable parameter-sensitive plan optimization at the database or query level, respectively. As usual, to clean up after finishing this exercise, drop the SalesOrderDetail table and stop and delete the extended events session.
Summary
This chapter covered plan caching and focused on what you need to know to efficiently reuse query plans. Query optimization is a relatively expensive operation, so if a query can be optimized once and the created plan can be reused many times, it can greatly improve the performance of your applications. We covered the batch compilation and recompilation process in detail and showed you how to identify problems with excessive compilations and recompilations.
Plan reuse is based on query parameterization, so this topic was also covered in detail. We looked at cases where SQL Server decides to automatically parameterize your queries, as well as cases when it has to be explicitly defined by either using the forced parameterization configuration option or objects such as stored procedures, user-defined scalar functions, and multistatement table-valued functions.
Although looking at the parameters of a query helps the query optimizer produce better execution plans, occasionally reusing some of these plans can also be a performance problem because they may not be optimal for the same query being executed with different parameters. We showed that parameter sniffing is, in fact, a performance optimization, but we also covered solutions to the cases when reusing such plans may not be adequate, especially in the case of parameter-sensitive queries.
Finally, we covered parameter-sensitive query optimization, which was introduced with SQL Server 2022 and is part of the intelligent query processing family of features. It intends to help with performance problems related to parameter-sensitive queries. In the next chapter, we will learn more about various intelligent query processing features that came with SQL Server.