Chapter 9: The Query Store
This chapter covers the Query Store, a feature introduced with SQL Server 2016 that allows you to troubleshoot queries and execution plan-related issues and monitor performance history. The Query Store collects information about queries, plans, and runtime statistics, helping you pinpoint performance differences due to changes in execution plans.
The Query Store has been improved with every release since then and, new with SQL Server 2022, allows you to enable some of the new intelligent query processing features. For example, features such as memory grant feedback, cardinality estimation feedback, and degree of parallelism feedback use the Query Store to persist their information on queries and plans.
New with SQL Server 2022, the Query Store can also be enabled on secondary replicas used by Always On availability groups. This can help in scenarios where you want to troubleshoot query performance on read-only workloads running on secondary replicas.
In addition, this version introduced Query Store hints. Traditional query hints, which will be covered in the last chapter of this book, allow you to affect the query execution behavior, but they require you to rewrite the query text, something that may not always be possible in your production environment. As will be covered in Chapter 12, plan guides are a way to achieve the same as Query Store hints, although they are very complex to use.
This chapter provides an introduction to the Query Store and will show you the basics, such as how to configure and use the Query Store using both SQL Server Management Studio and T-SQL, as well as how to query the Query Store catalog views. Query store hints will be briefly covered in the next chapter since they are used by the cardinality estimation feedback feature. For more details about the Query Store, you can read the SQL Server documentation or my book High-Performance SQL Server.
This chapter covers the following topics:
- Using the Query Store
- Querying the Query Store
Using the Query Store
Configuring the Query Store is straightforward – we will enable it a few times in Chapter 10, so that we can work with some of the new intelligent query processing features. In this section, we will configure it. You may want to start with a fresh copy of the AdventureWorks2019 database. In SQL Server Management Studio, right-click the AdventureWorks database, select Properties, and then select Query Store. You will see something similar to the following:

Figure 9.1 – Query Store configuration
To enable the Query Store, you must change Operation Mode (Requested) to Read write. If you click the Script button at the top of the Database Properties window, the following code will be generated:
USE master
GO
ALTER DATABASE AdventureWorks2019 SET QUERY_STORE = ON
GO
ALTER DATABASE AdventureWorks2019 SET QUERY_STORE (OPERATION_MODE = READ_WRITE)
Click OK or run the produced code. In addition, you can use the same method to change any of the listed Query Store properties. You can use the following catalog view to see the currently defined Query Store properties while connected to the AdventureWorks2019 database:
SELECT * FROM sys.database_query_store_options
To start testing the Query Store, we need some query activity. Run the following random queries that have been taken from Chapter 3 and Chapter 4. The query and plan information will be available in the Query Store immediately once the query has been optimized and executed:
SELECT TerritoryID, COUNT(*)
FROM Sales.SalesOrderHeader
GROUP BY TerritoryID
ORDER BY TerritoryID
SELECT * FROM Sales.SalesOrderdetail s
JOIN Production.Product p ON s.ProductID = p.ProductID
WHERE SalesOrderID = 43659
OPTION (MERGE JOIN)
SELECT h.SalesOrderID, s.SalesOrderDetailID, OrderDate
FROM Sales.SalesOrderHeader h
JOIN Sales.SalesOrderDetail s ON h.SalesOrderID = s.SalesOrderID
SELECT e.BusinessEntityID, TerritoryID
FROM HumanResources.Employee AS e
JOIN Sales.SalesPerson AS s ON e.BusinessEntityID = s.BusinessEntityID
SELECT SalesOrderID, SUM(LineTotal)FROM Sales.SalesOrderDetail
GROUP BY SalesOrderID
SELECT c.CustomerID, COUNT(*)
FROM Sales.Customer c JOIN Sales.SalesOrderHeader s
ON c.CustomerID = s.CustomerID
WHERE c.TerritoryID = 4
GROUP BY c.CustomerID
SELECT DISTINCT pp.LastName, pp.FirstName
FROM Person.Person pp JOIN HumanResources.Employee e
ON e.BusinessEntityID = pp.BusinessEntityID
JOIN Sales.SalesOrderHeader soh
ON pp.BusinessEntityID = soh.SalesPersonID
JOIN Sales.SalesOrderDetail sod
ON soh.SalesOrderID = soh.SalesOrderID
JOIN Production.Product p
ON sod.ProductID = p.ProductID
WHERE ProductNumber = 'BK-M18B-44'
SELECT soh.SalesOrderID, sod.SalesOrderDetailID, SalesReasonID
FROM Sales.SalesOrderHeader soh
JOIN Sales.SalesOrderDetail sod
ON soh.SalesOrderID = soh.SalesOrderID
JOIN Sales.SalesOrderHeaderSalesReason sohsr
ON sohsr.SalesOrderID = soh.SalesOrderID
WHERE soh.SalesOrderID = 43697
Now, we can start inspecting the query and plan information that’s available. To see the available choices, expand or refresh the Query Store folder in SQL Server Management Studio, as shown in the following screenshot:
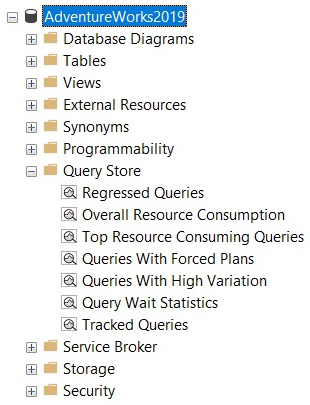
Figure 9.2 – The Query Store folder
Select Top Resource Consuming Queries to open the Top Resource Consuming Queries pane. A sample can be seen in the following screenshot:
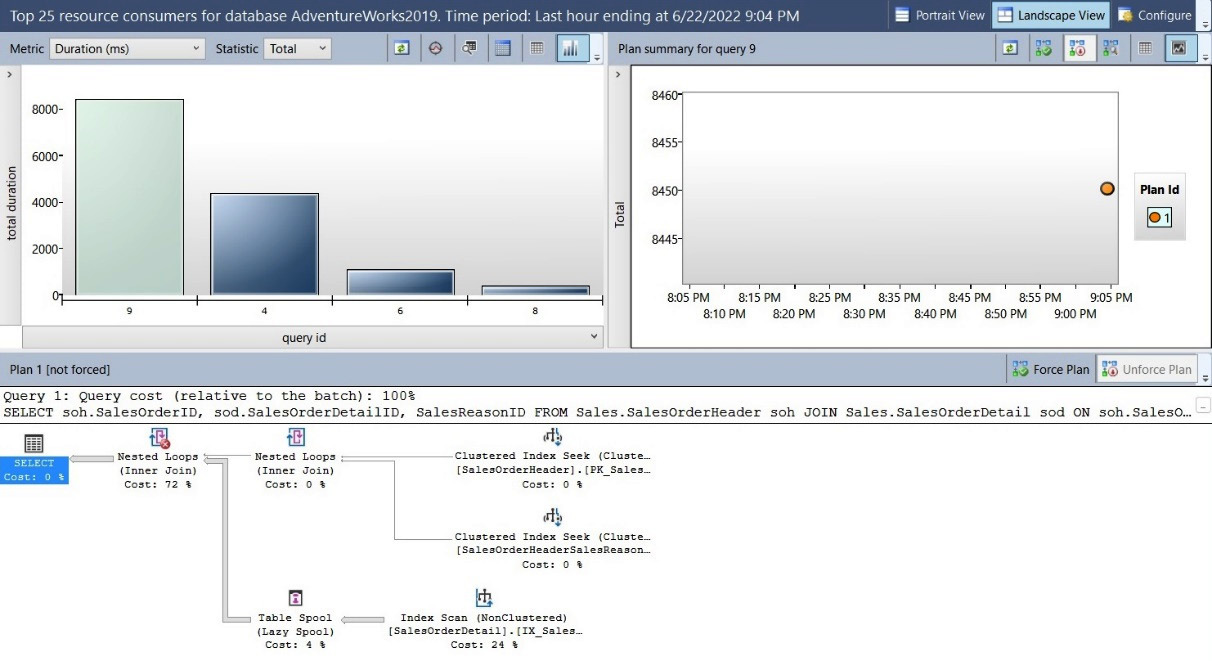
Figure 9.3 – The Top Resource Consuming Queries pane
Spend some time becoming familiar with the feature. For example, you can select different metrics such as duration, execution count, CPU time, logical reads, logical writes, physical reads, CLR time, DOP, memory consumption, row count, log memory used, tempdb memory used, and wait time. You could also inspect the available query plans and optionally force or unforce any of them. Several other choices are available, such are for viewing the information in a different format or configuring the time interval.
Selecting Regressed queries will take you to the Regressed Queries pane. Since we just enabled the Query Store, we may not have any regressed queries yet. The Regressed queries pane will show you similar information to the Top Resource Consuming Queries pane.
Try a few more queries, as shown here. Create or alter our test procedure once again:
CREATE OR ALTER PROCEDURE test (@pid int)
AS
SELECT * FROM Sales.SalesOrderDetail
WHERE ProductID = @pid
Run each query 100 times:
EXEC test @pid = 897
GO 100
EXEC test @pid = 870
GO 100
Now, you can run Queries With High Variation to get the Queries With High Variation pane, which is partially shown in the following screenshot:

Figure 9.4 – A partial view of the Queries With High Variation pane
Finally, select Query Waits Statistics, which will open the Query Waits Statistics pane, which is partially shown in the following screenshot. Wait statistics in the Query Store are only available starting with SQL Server 2017 and can be individually enabled by running the following statement:
ALTER DATABASE AdventureWorks2019 SET QUERY_STORE = ON (WAIT_STATS_CAPTURE_MODE = ON)
Wait statistics was also enabled by default when we enabled the Query Store in SQL Server 2022 at the beginning of this chapter, something you can verify by looking at the wait_stats_capture_mode column of the sys.database_query_store_options catalog view:

Figure 9.5 – A partial view of the Query Wait Statistics pane
Now that we have learned what the Query Store is and how it can be used, let’s learn how to use queries to work with it.
Querying the Query Store
So far, we have only been using the Query Store user interface directly in SQL Server Management Studio. It won’t be long after you start working with the Query Store that you will need to query the Query Store tables directly. As a quick introduction on how to access such tables, I will cover two examples here. For more details, please refer to the SQL Server documentation.
One of my favorites is the following query to collect queries that have timed out or finished because of an error. But first, let’s create at least one example. Run the following query. Since it is running an expensive CROSS JOIN, it will take too long to finish. Cancel the query after running it for a few seconds:
SELECT * FROM Sales.SalesOrderDetail sod1 CROSS JOIN Sales.SalesOrderDetail sod2
Now, you can run the following report to list all the queries that timed out or finished because of an error:
SELECT rs.avg_logical_io_reads, qt.query_sql_text,
q.query_id, execution_type_desc, qt.query_text_id, p.plan_id,
rs.runtime_stats_id,
rsi.start_time, rsi.end_time, rs.avg_rowcount, rs.count_executions
FROM sys.query_store_query_text AS qt
JOIN sys.query_store_query AS q
ON qt.query_text_id = q.query_text_id
JOIN sys.query_store_plan AS p
ON q.query_id = p.query_id
JOIN sys.query_store_runtime_stats AS rs
ON p.plan_id = rs.plan_id
JOIN sys.query_store_runtime_stats_interval AS rsi
ON rsi.runtime_stats_interval_id = rs.runtime_stats_interval_id
WHERE execution_type_desc IN ('Aborted', 'Exception')Finally, let’s look at a typical query that lists the most expensive queries by CPU time. Keep in mind that using the Query Store for this kind of report has multiple advantages over DMVs such as sys.dm_exec_query_stats. For example, the Query Store captures the history of the plans for every query. The listed DMV only provides information about the plans that are currently in the plan cache. Some plans are never cached at all or some may be evicted because of memory pressure or some other reasons:
SELECT TOP 20
p.query_id query_id,
qt.query_sql_text query_text,
CONVERT(float, SUM(rs.avg_cpu_time * rs.count_executions)) total_cpu_time,
SUM(rs.count_executions) count_executions,
COUNT(DISTINCT p.plan_id) num_plans
FROM sys.query_store_runtime_stats rs
JOIN sys.query_store_plan p ON p.plan_id = rs.plan_id
JOIN sys.query_store_query q ON q.query_id = p.query_id
JOIN sys.query_store_query_text qt ON q.query_text_id = qt.query_text_id
GROUP BY p.query_id, qt.query_sql_text
ORDER BY total_cpu_time DESC
Finally, you may never need to disable the Query Store. If you do need to do this, run the following command:
ALTER DATABASE AdventureWorks2019 SET QUERY_STORE = OFF
With these examples, you have learned how to use queries to work with the Query Store.
Summary
This chapter covered the Query Store, a query performance troubleshooting feature that collects information about queries, plans, and runtime statistics and can be used to find performance differences due to execution plan changes.
New with SQL Server 2022, the Query Store can be used to implement query hints and can be enabled on secondary replicas. Query store hints can be used to change the behavior of a query without the need to change the query’s text. The Query Store can be enabled on secondary replicas used by Always On availability groups. This can help in scenarios where you want to troubleshoot query performance on read-only workloads running on such secondary replicas.
Finally, as covered in the next chapter, the Query Store plays a very important role in the new intelligent query processing features that are available. This is because it is required by the memory grant feedback, cardinality estimation feedback, and degree of parallelism feedback features to persist information on queries and plans. In addition, it may be used by the cardinality estimation feedback feature to implement a Query Store hint.