
Chapter 10: Managing Containers Effectively with Kubernetes
In the previous chapter, we learned in detail about containers with Docker, about the construction of a Docker image, and about the instantiation of a new container on the local machine. Finally, we set up a continuous integration/continuous deployment (CI/CD) pipeline that builds an image, deploys it in Docker Hub, and executes its container in Azure Container Instances (ACI).
All this works well and does not pose too many problems when working with a few containers. But in so-called microservice applications—that is, applications that are composed of several services (each of them is a container), we will need to manage and orchestrate these containers.
There are two major container orchestration tools on the market: Docker Swarm and Kubernetes.
For some time now, Kubernetes, also known as K8S, has proved to be a true leader in the field of container management and is therefore becoming a must for the containerization of applications.
In this chapter, we will learn how to install Kubernetes on a local machine, as well as an example of how to deploy an application in Kubernetes, both in a standard way and with Helm. We will learn in more depth about Helm by creating a chart and publishing it in a private registry on Azure Container Registry (ACR).
Then, we will talk about Azure Kubernetes Service (AKS) as an example of a Kubernetes cluster, and finally, we will learn how to monitor applications and metrics in Kubernetes.
This chapter will cover the following topics:
- Installing Kubernetes
- A first example of Kubernetes application deployment
- Using Helm as a package manager
- Publishing a Helm chart in a private registry (ACR)
- Using AKS
- Creating a CI/CD pipeline for Kubernetes with Azure Pipelines
- Monitoring applications and metrics in Kubernetes
Technical requirements
This chapter is a continuation of the previous chapter on Docker, so to understand it properly, it is necessary to have read that chapter and to have installed Docker Desktop (for the Windows operating system (OS)).
In the CI/CD part of this chapter, you will need to retrieve the source code that was provided in the previous chapter on Docker, which is available at https://github.com/PacktPublishing/Learning-DevOps-Second-Edition/tree/main/CHAP09/appdocker.
For the section about Helm charts on ACR, it's necessary to have an Azure subscription (register for free here: https://azure.microsoft.com/en-us/free/) and that you have installed the Azure Command-Line Interface (CLI) binary, available here: https://docs.microsoft.com/en-us/cli/azure/install-azure-cli.
The entire source code for this chapter is available at https://github.com/PacktPublishing/Learning-DevOps-Second-Edition/tree/main/CHAP10.
Check out the following video to see the Code in Action:
Installing Kubernetes
Before installing Kubernetes, we need to have an overview of its architecture and main components, because Kubernetes is not a simple tool but is a cluster—that is, it consists of a master server and other slave servers called nodes.
I suggest you explore the architecture of Kubernetes in a simplified way.
Kubernetes architecture overview
Kubernetes is a platform that is made up of several components that assemble together and extend on demand, in order to enable better scalability of applications. The architecture of Kubernetes, which is a client/server type, can be represented simply, as shown in the following diagram:
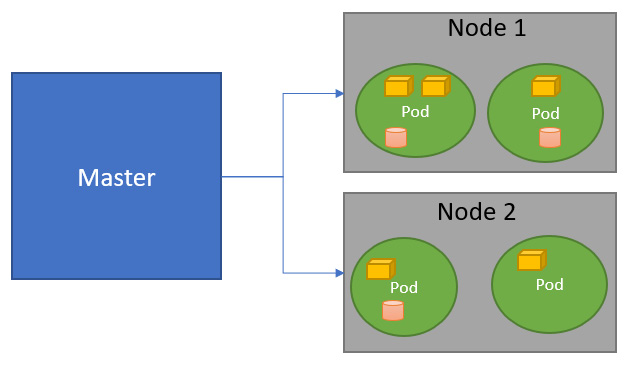
Figure 10.1 – Kubernetes architecture
In the previous diagram, we can see that a cluster is made up of a master component and nodes (also called worker nodes), which represent the slave servers.
In each of these nodes, there are pods, which are virtual elements that will contain containers and volumes.
Put simply, we can create one pod per application, and it will contain all the containers of the application. For example, one pod can contain a web server container, a database container, and a volume that will contain persistent files for images and database files.
Finally, kubectl is the client tool that allows us to interact with a Kubernetes cluster. With this, we have the main requirements that allow us to work with Kubernetes, so let's look at how we can install it on a local machine.
Installing Kubernetes on a local machine
When developing a containerized application that is to be hosted on Kubernetes, it is very important to be able to run the application (with its containers) on your local machine, before deploying it on remote Kubernetes production clusters.
In order to install a Kubernetes cluster locally, there are several solutions, which are detailed next.
The first solution is to use Docker Desktop by performing the following steps:
- If we have already installed Docker Desktop, which we learned about in Chapter 9, Containerizing Your Application with Docker, we can activate the Enable Kubernetes option in Settings on the Kubernetes tab, as shown in the following screenshot:

Figure 10.2 – Enabling Kubernetes in Docker Desktop
- After clicking on the Apply & Restart button, Docker Desktop will install a local Kubernetes cluster, and also the kubectl client tool, on the local machine.
The second way of installing Kubernetes locally is to install minikube, which also installs a simplified Kubernetes cluster locally. Here is the official documentation that you can read: https://minikube.sigs.k8s.io/docs/start/.
Note
There are other solutions for installing local Kubernetes, such as kind or kubeadm. For more details, read the documentation here: https://kubernetes.io/docs/tasks/tools/.
Following the local installation of Kubernetes, we will check its installation by executing the following command in a Terminal:
kubectl version --short
The following screenshot shows the results for the preceding command:
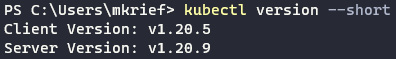
Figure 10.3 – kubectl getting the binary version
Note
All of the operations that we carry out on our Kubernetes cluster will be done with kubectl commands.
After installing our Kubernetes cluster, we'll need another element, which is the Kubernetes dashboard. This is a web application that allows us to view the status, as well as all the components, of our cluster.
In the next section, we'll discuss how to install and test the Kubernetes dashboard.
Installing the Kubernetes dashboard
In order to install the Kubernetes dashboard, which is a pre-packaged containerized web application that will be deployed in our cluster, we will run the following command in a Terminal:
kubectl apply -f https://raw.githubusercontent.com/kubernetes/dashboard/v2.4.0/aio/deploy/recommended.yaml
Its execution is shown in the following screenshot:
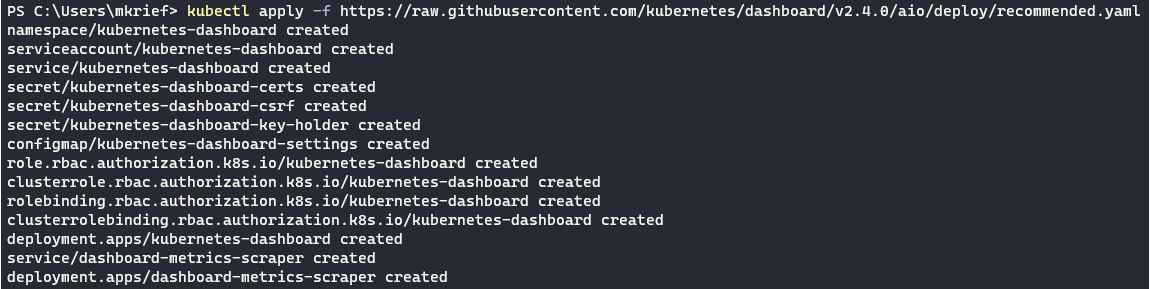
Figure 10.4 – Kubernetes dashboard installation
From the preceding screenshot, we can see that different artifacts are created, which are outlined as follows: secrets, two web applications, role-based access control (RBAC) roles, permissions, and services.
Note
Note that the Uniform Resource Locator (URL) mentioned in the parameters of the command that installs the dashboard may change depending on the versions of the dashboard. To find out the last valid URL to date, consult the official documentation by visiting https://kubernetes.io/docs/tasks/access-application-cluster/web-ui-dashboard/.
Now that we have installed this Kubernetes dashboard, we will connect to it and configure it.
To open the dashboard and connect to it from our local machine, we must first create a proxy between the Kubernetes cluster and our machine by performing the following steps:
- To create a proxy, we execute the kubectl proxy command in a Terminal. The detail of the execution is shown in the following screenshot:
Figure 10.5 – kubectl proxy command
We can see that the proxy is open on the localhost address (127.0.0.1) on port 8001.
- Then, in a web browser, open the following URL, http://localhost:8001/api/v1/namespaces/kubernetes-dashboard/services/https:kubernetes-dashboard:/proxy/#/login, which is a local URL (localhost and 8001) that is created by the proxy and that points to the Kubernetes dashboard application we have installed.
The following screenshot shows how to select the Kubernetes configuration file or enter the authentication token:
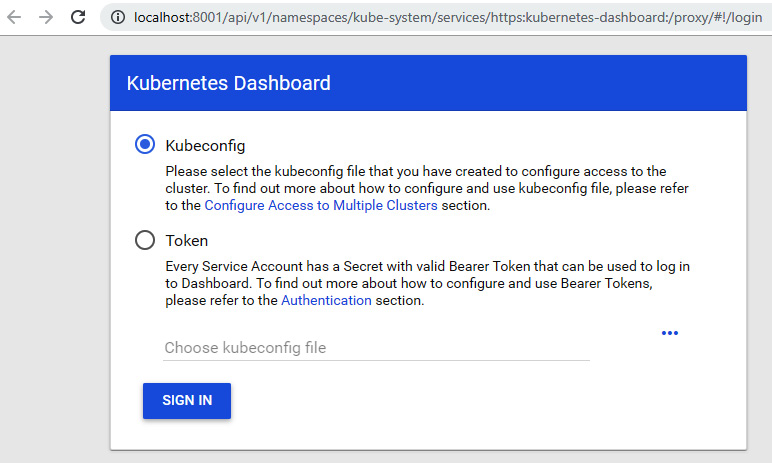
Figure 10.6 – Kubernetes dashboard authentication
- To create a new user authentication token, we will execute the following script in a PowerShell Terminal:
$TOKEN=((kubectl -n kube-system describe secret default | Select-String "token:") -split " +")[1]kubectl config set-credentials docker-for-desktop --token="${TOKEN}"
The execution of this script creates a new token inside the local config file.
- Finally, in the dashboard, we will select the config file, which is located in the C:Users<user name>.kube folder, as shown in the following screenshot:
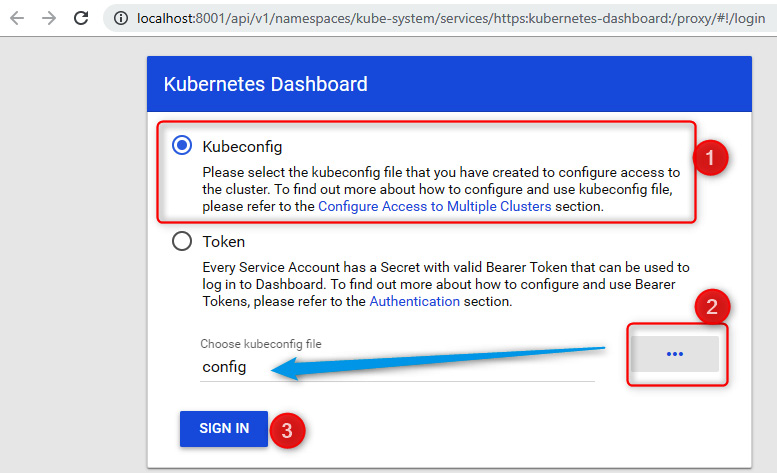
Figure 10.7 – Kubernetes dashboard authentication with the kubeconfig file
Note
For token authentication, read this blog post:
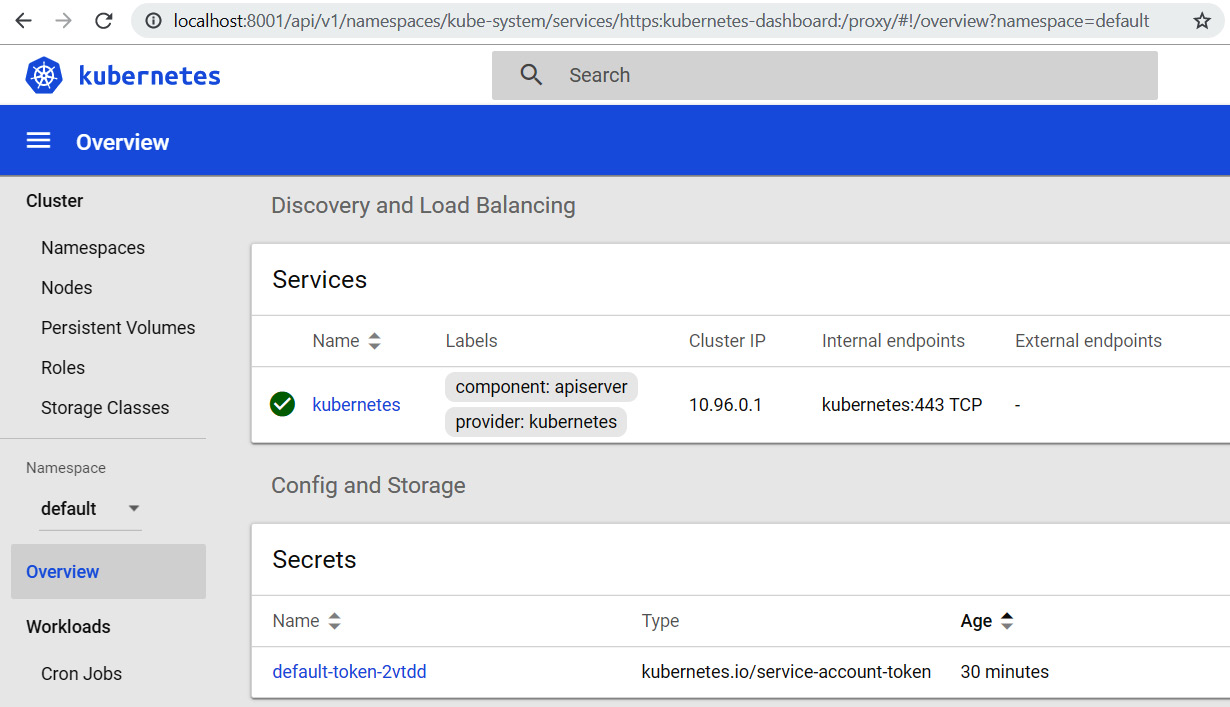
Figure 10.8 – Kubernetes dashboard resources list
We have just seen how to install a Kubernetes cluster on a local machine, and then we installed and configured the Kubernetes web dashboard in this cluster. We will now deploy our first application in the local Kubernetes cluster using YAML Ain't Markup Language (YAML) specification files and kubectl commands.
A first example of Kubernetes application deployment
After installing our Kubernetes cluster, we will deploy an application in it. First of all, it is important to know that when we deploy an application in Kubernetes, we create a new instance of the Docker container in a Kubernetes pod object, so we first need to have a Docker image that contains the application.
For our example, we will use the Docker image that contains a web application that we have pushed into Docker Hub in Chapter 9, Containerizing Your Application with Docker.
To deploy this instance of the Docker container, we will create a new k8sdeploy folder, and inside it, we will create a Kubernetes deployment YAML specification file (myapp-deployment.yml) with the following content:
---
apiVersion: apps/v1
kind: Deployment
metadata:
name: webapp
spec:
selector:
matchLabels:
app: webapp
replicas: 2
template:
metadata:
labels:
app: webapp
spec:
containers:
- name: demobookk8s
image: mikaelkrief/demobook:latest
ports:
- containerPort: 80
In this preceding code snippet, we describe our deployment in the following way:
- The apiVersion property is the version of api that should be used.
- In the Kind property, we indicate that the specification type is deployment.
- The replicas property indicates the number of pods that Kubernetes will create in the cluster; here, we choose two instances.
In this example, we chose two replicas, which can—at the very least—distribute the traffic load of the application (if there is a high volume of load, we can put in more replicas), while also ensuring the proper functioning of the application. Therefore, if one of the two pods has a problem, the other (which is an identical replica) will ensure the proper functioning of the application.
Then, in the containers section, we indicate the image (from Docker Hub) with name and tag. Finally, the ports property indicates the port that the container will use within the cluster.
Note
This source code is also available at https://github.com/PacktPublishing/Learning-DevOps-Second-Edition/blob/main/CHAP10/k8sdeploy/myapp-deployment.yml.
To deploy our application, we go to our Terminal and execute one of the essential kubectl commands (kubectl apply), as follows:
kubectl apply -f myapp-deployment.yml
The -f parameter corresponds to the YAML specification file.
This command applies the deployment that is described in the YAML specification file on the Kubernetes cluster.
Following the execution of this command, we will check the status of this deployment by displaying a list of pods in the cluster. To do this in the Terminal, we execute the kubectl get pods command, which returns a list of cluster pods. The following screenshot shows the execution of the deployment and displays the information in the pods, which we use to check the deployment:
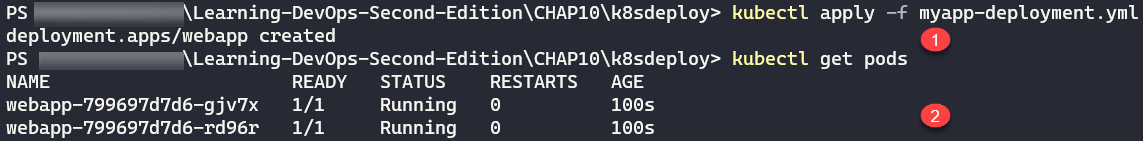
Figure 10.9 – kubectl apply command
What we can see in the preceding screenshot is that the second command displays our two pods, with the name (webapp) specified in the YAML file, followed by a unique identifier (UID), and that they are in a Running status.
We can also visualize the status of our cluster on the Kubernetes web dashboard, the webapp deployment with the Docker image that has been used, and the two pods that have been created. For more details, we can click on the different links of the elements.
Our application has been successfully deployed in our Kubernetes cluster but, for the moment, it is only accessible inside the cluster, and for it to be usable, we need to expose it outside the cluster.
In order to access the web application outside the cluster, we must add a service type and a NodePort category element to our cluster. To add this service type and NodePort element, in the same way as for deployment, we will create a second YAML file (myapp-service.yml) of the service specification in the same k8sdeploy directory, which has the following code:
---
apiVersion: v1
kind: Service
metadata:
name: webapp
labels:
app: webapp
spec:
type: NodePort
ports:
- port: 80
targetPort: 80
nodePort: 31000
selector:
app: webapp
In the preceding code snippet, we specify the kind, Service, as well as the type of service, NodePort.
Then, in the ports section, we specify the port translation: port 80, which is exposed internally, and port 31000, which is exposed externally to the cluster.
Note
The source code of this file is also available at https://github.com/PacktPublishing/Learning-DevOps-Second-Edition/blob/main/CHAP10/k8sdeploy/myapp-service.yml.
To create this service on the cluster, we execute the kubectl apply command, but this time with our myapp-service.yaml file as a parameter, as follows:
kubectl apply -f myapp-service.yml
The execution of the command creates the service within the cluster, and, to test our application, we open a web browser with the http://localhost:31000 URL, and our page is displayed as follows:

Figure 10.10 – Demo Kubernetes application
Our application is now deployed on a Kubernetes cluster, and it can be accessed from outside the cluster.
In this section, we have learned that the deployment of an application, as well as the creation of objects in Kubernetes, is achieved using specification files in YAML format and several kubectl command lines.
The next step is to use Helm packages to simplify the management of the YAML specification files.
Using Helm as a package manager
As previously discussed, all the actions that we carry out on the Kubernetes cluster are done via the kubectl tool and the YAML specification files.
In a company that deploys several microservice applications on a Kubernetes cluster, we often notice a large number of these YAML specification files, and this poses a maintenance problem. In order to solve this maintenance problem, we can use Helm, which is the package manager for Kubernetes.
Note
For more information on package managers, you can also read the Using a package manager section of Chapter 7, Continuous Integration and Continuous Delivery.
Helm is, therefore, a repository that will allow the sharing of packages called charts that contain ready-to-use Kubernetes specification file templates.
Note
To learn more about Helm and to access its documentation, visit https://helm.sh/.
Installing the Helm client
So, we'll see how to install Helm on our local Kubernetes cluster, and later, we'll go through the installation of an application with Helm.
Note
In the first edition of this book, we used a Helm version prior to 3.0, and we learned to install the Helm Tiller plugin. Since version 3.0+, the Tiller plugin doesn't need to be installed, so the Tiller installation guide is deleted in this second edition.
Since version 3, Helm is composed of only one binary: a client tool that allows us mainly to install packages of Kubernetes specification files on a target Kubernetes cluster, list the packages of a repository, and indicate the package(s) to be installed.
To install the Helm client, please refer to the installation documentation at https://helm.sh/docs/using_helm/#installing-the-helm-client, which details the installation procedure according to the different OSs.
In Windows, for example, we can install it via the Chocolatey package manager, with the execution of the following command:
choco install kubernetes-helm -y
To check its installation, execute the helm --help command, as shown in the following screenshot:
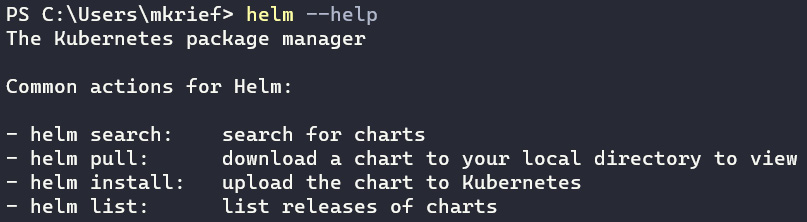
Figure 10.11 – helm --help command
The execution of the command tells us that the Helm is properly installed. Now, we will learn how to use a public Helm chart.
Using a public Helm chart from Artifact Hub
The packages contained in a Helm repository are called charts. Charts are composed of files that are templates of Kubernetes specification files for an application.
With charts, it's possible to deploy an application in Kubernetes without having to write any YAML specification files. So, to deploy an application, we will use its corresponding chart, and we will pass some configuration variables of this application.
Once Helm is installed, we will install a chart that is in the Helm public repository called Artifact Hub and available here: https://artifacthub.io/. But first, to display a list of public charts, we run the following command:
helm search hub
The hub parameter is the name of Artifact Hub.
To search for a specific package, we can run the helm search hub <package name> command, and if we want to search all wordpress packages (for example), we run the following command:
helm search hub wordpress
Here is an extract from the result, which includes a lot of charts:
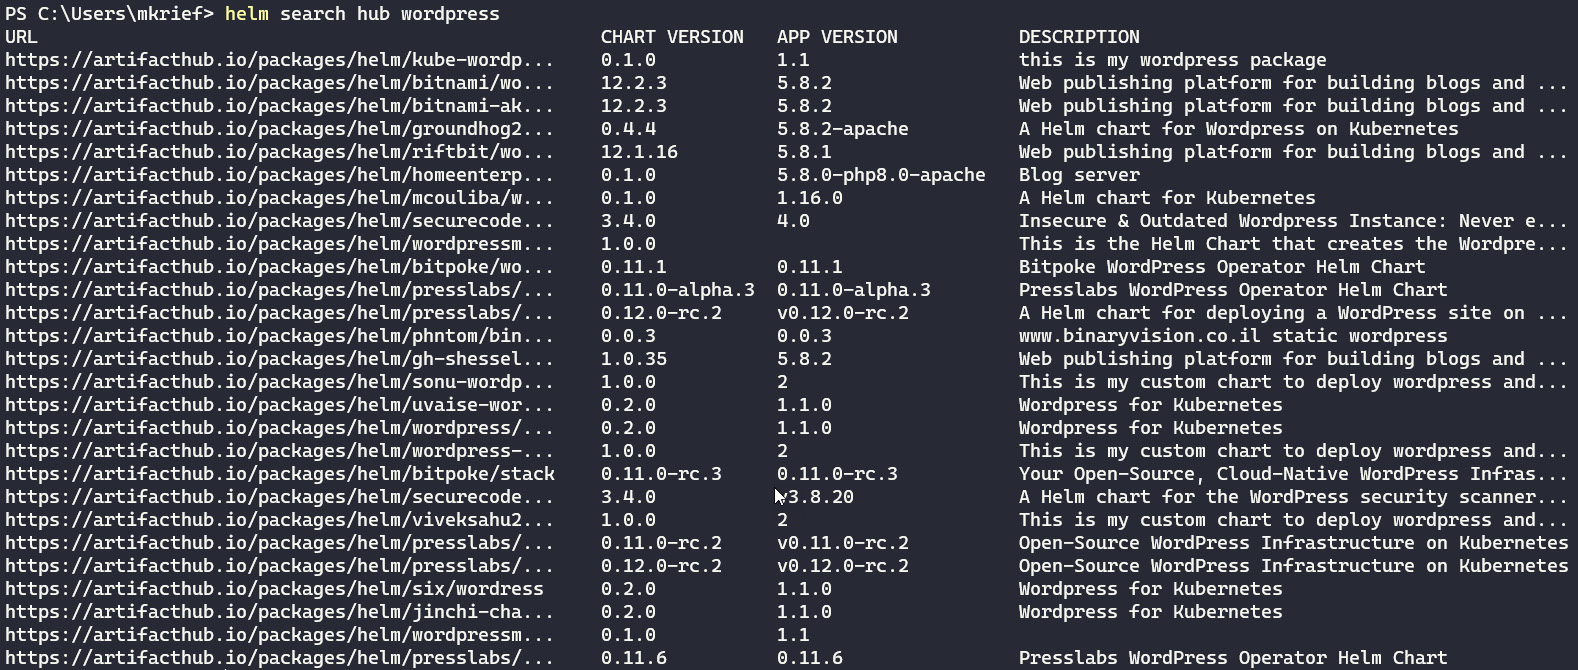
Figure 10.12 – Searching for Helm packages
For an easy way to find packages, go to the Artifact Hub site (https://artifacthub.io/) and search for the wordpress package, as shown in the following screenshot:
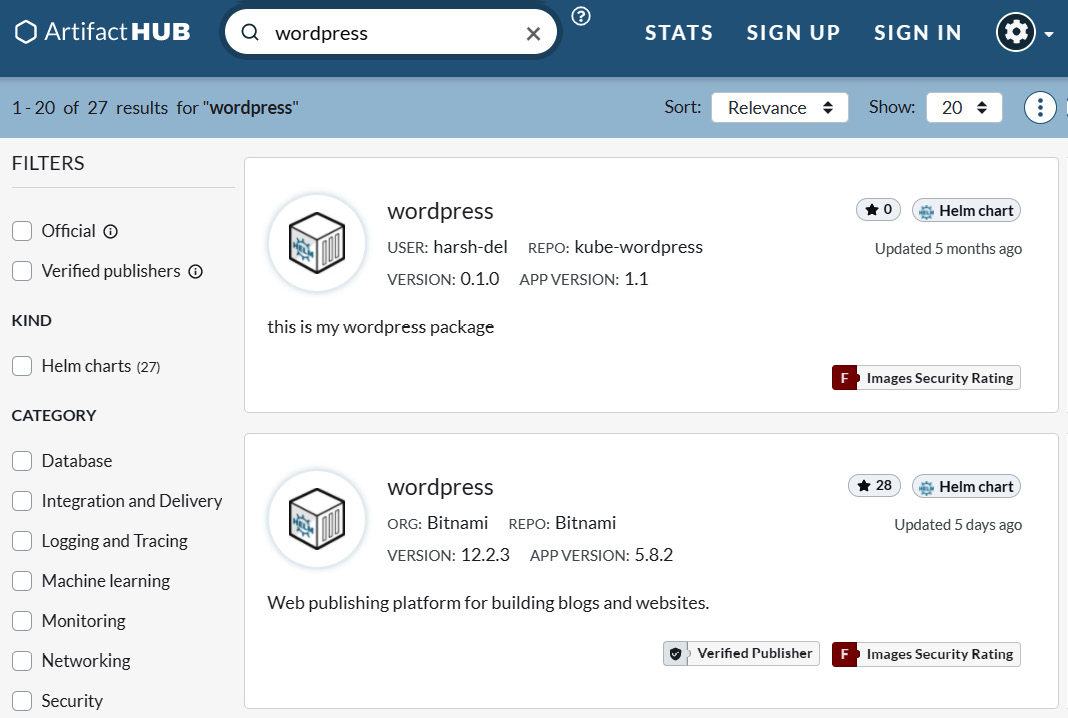
Figure 10.13 – Artifact Hub wordpress search
This page list all wordpress packages from all community publishers.
Then, click on the desired package to display details of the package, as illustrated in the following screenshot:

Figure 10.14 – Artifact Hub wordpress details
On this page, we can see the current version of the package and some technical package installation guidelines.
Note
It's also possible to create our private or corporate Helm repository with tools such as Nexus, Artifactory, or even ACR.
Let's now install an application with Helm.
To illustrate the use of Helm, we will deploy a WordPress application in our Kubernetes cluster using a Helm chart.
In order to do this, execute the following commands (mentioned here: https://artifacthub.io/packages/helm/bitnami/wordpress):
helm repo add bitnami https://charts.bitnami.com/bitnami
helm install wpdemo bitnami/wordpress
The first command, helm repo add, adds the index of the bitnami repository locally.Then, we use the helm install <release name> <package name> command to install the desired package on Kubernetes.
The following screenshot shows the execution of these two commands:
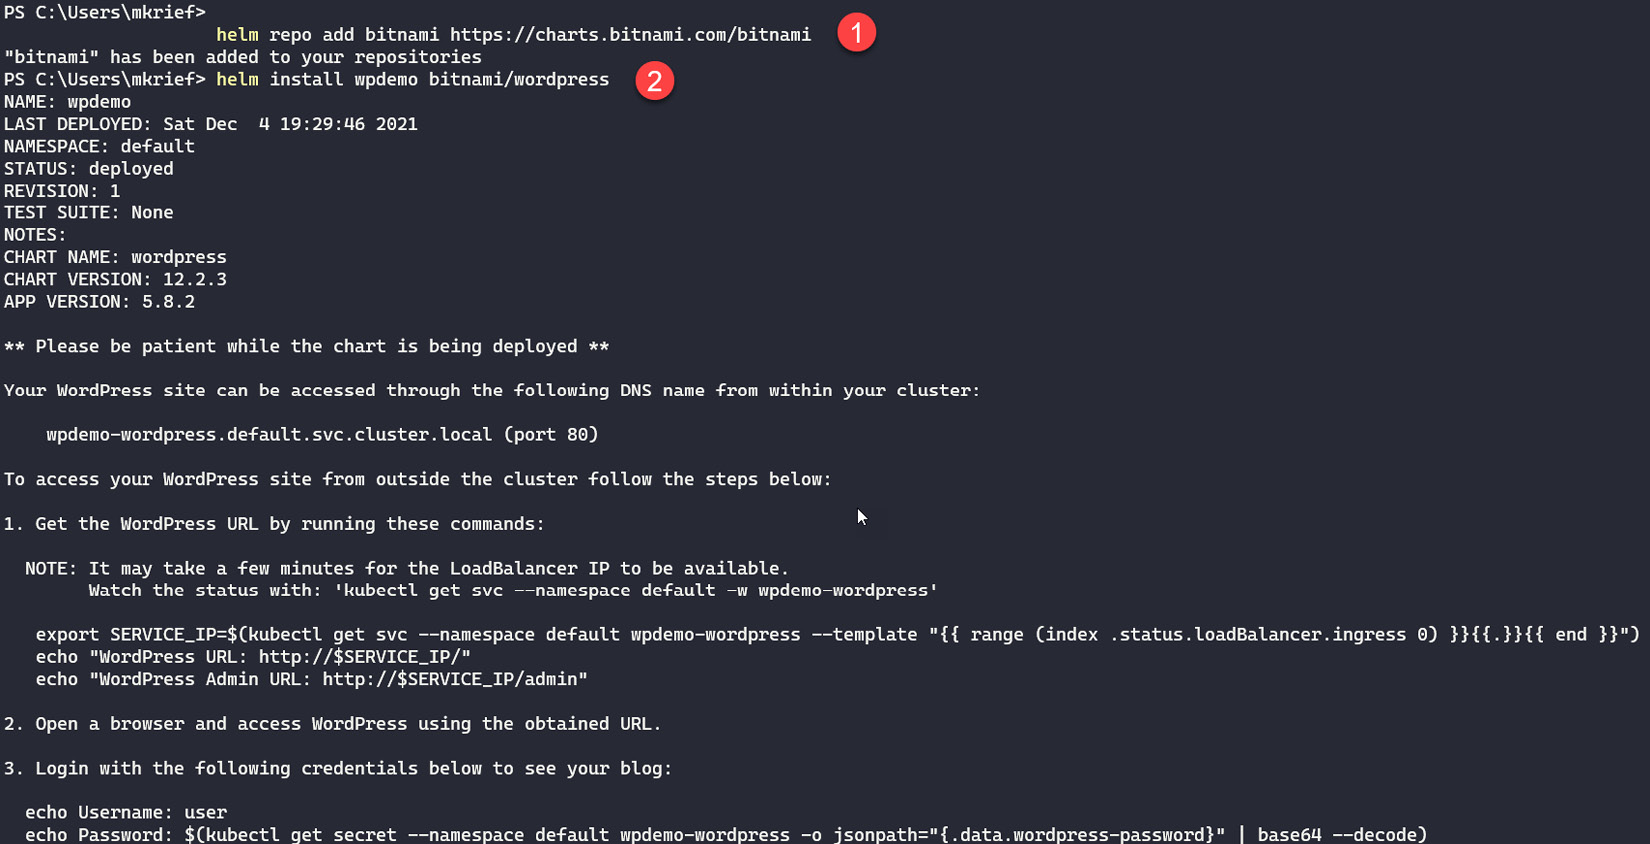
Figure 10.15 – Installing an application with Helm
With the execution of the preceding commands, Helm installs a WordPress instance called wpdemo and all of the Kubernetes components on the local Kubernetes cluster.
We can also display a list of Helm packages that are installed on the cluster by executing the following command:
helm ls
The following screenshot shows the execution of this command:

Figure 10.16 – Helm list of installed packages
And if we want to remove a package and all of its components (for example, to remove the application installed with this package), we execute the helm delete command, as follows:
helm delete wpdemo
The following screenshot shows the execution of this command:
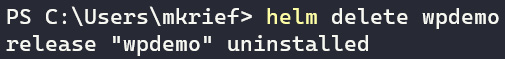
Figure 10.17 – helm delete command
We have discussed the installation of a Helm chart from Artifact Hub to a Kubernetes cluster. In the next section, we will learn how to create a custom Helm chart package.
Creating a custom Helm chart
We have just learned how to use and install a public Helm chart from Artifact Hub, but in companies, we often have some custom applications that require us to create custom Helm charts.
Here are the basic steps to create a custom Helm chart:
- Inside the folder that will contain the Helm chart file template, run the helm create <chart name> command, as follows:
helm create demobook
The execution of this command will create a directory structure and basic template files for our chart, as shown in the following screenshot:
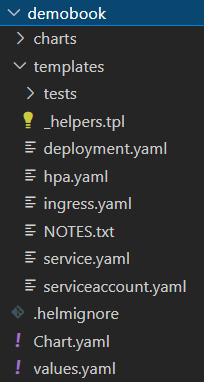
Figure 10.18 – Helm chart structure folder
- Then, customize the chart templates and values by following the technical documentation here: https://helm.sh/docs/chart_template_guide/.
- Finally, we publish the chart in our Kubernetes cluster by running the helm install <chart name> <chart path root> command, as follows:
helm install demochart ./demobook
The following screenshot shows the execution of the preceding command:
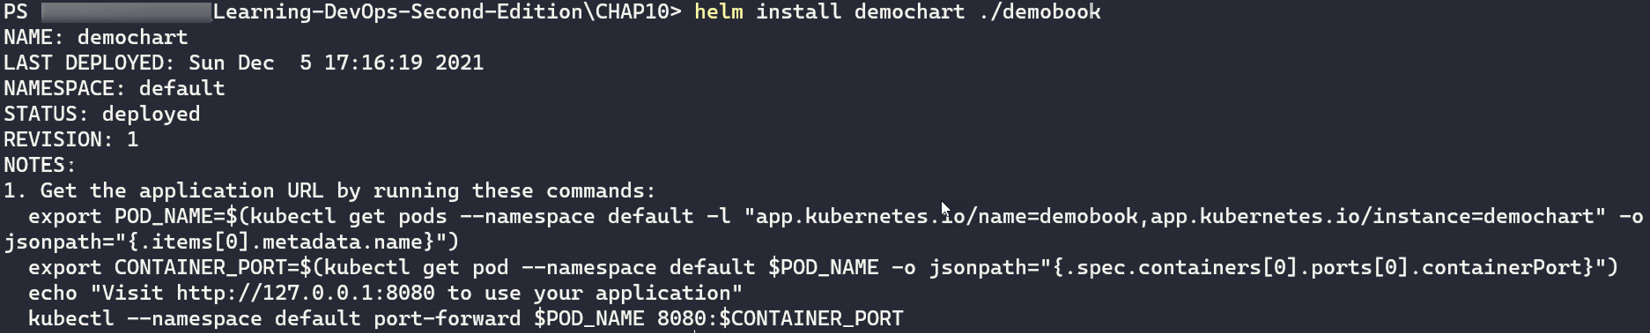
Figure 10.19 – helm install command
To check the package installation by Helm, run the kubectl get pods command to display a list of created pods.
The following screenshot shows a list of created pods:

Figure 10.20 – kubectl get pods
And run the helm ls command to display a list of installed Helm charts, as shown in the following screenshot:

Figure 10.21 – Helm package list
We can see in the preceding screenshot the demochart Helm chart that is installed on the Kubernetes cluster.
In this section, we have seen an overview of the installation and use of Helm, which is the package manager for Kubernetes. Then, we learned about the installation of Helm charts from Artifact Hub. Finally, we learned how to create a custom Helm chart and install this chart on a Kubernetes cluster.
In the next section, we will learn how to publish a custom Helm chart to a private Helm repository—that is, ACR.
Publishing a Helm chart in a private registry (ACR)
In the previous section, we discussed a public Helm repository called Artifact Hub, which is great for public (or community) applications or tools. But for company applications, it's better and recommended to have a private Helm registry.
In the marketplace, there are a lot of private registries such as Nexus or Artifactory, and this documentation explains how to create a private Helm repository: https://helm.sh/docs/topics/chart_repository/.
In this section, we will discuss how to use a private Helm repository (that is, ACR, which we have already learned about in Chapter 9, Containerizing Your Application with Docker). So, to start our lab, we consider that we have already created an ACR named demobookacr on Azure.
Note
If you have not already created an ACR, follow the documentation here:
https://docs.microsoft.com/en-us/azure/container-registry/container-registry-get-started-azure-cli
To publish a custom Helm chart in ACR, follow these steps:
- The first step is to create a package in tar gz format of the chart by running the helm package command inside the folder where the chart.yaml file of the chart is located.
Run the following command with "." as a parameter to indicate that the chart.yaml file is in the current folder:
helm package .
The following screenshot shows the execution of this command:

Figure 10.22 – Creating a Helm package
The Helm chart package is created with the name demobook-0.1.0.tgz.
- Then, authenticate to ACR with the following PowerShell script:
$env:HELM_EXPERIMENTAL_OCI=1
$USER_NAME="00000000-0000-0000-0000-000000000000"
$ACR_NAME="demobookacr"
az login
$PASSWORD=$(az acr login --name $ACR_NAME --expose-token --output tsv --query accessToken)
helm registry login "$ACR_NAME.azurecr.io" --username $USER_NAME --password "$PASSWORD"
The preceding script performs these operations:
- Sets the HELM_EXPERIMENTAL_OCI environment variable to 1. For more details about environment variables, read this documentation: https://helm.sh/docs/topics/registries/.
- Sets the USER_NAME variable with a 000 fake value.
- Sets the ACR_NAME variable with the name of the ACR.
- Sets the PASSWORD variable dynamically by using the az cli command.
- Uses the Helm registry login to authenticate to the ACR registry.
- Finally, we push the Helm chart into the ACR registry with the following command:
helm push .demobook-0.1.0.tgz oci://$ACR_NAME.azurecr.io/helm
After the execution of this command, the pushed Helm chart will be in the helm/demobook repository on the ACR.
- We can check that the Helm chart is correctly pushed to the ACR by running the following command:
az acr repository show --name $ACR_NAME --repository helm/demobook
The execution of this command displays the details of the helm/demobook Helm chart.
In the Azure portal, we can see the Helm repository, the Helm chart, and the tag, as shown in the following screenshot:
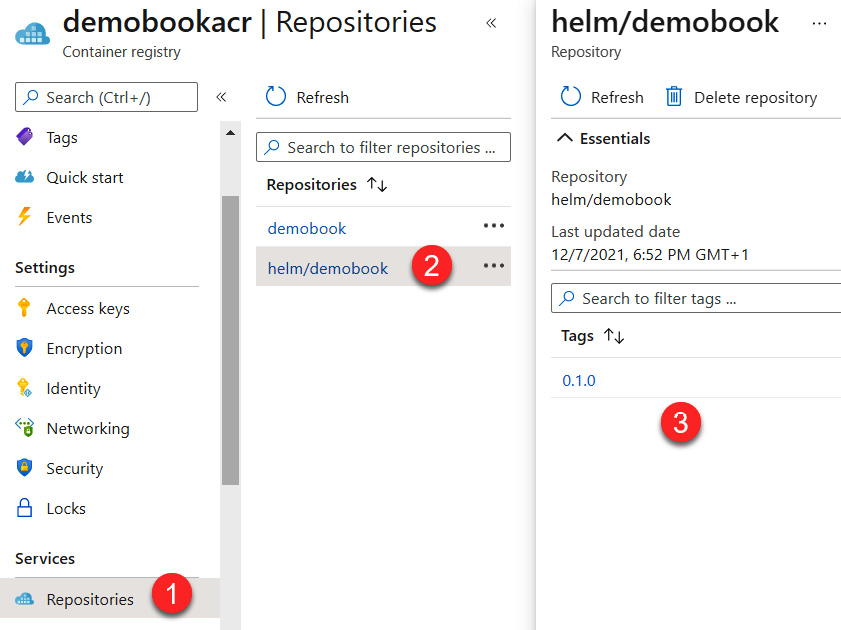
Figure 10.23 – ACR Helm repository
We just learned how to build and push a custom Helm chart into ACR using Helm command lines and az cli commands.
Now, in the next section, let's look at an example of a managed Kubernetes service that is hosted in Azure, called AKS.
Using AKS
A production Kubernetes cluster can often be complex to install and configure. This type of installation requires the availability of servers, human resources who have the requisite skills regarding the installation and management of a Kubernetes cluster, and—especially—the implementation of an enhanced security policy to protect the applications.
To overcome these problems, cloud providers offer managed Kubernetes cluster services. This is the case with Amazon with Elastic Kubernetes Service (EKS), Google with Google Kubernetes Engine (GKE), and finally, Azure with AKS. In this section, I propose an overview of AKS, while also highlighting the advantages of a managed Kubernetes cluster.
AKS is, therefore, an Azure service that allows us to create and manage a real Kubernetes cluster as a managed service.
The advantage of this managed Kubernetes cluster is that we don't have to worry about its hardware installation and the management of the master part is done entirely by Azure when the nodes are installed on virtual machines (VMs).
The use of this service is free; what is charged is the cost of the VMs on which the nodes are installed.
Note
To learn more about the benefits offered by AKS, you can read the documentation at https://docs.microsoft.com/en-us/azure/aks/intro-kubernetes.
Let's now look at how to create an AKS service.
Creating an AKS service
The creation of an AKS cluster in Azure can be done in three different ways, as outlined here:
- Manually, via the Azure portal: The standard way to create an AKS service is to do so via the Azure portal, by creating a Kubernetes service, and then entering its basic Azure properties—that is, the type and number of nodes desired, as shown in the following screenshot:
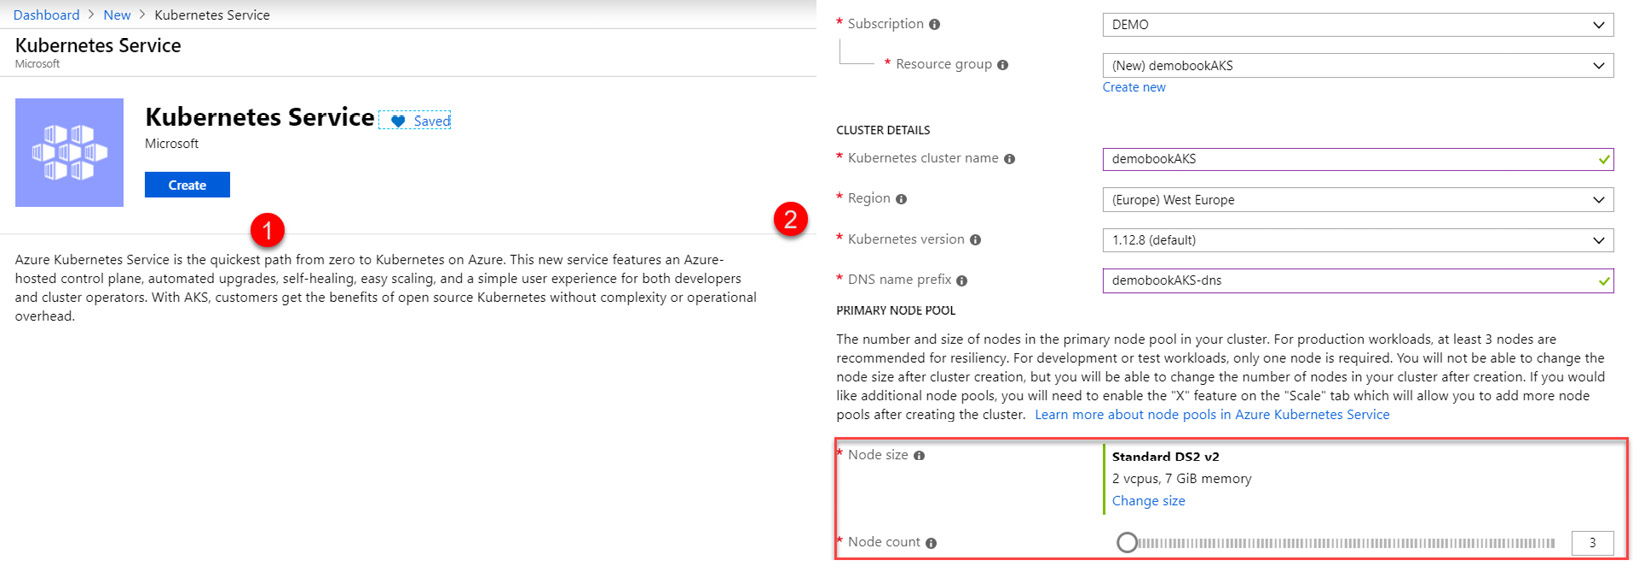
Figure 10.24 – AKS creation via the Azure portal
- Creation via an az cli script: You can also use an az cli script to automate the creation of the AKS cluster. The script is shown here:
#Create the Resource group
az group create --name Rg-AKS --location westeurope
#Create the AKS resource
az aks create --resource-group Rg-AKS --name demoBookAKS --node-count 2 --generate-ssh-keys --enable-addons monitoring
The node-count property indicates the number of nodes, and the enable-addons property enables us to monitor the AKS service.
- Creation with Terraform: It is also possible to create an AKS service with Terraform. The complete Terraform script is available in the Azure documentation at https://docs.microsoft.com/en-us/azure/terraform/terraform-create-k8s-cluster-with-tf-and-aks , and to learn more about using Terraform, you can read Chapter 2, Provisioning Cloud Infrastructure with Terraform.
Now that the AKS cluster has been created, we will be able to configure the kubeconfig file in order to connect to this AKS cluster.
Configuring the kubeconfig file for AKS
To configure the kubeconfig file used by kubectl for connecting to the AKS service, we will use the az cli tool by executing the following commands in a Terminal:
az login
#If you have several Azure subscriptions
az account set --subscription <subscription Id>
az aks get-credentials --resource-group Rg-AKS --name demoBookAKS
This last command takes the resource group as the parameter, and as the name of the created AKS cluster. The role of this command is to automatically create a .kubeconfig file and with this file configure kubectl for connection to the AKS cluster, as shown in the following screenshot:
Figure 10.25 – AKS getting credentials via az cli
To test the connection to AKS, we can execute the following command, kubectl get nodes, which displays the number of nodes that are configured when creating an AKS cluster, as shown in the following screenshot:
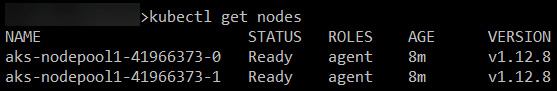
Figure 10.26 – kubectl get nodes list
All of the operations that we have seen in the A first example of Kubernetes application deployment section of this chapter are identical, whether deploying an application with AKS or with kubectl.
After having seen the steps that are taken to create an AKS service in Azure, we will now provide an overview of its advantages.
Advantages of AKS
AKS is a Kubernetes service that is managed in Azure. This has the advantage of being integrated with Azure, as well as some other advantages listed here:
- Ready to use: In AKS, the Kubernetes web dashboard is natively installed, and the documentation at https://docs.microsoft.com/en-us/azure/aks/kubernetes-dashboard explains how to access it.
- Integrated monitoring services: AKS also has all of Azure's integrated monitoring services, including container monitoring, cluster performance management, and log management, as shown in the following screenshot:
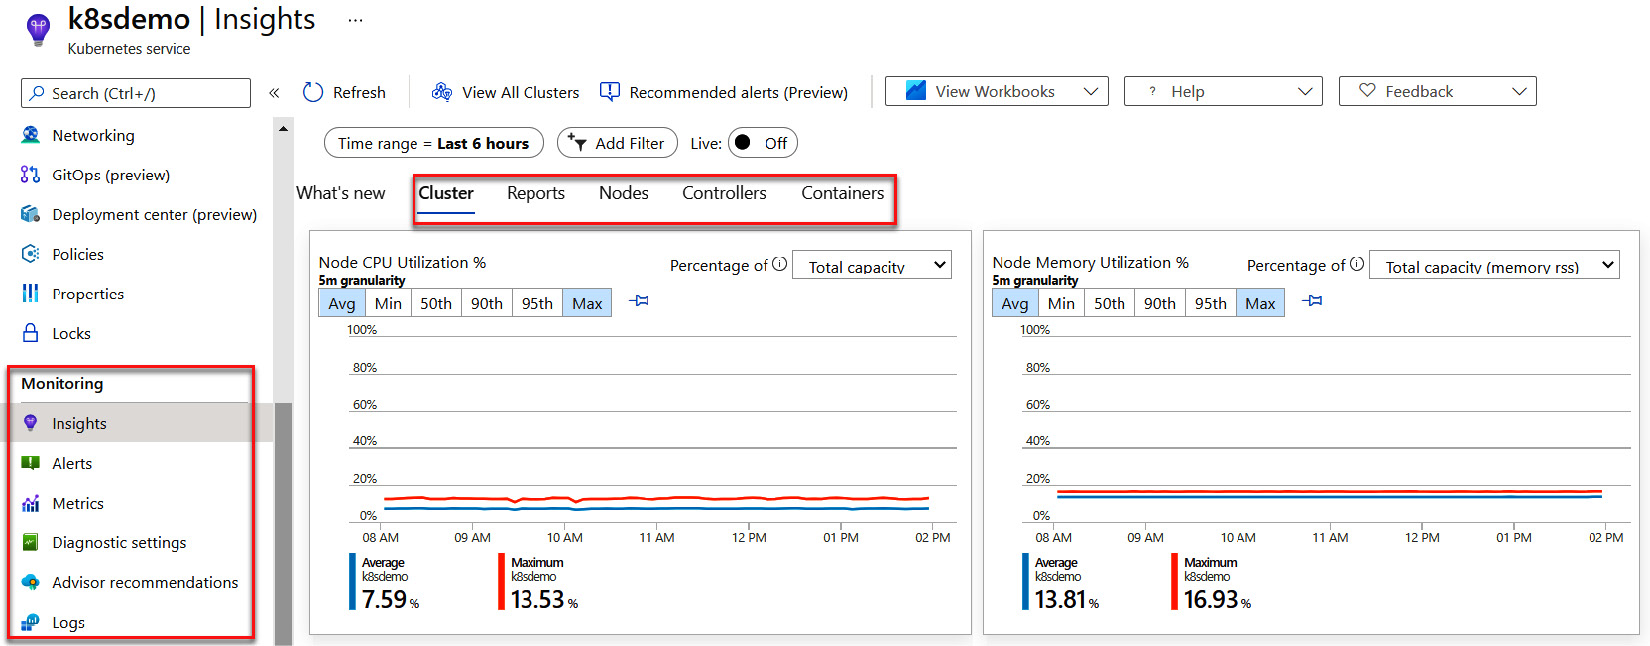
Figure 10.27 – AKS monitoring
- Very easy to scale: AKS allows the quick and direct scaling of the number of nodes of a cluster via the portal, or via scripts.
As we can see in the following screenshot, we choose the number of nodes that we want in the Azure portal, and the change is effective immediately:
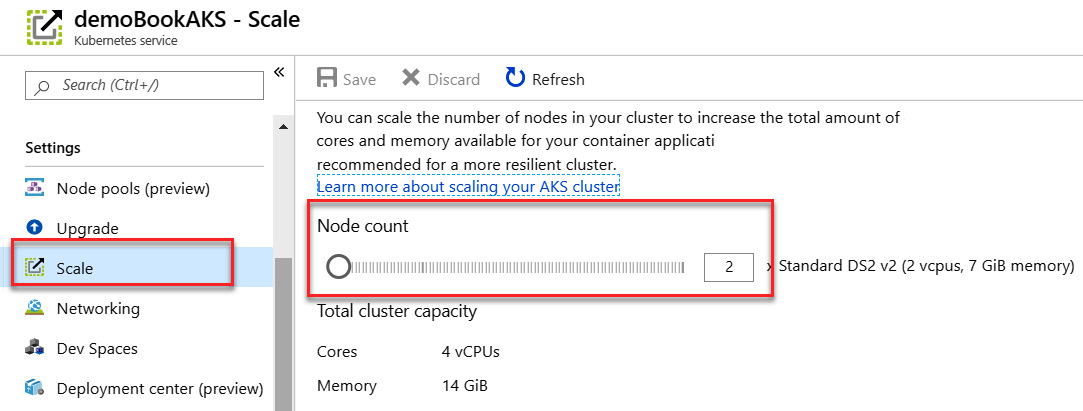
Figure 10.28 – AKS scaling
If we have an Azure subscription and we want to use Kubernetes, it's intuitive and quick to install. AKS has a number of advantages, such as integrated monitoring and scaling in the Azure portal. Using the kubectl tool does not require any changes compared to a local Kubernetes instance.
In this section, we have discussed AKS, which is a managed Kubernetes service in Azure. Then, we created an AKS instance and configured the kubeconfig file in order to connect to this AKS instance. Finally, we listed its advantages, which are mainly integrated monitoring and fast scalability.
In the next section, we will see some resources for how to deploy an application in Kubernetes by using a CI/CD pipeline with Azure Pipelines.
Creating a CI/CD pipeline for Kubernetes with Azure Pipelines
So far, we have seen how to use kubectl to deploy a containerized application in a local Kubernetes cluster or in a remote cluster with AKS.
In the first edition of this book, I explained how to build a complete pipeline in Azure DevOps, from the creation of a new Docker image pushed into Docker Hub to its deployment in an AKS cluster.
Since this first edition, many features have been improved in the different CI/CD tools to deploy in Kubernetes.
That's why in this second edition I won't explain it in detail anymore, but I'll provide you with different resources that are useful for my daily work, as follows:
- The first resource is a great complete video that explains all the details for deploying an application in AKS with Azure DevOps, found at the following link:
https://www.youtube.com/watch?v=K4uNl6JA7g8
- On the same subject, there is a great lab on Azure DevOps at the following link:
https://www.azuredevopslabs.com/labs/vstsextend/kubernetes/
- To create an Azure DevOps pipeline in YAML format for deploying to Kubernetes, read the official documentation here:
- Then, the following documentation also proposes a tutorial for use with Jenkins and Azure DevOps to deploy an application to Kubernetes:
In this section, we have reported some resources for an end-to-end (E2E) DevOps CI/CD pipeline in order to deploy an application in a Kubernetes cluster (AKS for our example) with Azure Pipelines.
In the next section, we will learn different ways to monitor applications and metrics on Kubernetes and find out about the tools we can use to do this.
Monitoring applications and metrics in Kubernetes
When we deploy an application in Kubernetes, it's very important—and I consider it a requirement—to have a monitoring strategy for checking and debugging the life cycle of these applications and checking the central processing unit (CPU) and random-access memory (RAM) metrics.
We will now discuss different ways to debug and monitor your applications in Kubernetes.
Let's start with the basic way, which is the use of the kubectl command line.
Using the kubectl command line
To debug applications with the kubectl command line, run the commands detailed next:
- To display the state of Kubernetes resources, run the following command:
kubectl get pods,svc
The output of the preceding command is shown in the following screenshot:

Figure 10.29 – kubectl getting resources
With this command, we can see if pods are running and find out about services' statuses.
- To display application logs, run the kubectl logs pod/<pod name> command, as illustrated in the following screenshot:
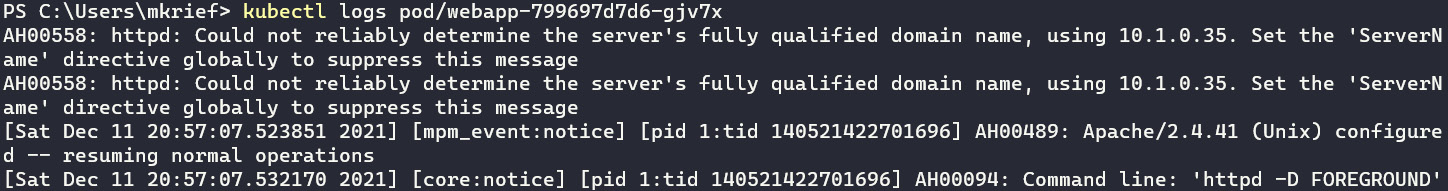
Figure 10.30 – kubectl getting pod logs
This command displays the output of the application logs.
For more details on the use of kubectl to debug applications, read the documentation here:
https://kubernetes.io/docs/tasks/debug-application-cluster/debug-running-pod/
With the kubectl command, we can automate the debugging of applications, but it's necessary to learn all command-line options.
Next, we will discuss debugging applications with some tools.
Using the web dashboard
As already explained in the first section of this chapter, Installing Kubernetes, we can use the basic dashboard to display in the web user interface (UI) details of all resources deployed in Kubernetes.
For cloud-managed Kubernetes services such as AKS for Azure, EKS for Amazon Web Services (AWS), and GKE for Google Cloud Platform (GCP), we can use integrated and managed dashboards. For example, for AKS in the Azure portal, we can easily see all logs from the pods. Here's a sample of pod logs in the Azure portal:
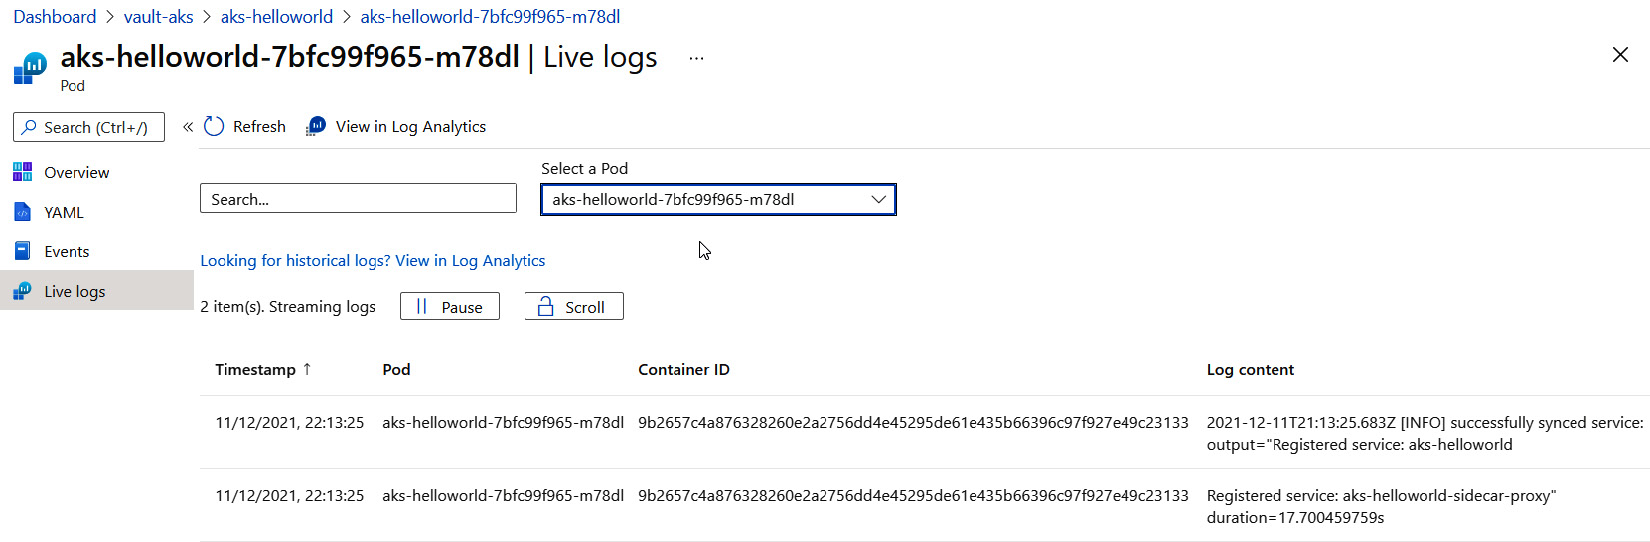
Figure 10.31 – AKS live logs
For more details about debugging on AKS, read the documentation here:
https://docs.microsoft.com/en-us/azure/architecture/microservices/logging-monitoring
We can also use tier tools such as Octant or Lens.
Using tier tools
There are lots of tools or solutions to monitor and display all resources deployed in a Kubernetes cluster. Among them are two free tools that I often use: Octant and Lens.
Octant
Octant is a VMware community project in a web application launched locally or in a Docker container for visualizing Kubernetes resources and application logs.
The documentation of Octant is available here:
The source code is available here:
https://github.com/vmware-tanzu/octant/blob/master/README.md
Lens
Lens is also a free tool that is installed by the client binary. For me, Lens is the best tool for visualizing and debugging applications. The Lens documentation is available here: https://k8slens.dev/.
You can see an overview of the Lens dashboard in the following screenshot:
Figure 10.32 – Lens dashboard
After discussing tools to debug applications, we will see how to display Kubernetes metrics.
Monitoring Kubernetes metrics
All tools just described are great for debugging Kubernetes resources and applications hosted in Kubernetes. But that is not enough—in terms of monitoring, we need to also monitor metrics such as the CPU and RAM used by applications.
With the following basic kubectl command line, we can display the CPU and RAM used by nodes and pods:

Figure 10.33 – kubectl getting metrics
Among the best-known solutions are Prometheus and Grafana, which monitor the metrics of Kubernetes and provide a lot of dashboard models.
For more details, you can read this article, which explains Kubernetes monitoring with Prometheus and Grafana:
https://sysdig.com/blog/kubernetes-monitoring-prometheus/
In this section, we discussed some kubectl commands, tools, or solutions such as dashboards, Octant, and Lens to debug applications on Kubernetes.
Summary
In this chapter, we have seen an advanced use of containers with the use of Kubernetes, which is a container manager.
We discussed the different options for installing a small cluster on a local machine using Docker Desktop. Then, using the YAML specification file and the kubectl command, we realized the deployment of a Docker image in our Kubernetes cluster in order to run a web application.
We installed and configured Helm, which is the package manager of Kubernetes. Then, we applied it in practice with an example of a chart deployment in Kubernetes.
We also had an overview of AKS, which is a Kubernetes service managed by Azure, looking at its creation and configuration and some resources links that explain how to deploy applications with CI/CD pipelines with Azure DevOps.
Finally, we finished this chapter with a short list of Kubernetes monitoring tools such as the kubectl command line, Lens, Prometheus, and Grafana for debugging Kubernetes metrics.
The next chapter begins a new part of this book, which deals with application testing, and we will start with application programming interface (API) testing with Postman.
Questions
- What is the role of Kubernetes?
- Where is the configuration of the objects that are written in Kubernetes?
- What is the name of the Kubernetes client tool?
- Which command allows us to apply a deployment in Kubernetes?
- What is Helm?
- What is AKS?
Further reading
If you want to know more about Kubernetes, take a look at the following resources:
- The DevOps 2.3 Toolkit: https://www.packtpub.com/business/devops-23-toolkit
- Hands-On Kubernetes on Azure: https://www.packtpub.com/virtualization-and-cloud/hands-kubernetes-azure
- Hands-On Kubernetes on Azure - Second Edition: https://www.packtpub.com/product/hands-on-kubernetes-on-azure-second-edition/9781800209671
- Mastering Kubernetes - Third Edition: https://www.packtpub.com/product/mastering-kubernetes-third-edition/9781839211256