 Glance logging and configuration
by Tony Campbell, Egle Sigler, Cody Bunch, Kevin Jackson, Sunil Sarat, Alok Shrivas
OpenStack: Building a Cloud Environment
Glance logging and configuration
by Tony Campbell, Egle Sigler, Cody Bunch, Kevin Jackson, Sunil Sarat, Alok Shrivas
OpenStack: Building a Cloud Environment
- OpenStack: Building a Cloud Environment
- Table of Contents
- OpenStack: Building a Cloud Environment
- OpenStack: Building a Cloud Environment
- Credits
- Preface
- 1. Module 1
- 1. An Introduction to OpenStack
- 2. Authentication and Authorization Using Keystone
- Identity concepts in Keystone
- Architecture and subsystems
- Installing common components
- Installing Keystone
- Verifying the installation
- Troubleshooting the installation and configuration
- Summary
- 3. Storing and Retrieving Data and Images using Glance, Cinder, and Swift
- Introducing storage services
- Working with Glance
- Working with Cinder
- Working with Swift
- Troubleshooting steps
- Summary
- 4. Building Your Cloud Fabric Controller Using Nova
- 5. Technology-Agnostic Network Abstraction Using Neutron
- The software-defined network paradigm
- Neutron
- Installing Neutron
- Troubleshooting Neutron
- Summary
- 6. Building Your Portal in the Cloud
- 7. Your OpenStack Cloud in Action
- 8. Taking Your Cloud to the Next Level
- Working with Heat
- Ceilometer
- Installing Ceilometer
- Installing Ceilometer on the compute node
- Installing Ceilometer on the storage node
- Testing the installation
- Billing and usage reporting
- Summary
- 9. Looking Ahead
- A. New Releases
- 2. Module 2
- 1. Keystone – OpenStack Identity Service
- Introduction
- Installing the OpenStack Identity Service
- Configuring OpenStack Identity for SSL communication
- Creating tenants in Keystone
- Configuring roles in Keystone
- Adding users to Keystone
- Defining service endpoints
- Creating the service tenant and service users
- Configuring OpenStack Identity for LDAP Integration
- 2. Glance – OpenStack Image Service
- Introduction
- Installing OpenStack Image Service
- Configuring OpenStack Image Service with OpenStack Identity Service
- Configuring OpenStack Image Service with OpenStack Object Storage
- Managing images with OpenStack Image Service
- Registering a remotely stored image
- Sharing images among tenants
- Viewing shared images
- Using image metadata
- Migrating a VMware image
- Creating an OpenStack image
- 3. Neutron – OpenStack Networking
- Introduction
- Installing Neutron and Open vSwitch on a dedicated network node
- Configuring Neutron and Open vSwitch
- Installing and configuring the Neutron API service
- Creating a tenant Neutron network
- Deleting a Neutron network
- Creating an external floating IP Neutron network
- Using Neutron networks for different purposes
- Configuring Distributed Virtual Routers
- Using Distributed Virtual Routers
- 4. Nova – OpenStack Compute
- Introduction
- Installing OpenStack Compute controller services
- Installing OpenStack Compute packages
- Configuring database services
- Configuring OpenStack Compute
- Configuring OpenStack Compute with OpenStack Identity Service
- Stopping and starting nova services
- Installation of command-line tools on Ubuntu
- Using the command-line tools with HTTPS
- Checking OpenStack Compute services
- Using OpenStack Compute
- Managing security groups
- Creating and managing key pairs
- Launching our first cloud instance
- Fixing a broken instance deployment
- Terminating your instances
- Using live migration
- Working with nova-schedulers
- Creating flavors
- Defining host aggregates
- Launching instances in specific Availability Zones
- Launching instances on specific Compute hosts
- Removing Nova nodes from a cluster
- 5. Swift – OpenStack Object Storage
- Introduction
- Configuring Swift services and users in Keystone
- Installing OpenStack Object Storage services – proxy server
- Configuring OpenStack Object Storage – proxy server
- Installing OpenStack Object Storage services – storage nodes
- Configuring physical storage for use with Swift
- Configuring Object Storage replication
- Configuring OpenStack Object Storage – storage services
- Making the Object Storage rings
- Stopping and starting OpenStack Object Storage
- Setting up SSL access
- 6. Using OpenStack Object Storage
- 7. Administering OpenStack Object Storage
- 8. Cinder – OpenStack Block Storage
- 9. More OpenStack
- Introduction
- Using cloud-init to run post-installation commands
- Using cloud-config to run the post-installation configuration
- Installing OpenStack Telemetry
- Using OpenStack Telemetry to interrogate usage statistics
- Installing Neutron LBaaS
- Using Neutron LBaaS
- Configuring Neutron FWaaS
- Using Neutron FWaaS
- Installing the Heat OpenStack Orchestration service
- Using Heat to spin up instances
- 10. Using the OpenStack Dashboard
- Introduction
- Installing OpenStack Dashboard
- Using OpenStack Dashboard for key management
- Using OpenStack Dashboard to manage Neutron networks
- Using OpenStack Dashboard for security group management
- Using OpenStack Dashboard to launch instances
- Using OpenStack Dashboard to terminate instances
- Using OpenStack Dashboard to connect to instances using a VNC
- Using OpenStack Dashboard to add new tenants – projects
- Using OpenStack Dashboard for user management
- Using OpenStack Dashboard with LBaaS
- Using OpenStack Dashboard with OpenStack Orchestration
- 11. Production OpenStack
- Introduction
- Installing the MariaDB Galera cluster
- Configuring HA Proxy for the MariaDB Galera cluster
- Configuring HA Proxy for high availability
- Installing and configuring Pacemaker with Corosync
- Configuring OpenStack services with Pacemaker and Corosync
- Bonding network interfaces for redundancy
- Automating OpenStack installations using Ansible – host configuration
- Automating OpenStack installations using Ansible – Playbook configuration
- Automating OpenStack installations using Ansible – running Playbooks
- 1. Keystone – OpenStack Identity Service
- 3. Module 3
- 1. The Troubleshooting Toolkit
- 2. Troubleshooting OpenStack Identity
- 3. Troubleshooting the OpenStack Image Service
- 4. Troubleshooting OpenStack Networking
- 5. Troubleshooting OpenStack Compute
- 6. Troubleshooting OpenStack Block Storage
- 7. Troubleshooting OpenStack Object Storage
- 8. Troubleshooting the OpenStack the Orchestration Service
- 9. Troubleshooting the OpenStack Telemetry Service
- 10. OpenStack Performance, Availability, and Reliability
- A. Bibliography
- Index
If, after working your way through each of the preceding sections, you continue to have trouble with Glance, here are a few more elements you should check. The Glance log files will often contain clues that can assist with troubleshooting. You can determine the location of the Glance log files by checking the value of the log_file or log_dir setting in the Glance configuration file. Typically, the log files for Glance will be located in the /var/log/glance/ directory. In this directory, you should find several log files including these:
api.logregistry.log
The api.log file will likely contain a bulk of clues that you need to troubleshoot Glance. It's also worth reminding you that Glance leverages Keystone for authentication. Therefore, in addition to the Glance logs, you will want to keep an eye on the Keystone logs. Similar to the Glance logs, the Keystone logs are typically located at /var/log/keystone. Refer to Chapter 2, Troubleshooting OpenStack Identity, for more details.
When troubleshooting OpenStack, it is helpful to increase the logging level so that more information is printed on the logs. This additional information can help provide more insight into how the system is operating and may help you isolate the source of problems. To turn on debug logging for Glance, you need to modify /etc/glance/glance-api.conf. In this configuration file, there is a setting named debug and is usually located under the From oslo.log section. To turn on debugging, simply set debug = true.
When troubleshooting Glance, it makes sense to start by looking in the Glance logs. However, remember that Glance is interconnected with other OpenStack projects. This means that the root of the problem I am troubleshooting may not be in Glance at all. Therefore, I recommend that you look for log files that have been recently modified. One way to accomplish this is using the find command to list log files that have been modified in the last 5 minutes. For example, you can run the following command from the /var/log directory to do so:
find . -iname "*.log" -mmin -1 -printf '%T+ %p
' | sort -r
An example of what the output will look like is given in the following command:
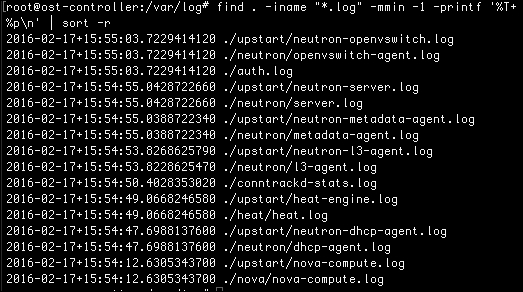
Using this command will help you see which log files you may want to investigate for clues.
Again, when troubleshooting Glance, we should start with the Glance log files and then potentially investigate some of the other log files returned from your find command. Once you are ready to start searching through your log files, you can leverage your standard Linux tools to look for useful information. One of the first tools I pick up is the tail command. I typically begin by tailing the related log files. For example, when trying to fix a Glance issue, I will tail glance-api.log:
tail -f /var/log/glance/api.log
Another useful tool is grep. I know grep is often seen as a solution and a problem at the same time, but I find it useful when trying to cut through the noise of the OpenStack logs and it also useful to find the useful signals that will assist with troubleshooting. For example, you can grep the log files for the words critical, error, warning, and failure:
grep -irE 'critical|error|warning|failure' /var/log/glance/api.log
Searching the log files this way can help you quickly isolate and focus on the log lines that provide key information for troubleshooting.
-
No Comment