
Chapter 9. <canvas>
Introduction
One of the most exciting additions to web pages to be standardized by HTML5
is the canvas element:
<canvas id="mycanvas"></canvas>
This simple element allows users to draw graphics such as lines, circles, and fills directly into a rectangle-shaped block element that appears on the web page.
There are numerous features associated with the canvas element. For example, in addition to drawing images manually,
browsers can take raw image data from an external image file and “draw” it onto the
canvas element.
You can also erase and redraw all or a portion of the canvas image. The ability to edit canvas images
lends itself to the creation of animations, where you appear to move
elements around by drawing and redrawing them in varying positions.
In addition, canvas elements can
have transparency, which means they can be layered or stacked on top of
each other to create more sophisticated graphical images/effects. There
are also a number of transformations and effects that you can apply to
your canvas drawings. In essence, a
canvas image is a dynamic image, unlike
a static PNG or JPEG file.
In much the same way that you might draw an image using a graphics
program like Adobe Photoshop, save it to a file, and load it into a web
page, with canvas you can automate the
drawing commands through code and immediately see the results on the page,
without the need for loading an external file.
This capability allows you to do many sophisticated things that were once difficult or impossible to do, such as dynamically creating preview images.
Note
While it is very helpful to understand the nuts and bolts of
working with the canvas API, which
this chapter will help expose you to, most practical projects use
libraries that automate the usage of canvas for various tasks. As you will see,
some of the tasks can be quite tedious, so using a helper library can be
the key to keeping you productive and sane.
9.1. Drawing on a <canvas>
Problem
You want to draw graphic elements on your page rather than including them
in as an external image with the img
element.
Solution
Use the canvas element in your
markup:
<canvas id="mycanvas"></canvas>
Note
The canvas element can have
“fallback” content inside the tag, which the browser will render only
if canvas itself is not supported.
While not a strong feature for accessibility purposes, this does
provide a modest mechanism for alternate content that screen readers
can make available to the user. (For more on accessibility, see Chapter 7.) Another approach would be to insert the
canvas element inside figure element and provide alternative text
through the figcaption (See Recipe 1.15). For more information on providing fallback
content for canvas, see http://www.w3.org/TR/2dcontext/#focus-management.
Alternatively, you can create a canvas element dynamically, append it to the
page, and then use CSS to position it where you need it:
var mycanvas = document.createElement("canvas");
mycanvas.id = "mycanvas";
document.body.appendChild(mycanvas);
To draw into the canvas
element, first get a reference to the canvas element’s context and then issue drawing commands
against that reference:
var mycanvas = document.getElementById("mycanvas");
var mycontext = mycanvas.getContext("2d");
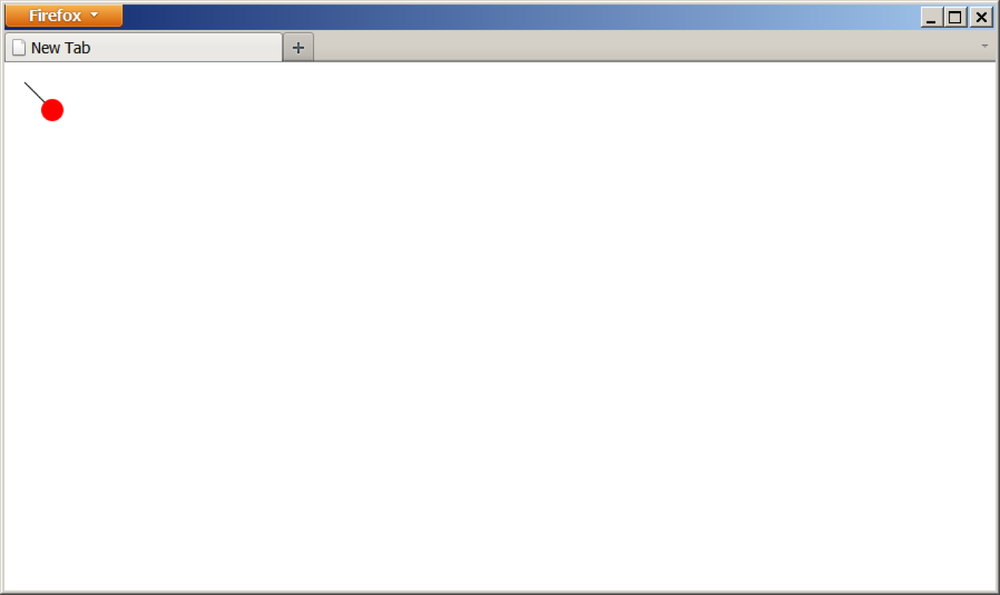
mycontext.beginPath();
mycontext.moveTo(10, 10);
mycontext.lineTo(35, 35); // draw a line path from (10,10) to (35,35)
mycontext.strokeStyle = "#000";
mycontext.stroke(); // draw the line
mycontext.beginPath();
mycontext.arc(35, 35, 10, 0, Math.PI * 2, true); // draw a circle
mycontext.fillStyle = "#f00";
mycontext.fill(); // fill the circle solidFigure 9-1 shows the result of this code.
Note
In canvas, the order of how
you draw things is important, as the last drawing operation for any
pixel is the one that is visible. Here, we drew the line first and the
circle second.
The canvas API
Here are some commonly used drawing commands in the canvas API:
beginPath()Start a path segment definition, to be used by a rendering operation like
stroke()orfill().closePath()Close the path by adding a line segment from the end of the path back to the beginning of the path.
moveTo(x,y)Move the registration point for the next relative drawing operation.
lineTo(x,y)Create a line path from the current registration point to
(x,y).rect(x,y,width,height)Create a rectangle path where
(x,y)is one corner, and the diagonally opposite corner is(x+width,y+height).arc(x,y,radius,startAngleRadians,endAngleRadians,antiClockwiseDirection)Create a circular arc path (up to a full circle), where
(x,y)is the center of the arc and the arc starts and ends at the given angles (in radians) and moves in either a clockwise or counter-clockwise direction.fill()stroke()Stroke (i.e., render, make visible) the most recent path segment.
drawImage(image, ...)strokeText(text,...)fillText(text,...)clearRect(x,y,width,height)Clear a rectangular portion of the
canvasfrom(x,y)to(x+width,y+height).strokeStyle=[string|object]fillStyle=[string|object]Set the color/style attributes for strokes or fills, respectively.
Discussion
The canvas API for 2D
drawing is standardized in HTML5 (see http://dev.w3.org/html5/2dcontext/). In large part,
canvas works the same way across all
the modern browsers, which all now support it. However, be aware that
there are some subtle differences between the browsers’
implementations.
Note
Because these quirks in behavior between different browsers/versions are generally outside the specification and are more implementation-specific, detailing or predicting them is futile.
As such, we do not cover those quirks in depth; instead, the
reader is implored to carefully test the usage of canvas and its API in all relevant browsers
to avoid pitfalls.
The canvas element is specified
to have a couple of rendering contexts, which is
basically a fancy way of saying “coordinate systems.” At this time, the
only useful (implemented) rendering context is 2d,
which defines a flat, two-dimensional Cartesian coordinate system with
(0,0) at the top-left corner (thereby matching the coordinate system
style in web pages). Practically all canvas API calls are made against the context,
rather than the canvas itself.
Assuming you have a reference to a canvas element, to get a reference to its 2d
context, use:
var mycontext = mycanvas.getContext("2d");Once you have the context, the
canvas API commands listed in the
previous section are all available to be called. The shape-drawing
commands in the canvas API are all
path-based. This means that you first “draw”—or define, but not
visibly—a path (one or more straight or curved
edges) that represents the shape (line, arc/curve, rectangle, etc.), and
then you specify what you want done to the path.
Typically, you stroke the path, drawing a line along its boundary edges, and/or fill the path, filling its interior with a color or pattern.
Because you essentially render a path only after that path is defined, you will often end up needing to create many separate path segments in your drawing, and you will apply different strokes/fills/etc. to render each of the segments as you define them.
The first step in defining a path segment is always to
call beginPath():
mycontext.beginPath();
mycontext.moveTo(10, 10);
mycontext.lineTo(30, 30);
Note
If you call closePath()
before you call a rendering command like stroke() or fill(), the path literally is “closed,” in
that the beginning point of the path is automatically joined with the
end point of the path, with a final line segment.
After defining your path segment, call a rendering command, such as stroke() or fill(). Those commands act upon that most
recently defined path segment—whatever has been defined since the most
recent beginPath() call—and then
subsequently that path is no longer active or available:
mycontext.beginPath();
mycontext.moveTo(10, 10);
mycontext.lineTo(30, 30);
mycontext.stroke();
Keep in mind that if you draw more than one shape in the same path
segment, generally speaking, the canvas interprets the paths as being
connected. In this sense, “connected” means that there is an edge from
the end of one shape to the beginning of the next. This is not always
true, though; some shape definition commands imply their own independent
or not-relative segments.
Again, it’s best practice to explicitly define your path segments,
to avoid such pitfalls. One explicit way to avoid segments being
connected is to use moveTo(...), which
conceptually “picks up the pen” and moves it to a new location before
setting it down, rather than acting like the pen has drawn a connecting
line from the previous location to the new location.
Vectors versus bitmaps
You may be familiar with the concept of vector drawing as opposed to bitmap drawing. Vector drawing is essentially describing an image as a series of shapes using equations, such that the shapes (the vectors) can be modified (rotated, scaled, transformed, etc.) without any loss of quality.
Bitmap drawing, on the other hand, is specifically constrained to painting a color into one or more individual pixel locations. Transformations against bitmaps are “lossy” in that you get some fuzzy or blurry artifacts along color boundaries as you make the transformations, because what might have been a clear color boundary from one pixel to the adjacent pixel in the original orientation of the drawing is now not a clear boundary between two pixels, but a mix of colors between the two pixels.
It is important to keep vector and bitmap ideas clear and
separate in your mind as you work with the canvas element. The paths that you draw with
API commands like lineTo(...) are like
vectors: they can be defined and then modified using various
transformations, without any loss of quality. Once you have the path
in the state that you want, you then render that path, which creates
visible pixels in the bitmap output of your canvas element. If you were to then apply
more transformations to your bitmap, such as rotating the entire
element, you would be subject to potentially “lossy” transformations,
as described above.
To put it more plainly, think of your path definitions as vector equations—which are invisible and, until rendered, can be changed at will—and think of the stroke and fill operations that you perform against a path as pixel bitmap rendering. In principle, this is no different from how a vector image editing program would operate.
Note
If you draw a shape (or modify a shape’s location or dimensions) where it overlaps only part of a pixel, such as a line from (10.5,20) to (10.5,50), each half-pixel will be partially rendered (anti-aliasing), which may produce fuzzy line effects.
There are, of course, operations that you explicitly want to perform only against the final rendered output (such as color mutations), but these operations are bitmap-based, as opposed to the geometric transformations you perform against paths.
See Also
For more information on how to use canvas, see this canvas tutorial on MDC: https://developer.mozilla.org/en/Canvas_tutorial.
9.2. Using Transparency
Problem
You want to draw shapes in the canvas
element which have some transparency, so they allow content from beneath
to show through.
Solution
The canvas element is, by
default, transparent, which means that it will show any content that is
stacked beneath it. You can control what pixels are transparent or not
simply by what you draw onto the canvas element.
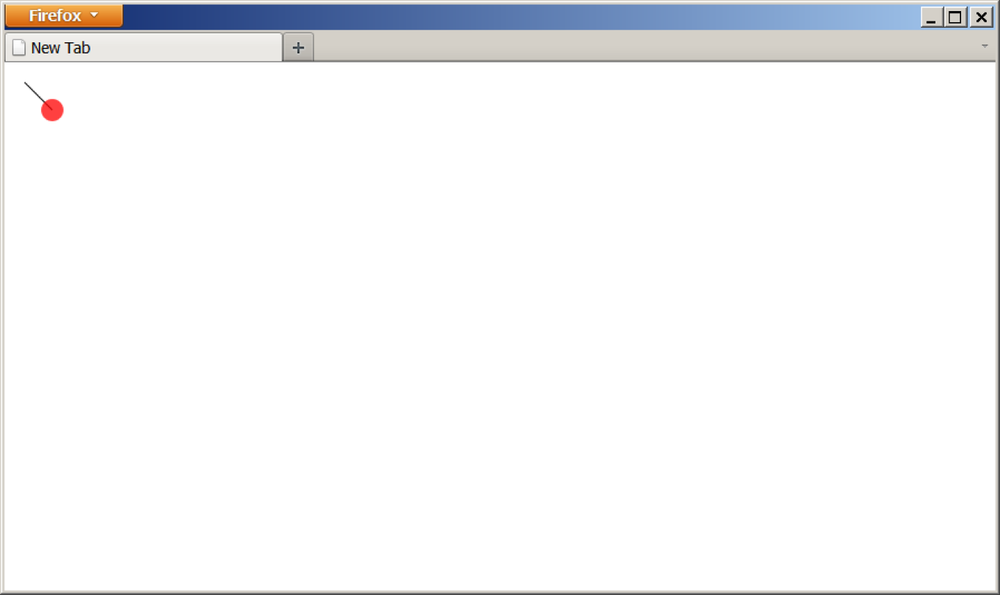
If we position a red circle drawing (like the one from the
previous recipe) over the top of some text, the portions of the canvas element not drawn on by the circle will
remain transparent, and the text from beneath will show through, as
illustrated in Figure 9-2.

Further, you can ensure that a pixel you have drawn on the
canvas element retains partial
transparency by manipulating the alpha channel of the color used to draw
the pixel. Partial transparency means that what the user sees for each pixel is the
combination of the color at that location below the
canvas element and the color shown
for that pixel in the canvas element.
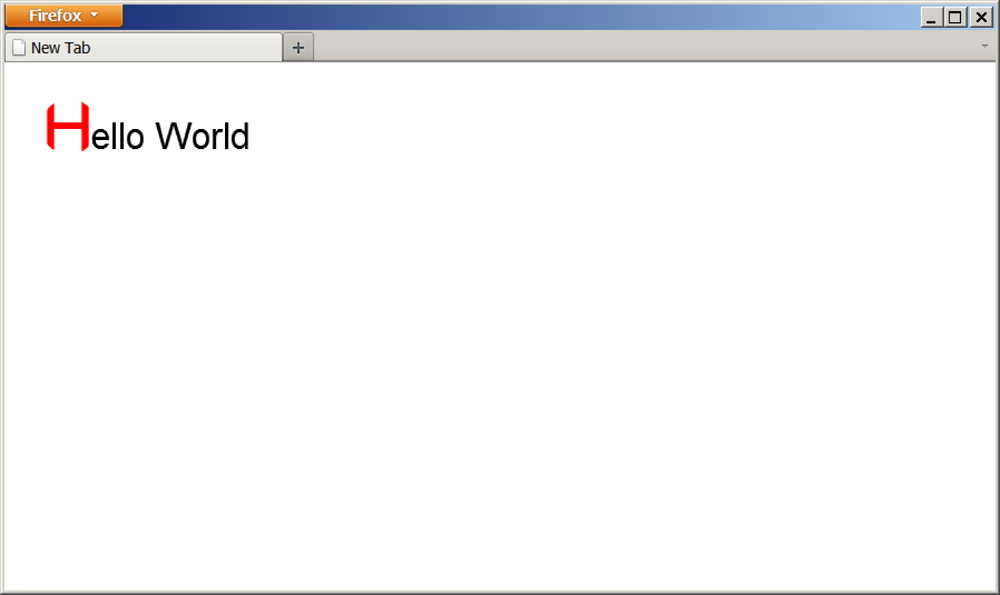
For example, if we were to make the red circle from the previous example partially transparent, it would appear as shown in Figure 9-3.

The partially transparent color is useful not only for content
that appears on the page beneath the canvas element, but also for content that has
already been drawn onto the canvas
element itself:
mycontext.beginPath();
mycontext.arc(40, 40, 25, 0, Math.PI * 2, true); // draw a circle
mycontext.closePath();

mycontext.fillStyle = "#f00";
mycontext.fill(); // fill the circle solid

mycontext.beginPath();
mycontext.arc(70, 40, 25, 0, Math.PI * 2, true); // draw a circle
mycontext.closePath();

mycontext.fillStyle = "rgba(0,0,255,0.75)";
mycontext.fill(); // fill the circle solid;
In the above code snippet, we draw a partially transparent blue circle overlapping part of a red circle. The portion of the circles that overlaps will produce the color purple from the mixing of the blue with the red, as seen in Figure 9-4.

Discussion
In general, a canvas element
starts out with all its pixels being completely transparent. Any pixel
that is drawn with a fully opaque color will no longer have any
transparency, whereas any pixel that is drawn with a partially opaque
color will retain partial transparency. The default is fully opaque with
no transparency. You generally define the alpha transparency of a color
with "rgba", in the same way that you
specify CSS3 color values (see http://www.w3.org/TR/2003/CR-css3-color-20030514/#numerical),
like so:
mycontext.fillStyle = "rgba(255,0,0,0.5)";Here, the 0.5 specifies a 50%
opacity for the red color, meaning all pixels that are drawn with that
color style will have 50% transparency and thus that the content from
beneath will partially show through, as shown in Figure 9-5.
The other way to affect the transparency of rendered pixels is to
set the globalAlpha property,
with a value ranging from 0.0 to
1.0.
When a pixel is drawn with partial transparency, the default composite operation is to take that pixel’s existing rendered color definition, if any, and combine it with this new color definition to produce the new pixel color. That’s how the black line appears to be below the partially transparent red dot in Figure 9-5.
Keep in mind, though, that there are not two actual layers of
shapes here (as you might be used to with digital imaging software),
even though it appears that way. The pixels that were rendered were
composited together, combining what was already there in the first path
with what’s drawn by the second path. The final result is still one
single-layer bitmap rendering in your canvas element. This means that once these two
shapes have been rendered on top of each other, they cannot be moved or
changed independently, since there’s just one bitmap.
However, since pixels in a canvas element can have transparency, it is
possible to emulate separate layers by simply stacking canvas elements, and drawing different shapes
into each. In this case, there is not really canvas-level compositing going on between the
two independent layers (they are separate elements, although obviously
your browser, operating system, and computer screen are doing the
compositing), so the two elements can be moved, modified, erased, etc.,
independently of each other. See Recipe 9.10, for more on this
subject.
See Also
For more information on transparency, see this canvas “styles and colors” tutorial on MDC: https://developer.mozilla.org/En/Canvas_tutorial/Applying_styles_and_colors.
9.3. Setting <canvas> Dimensions
Problem
You want to explicitly specify the width and height of your canvas element to be different than the
default dimensions.
Solution
Add the width and height attributes, and their corresponding values, to your
canvas element:
<canvas id="mycanvas" width="200" height="200"></canvas>You may also want to change the width and/or height of your canvas element with JavaScript. If you want to
change how much width or height (i.e., pixels for rendering) is
available in your canvas element, you
must change the attributes of the canvas element (not the CSS style properties
of width and height, as you might assume):
mycanvas.setAttribute("width", "200"); // will change the bitmap dimensions
mycanvas.setAttribute("height", "200");
You can also set the width and
height properties directly on the
element:
mycanvas.width= 200; // will change the bitmap dimensions mycanvas.height= 200;
Either approach will allow your canvas element to use 200 pixels in the
horizontal direction and 200 pixels in the vertical direction.
By contrast, controlling the size of your canvas element with CSS—either with CSS rules
or by directly setting CSS properties in JavaScript— does not affect the
bitmap dimensions of your canvas
element, but rather takes the existing canvas element (at its existing bitmap
dimensions) and stretches or shrinks its physical dimensions, as necessary:
mycanvas.style.width= "200px"; // will shrink the horizontal rendering mycanvas.style.height= "200px"; // will stretch the vertical rendering
Discussion
The default dimensions of a canvas element are 300 pixels wide by 150
pixels high. In practice, you’ll usually want to define different
dimensions for your canvas
element.
Note
As with all block-level HTML elements, if you make your canvas absolutely
positioned, it does not necessarily default to having any physical
dimensions to render. You need to explicitly define the physical
rendering dimensions via CSS, in addition to the bitmap pixel
dimensions. To keep a consistent rendering ratio, make sure the
physical dimensions match the bitmap pixel dimensions.
You can specify the bitmap pixel dimensions using attributes on
the canvas element, either in the
markup or with a setAttribute(...)
call. You can also resize the canvas element by using CSS styling on the
width/height, but this has the effect of shrinking or stretching the
canvas element while keeping the
existing pixel dimensions, rather than actually changing them.
For instance, let’s say you wanted a full-page canvas element that resized itself with the
window. If you want that sizing to be achieved by stretching or
shrinking the canvas element while
maintaining the same pixel dimensions, use CSS, like this:
#mycanvas { width:100%; height:100%; }However, if you want a canvas
element that keeps resizing its bitmap pixel dimensions along with the
dimensions of the browser window, you need to use JavaScript:
window.onresize = function() {
    mycanvas.width = document.documentElement.clientWidth;
    mycanvas.height = document.documentElement.clientHeight;
};
You can resize the canvas
element as often as you like. However, each time you resize it, the
drawing space will be cleared. This is actually a useful trick, as you
can quickly clear the canvas by
simply setting its width to be the
same as its current width:
function clear(mycanvas) {
    mycanvas.width = mycanvas.width;
}
See Also
For more information on how to use canvas, see this canvas tutorial on MDC: https://developer.mozilla.org/en/Canvas_tutorial.
9.4. Using Gradients, Patterns, and Line Styles
Solution
Each time you render a path to the canvas element, the color and style for that
drawing are picked up from the currently set stroke and fill
styles.
For instance, to vary the way that line segments are drawn on
paths, you can control the stroke styles with lineWidth, lineCap, and lineJoin:
mycontext.lineWidth= "12"; mycontext.lineJoin= "round"; mycontext.moveTo(20, 20); mycontext.lineTo(50, 50); mycontext.lineTo(20, 70); mycontext.stroke();
The result is shown in Figure 9-6.

To vary what is painted inside the paths you draw, you can control the fill styles to create gradients or image patterns (Figure 9-7):
var lingrad = mycontext.createLinearGradient(20,20,40,60); lingrad.addColorStop(0.3, "#0f0"); lingrad.addColorStop(1, "#fff"); mycontext.fillStyle= lingrad; mycontext.moveTo(20, 20); mycontext.lineTo(50, 50); mycontext.lineTo(20, 70); mycontext.closePath(); mycontext.fill();

Discussion
There are several different ways to control the style of how your
paths are rendered. For instance, for lines (strokes), you can set the
lineWidth property to vary the width of the lines used to stroke. In
addition, the lineCap property
controls how the cap/end of a line segment is rendered
(squared off, rounded, etc.), and the lineJoin property
controls how the connection (or joint) between two line segments is
drawn. Figure 9-8 shows a few different line
styles.
In addition to line styles, you can define custom color styles for both lines and fills. There are two options: gradients and patterns.
Gradients are a gradual progression from one color to another color (or colors).
They can be linear (progressing in a straight line)
or radial (progressing radially/circularly from a
central point). To use them, you create a gradient object, set one or
more color stops on it, and then use that object as
the strokeStyle or fillStyle.
Patterns are essentially created by taking an existing image (even
another canvas element) and using
that as the “color” for a line or fill, repeating the image in question
as necessary to fill the space required of the color. To use them, you
create a pattern object, specifying which image to use and
how to repeat it, and then use that object as the strokeStyle or fillStyle. Figure 9-9 shows the results of a
few different fill gradients and patterns.


Pattern fills also allow you to tile (or repeat) an image. The
canvas API command createPattern(...)
takes as its second parameter a string value to control the tiling. For
no tiling, use no-repeat. Currently,
the only tiling value supported consistently is repeat, which defaults to repeating the image
both horizontally and vertically, as shown in Figure 9-10:
var img = document.getElementById("my_fish_image");
var imgfill = mycontext.createPattern(img, "repeat");
mycontext.fillStyle = imgfill;
mycontext.fillRect(0, 0, 200, 200);
See Also
For more information on line styles, gradients, and pattern fills,
see this canvas “styles and colors”
tutorial on MDC: https://developer.mozilla.org/En/Canvas_tutorial/Applying_styles_and_colors.
9.5. Pulling External Images into a <canvas> Drawing
Problem
You have an existing image (graphic, icon, photo, etc.) in an external
file that you want to put into a canvas element, so that you can then
manipulate or embellish it with canvas API drawing commands.
Solution
First, either load the image in question using an img tag in your markup and get a reference to
it, or create an Image element
dynamically in your JavaScript code:
var img =new Image(); img.src= "http://somewhere/to/my/image.jpg";
Next, once the image is loaded, draw the image onto a canvas element:
var img = new Image();
img.onload = function() {
    // note: we're calling against the "2d" context here
    mycontext.drawImage(img, 0, 0); // draw the image at (0,0)
};
img.src = "http://somewhere/to/my/image.jpg";
Note
The image object you pass as the first parameter to drawImage(...) can actually be a real image,
another element, or a video element
(achieved by capturing a frame of video into your canvas).
This assumes that your canvas element is
already properly sized to be able to handle the image that you’re trying
to draw into it. If it’s too small in either dimension,
clipping occurs, with the image being cut off on
the right or bottom edge, respectively.
Discussion
The canvas API gives you the
drawImage(...) command to let you
capture image bitmap data from another source (an image, another
canvas element, or a video element) and draw it directly into your
canvas element.
There are three ways to call drawImage(...). The simplest form, shown
above, takes an element to capture the bitmap image data from and two
coordinates, the (X,Y) location inside your canvas element at which to place the top-left
corner of the image.
The second form takes an additional two parameters, (dw,dh), which are the width and height of the area
from the original image that you want to capture and copy to your
canvas element.
The third form of the call takes quite a few more parameters than
the second form. The first four numeric parameters, (sx,sy,sw,sh), specify the top-left location and the
width/height of the area from the original source image data to capture,
and the last four parameters, (dx,dy,dw,dh), represent the top-left location and the
width/height of the area where the image data will be copied to in your
canvas element:
function createCanvas(id, width, height) {
    var canvas = document.createElement("canvas");
    canvas.id = id;
    canvas.setAttribute("width", width);
    canvas.setAttribute("height", height);
    document.body.appendChild(canvas);
    return canvas;
}

var small_canvas = createCanvas("small", 100, 100);
var large_canvas = createCanvas("large", 300, 300);
var small_context = small_canvas.getContext("2d");
var large_context = large_canvas.getContext("2d");

var img = new Image();
img.onload = function() {
    // note: using different (sw,sh) and (dw,dh) dimensions here shrinks the image
    small_context.drawImage(img, 0, 0, 300, 300, 0, 0, 100, 100);
    // just grab the top-left 300×300 area from the image
    large_context.drawImage(img, 0, 0, 300, 300);
};
img.src = "http://somewhere/to/my/image.jpg";
Figure 9-11 illustrates these parameters.

Once you’ve drawn an image into your element, that image data is no different from any other bitmap image data that you could draw. This means that you can easily draw over the top of your drawn image, using all the same capabilities as previously discussed.
See Also
Tutorial on pulling an image into canvas with Ajax: http://www.html5canvastutorials.com/advanced/html5-canvas-load-image-data-url/.
9.6. Setting Color Transformations
Problem
You want to apply a color transformation (like grayscale or invert) to an
existing canvas drawing.
Solution
The canvas API provides a
command called getImageData(...) that grabs all the pixel
color data from the canvas element,
handing it to you in one long array:
var drawing = mycontext.getImageData(0, 0, 200, 200);
Note
The array you get from getImageData(...) is not in quite the format
you’d generally expect. First, it’s not a two-dimensional array, with
width and height dimensions. Instead, it is a linear single-dimension
array, where the values wrap from one line to the next, like a big
long string of text that you paste into a text editor.
Second, there are four consecutive entries in the array for each
pixel, each entry corresponding to a color component for a pixel. So,
each pixel takes up four entries in the array, in the form of [..., red, green, blue, alpha, ...].
Once you have the image data captured, you can manipulate that
data using any transformations you please and then write it back to the
canvas element.
To grayscale the drawing, the simplest algorithm is to take the average of the red, green, and blue color components and set all three to that average value:
var avg;
// skip 4 entries (1 px) at a time
for (var i = 0; i < drawing.data.length; i = i + 4) {
    avg = (drawing.data[i] + drawing.data[i+1] + drawing.data[i+2]) / 3;
    drawing.data[i] = drawing.data[i+1] = drawing.data[i+2] = avg;
}
To color-invert the drawing, the simplest algorithm is to take each color component value, subtract it from 255, and set that color value back:
// skip 4 entries (1 px) at a time
for (var i = 0; i < drawing.data.length; i = i + 4) {
    drawing.data[i] = 255 - drawing.data[i]; // invert red
    drawing.data[i+1] = 255 - drawing.data[i+1]; // invert green
    drawing.data[i+2] = 255 - drawing.data[i+2]; // invert blue
}
Now that the data has been modified, we simply write it back to
the canvas element, using
the putImageData(...)
command:
mycontext.putImageData(drawing, 0, 0); // put the image data back at (0,0)
Discussion
As we discussed in Recipe 9.1, the image that is rendered visible on the page is the bitmap data rendering of the paths and styles (or vectors) that you defined while drawing your image.
Fortunately, the canvas element
allows us to access and modify some or all of the pixel color data in
the element. This means that any manner of sophisticated bitmap
transformations can be accomplished. In addition to applying color
transformations, as we did here, you could apply algorithms to blur the
image, pixelate it, zoom it, etc. Those various algorithms are beyond
the scope of this chapter (and this book), but the process would always
be the same as that outlined in this recipe: first get the bitmap image
data array, then process the individual color component (red, green,
blue, alpha) entries for each pixel, and then write some or all of that
data back to your canvas
element.
Note
If you write an external image to a canvas element that comes from a different
domain than the page’s domain, the canvas is marked as “unclean” (meaning it’s not abiding by
the same-origin security policy), and thus you are not able to call
getImageData(...) to retrieve that
data.
You can always write to the canvas element, but you can only read data
from it if all the data in the canvas originated from the page’s
domain.
See Also
This recipe only briefly touched on basic ways to manipulate the
colors in your canvas images and
drawings. For much more complex effects that you can apply to your
canvas element, check out PaintbrushJS: http://mezzoblue.github.com/PaintbrushJS/demo/.
9.7. Working with Geometric Transformations
Problem
You want to apply some transformations to your drawing commands, such as scaling, rotation, skewing, etc.
Solution
The canvas API provides several
commands for transforming your canvas
drawing actions:
translate(x,y)Move/skew the location of the origin point for the coordinate system from (0,0) to (x,y).
scale(x,y)Scale the units of the coordinate system in the x and y directions, independently.
rotate(angle)Rotate the coordinate system about the origin point, (0,0), by the angle (moving in a clockwise direction) specified in radians.
When you start combining multiple transformations, it is often
easier to manage the state of the canvas element on a stack, where you can
simply revert back one level to undo all transformations (and other
state, like style/color settings) with one command. The canvas API provides two commands for managing
your state stack, save() and restore():
mycontext.save();              // save the current state of the canvas
mycontext.translate(10, 10);   // move the origin point to (10,10)
mycontext.arc(0, 0, 10, 0, Math.PI * 2, true); // draw a circle
mycontext.stroke();
mycontext.restore();

mycontext.save();
mycontext.rotate(Math.PI / 4); // rotate 45 degrees clockwise
mycontext.moveTo(0, 0);
mycontext.lineTo(10, 0);
mycontext.stroke();
mycontext.restore();
In both these transformations, the action taken could easily be
reversed. That is, we could easily translate back to our original origin
point with translate(−10, −10), or
back to our original rotation with rotate(Math.PI / −2).
However, as soon as you start combining multiple translations at
once, or nesting translations into multiple steps or layers, stack
management becomes quite necessary. It is best practice to always use
stack management for your canvas
element’s state as you make style changes or transformations.
Discussion
The concept of using transformations to adjust your drawing commands is probably going to be a bit strange to you at first. Most developers are initially a little confused by this idea. Don’t worry, though; after you’ve done it a few times you’ll get more comfortable with this new mindset, and it won’t seem quite so foreign.
To get started, here’s what you need to know: transformations do
not actually affect your drawing commands or what’s currently in the
canvas element. Instead,
transformations affect the coordinate system, so that all the
coordinates that you use in your subsequent drawing commands are
automatically interpreted in the transformed coordinate system, instead of the original
coordinate system.
Say what?! Okay, let’s try a different approach. Think of these transformations as keeping your pen in the same location, but (without the pen touching the paper) moving the paper underneath your pen to a different location or rotating it at an angle, then drawing what you planned as if the paper hadn’t moved, and then moving the paper back to its starting position on the desk.
Re-read that last paragraph again, to make sure you understand how
coordinate system transformations affect how you draw into the canvas element.
If you translate (or move) the coordinate system 10 pixels to the
right and draw a shape at (0,0) relative to the now-moved coordinate
system, the shape actually appears at (10,0) in the absolute coordinates
relative to your canvas element container.
So, translating the coordinate system 10 pixels to the right and drawing a shape at (0,0) is basically the same as not translating the coordinate system at all and simply drawing the shape at (10,0):
mycontext.save();
mycontext.translate(10, 0); // move coordinate system 10 pixels right
mycontext.moveTo(0, 0);
mycontext.lineTo(50, 0);    // line actually appears from (10,0) to (60,0)
mycontext.stroke();
mycontext.restore();

mycontext.moveTo(10, 0);
mycontext.lineTo(60, 0);    // same line, basically
mycontext.stroke();
The same goes for rotation, although the math is a little trickier. If you rotate the canvas by 30 degrees clockwise and draw a shape at (50,0), it’s actually drawn at a relative location that appears to be 30 degrees down from its horizon:
mycontext.save();
mycontext.rotate(Math.PI / 6); // rotate 30 degrees clockwise
mycontext.moveTo(0, 0);
mycontext.lineTo(50, 0); // line actually angles 30 degrees down from horizontal
mycontext.stroke();
mycontext.restore();
At first, you may wonder why translations and rotations are even necessary. After all, can’t you just draw your line or circle at the proper location and in the proper orientation, and not worry about complexity of the transformations?
For some tasks, yes. But again, for more complicated tasks, it’s almost imperative that you transform your coordinate system so that your use of the drawing commands (and, in particular, which numbers you use for the parameters) is more sensible and semantic.
How would you draw a rectangle at an angle? Well, you could
calculate the vertices using geometric calculations and then manually
draw the four sides as individual lines. But who wants to do it that
way? Instead, rotate the coordinate system and call the rect(...) command;
it’s as simple as that.
Scaling is another example of something that almost always requires transformations to work properly, specifically because scaling can be done independently in both the x and y directions. What scaling amounts to is saying that if you scale the x direction of your coordinate system to twice as large, and you draw a line that is supposed to be 50 units (pixels) long, it actually is rendered as twice as long (100 pixels):
mycontext.save();
mycontext.scale(2, 1);    // scale x direction units by a factor of 2
mycontext.moveTo(0, 0);
mycontext.lineTo(50, 0);  // line actually appears to extend to (100,0)
mycontext.stroke();
mycontext.restore();

mycontext.moveTo(0, 0);
mycontext.lineTo(100, 0); // same line, basically
mycontext.stroke();
Other tasks—rotating an image, for instance—also beg for
transformations, because it would be very difficult (and certainly,
performance-wise, impractical) to manually transform the raw bitmap
image data array yourself. Instead, you simply rotate the coordinate
system and draw the image into it, and the canvas element does the hard work for
you:
mycontext.save();
mycontext.rotate(Math.Pi / 4);  // rotate 45 degrees clockwise
mycontext.drawImage(img, 0, 0); // draw the image at (0,0)
                                // in the rotated coordinate system
mycontext.restore();
Finally, let’s take a look at nesting transformations, to
reinforce why transformations and stack management of the canvas element’s state are helpful (as shown
in Figure 9-12):
mycontext.beginPath();
mycontext.strokeStyle = "#f00"; // red color
mycontext.translate(20, 20);    // move the coordinate system to (20,20) origin
mycontext.moveTo(0, 0);         // actually (20,20)
mycontext.lineTo(80, 10);       // actually (100,30)
mycontext.stroke();

mycontext.save();               // save <canvas> state

mycontext.beginPath();
mycontext.strokeStyle = "#00f"; // now blue color
mycontext.rotate(Math.PI / 4);
mycontext.moveTo(0, 0);
mycontext.arc(0, 0, 52, Math.PI / 3, Math.PI / 6, true);
mycontext.closePath();          // connects back to the start of the path
mycontext.stroke();

mycontext.restore();            // back to previous <canvas> state

mycontext.beginPath();
mycontext.moveTo(80, 10);
mycontext.lineTo(14, 50);
mycontext.stroke();

See Also
See the W3C specification for canvas transformations at http://www.w3.org/TR/2dcontext/#transformations.
9.8. Placing Text on a <canvas>
Solution
The canvas API provides two
commands for rendering text in your drawing: fillText(...) and
strokeText(...). Both commands take
the same parameters: (stringToRender, x, y[, maxWidth]). The only difference is whether the text is
filled in or simply outlined.
To set the font style (font face, size, etc.), use the font property:
mycontext.font = "25pt Arial";Now, simply call the appropriate text command:
mycontext.fillText("Hello World", 0, 25);
mycontext.strokeText("Hello World", 0, 75);
The result of this code snippet is shown in Figure 9-13.

Discussion
The fillText(...) and strokeText(...) commands use the font styling specified in the font property. The available settings (font
face, style, size, etc.) are defined to be the same as what would be
available to CSS font style rules. The colors used are, of course,
controlled by the fillStyle and
strokeStyle properties, respectively.
The same goes for the stroke line width.
See Also
For more on drawing text on a canvas, see https://developer.mozilla.org/en/drawing_text_using_a_canvas.
9.9. Clipping <canvas> Drawings
Problem
You want to use a drawing command, but you want to clip the drawing by some other shape that you define.
Solution
The canvas API provides the
command clip(...), which will
take the currently defined path and use that as a clipping mask for subsequent drawing
commands. This means the canvas
element will only draw inside the defined clipping mask boundaries and
will discard any drawing outside the path.
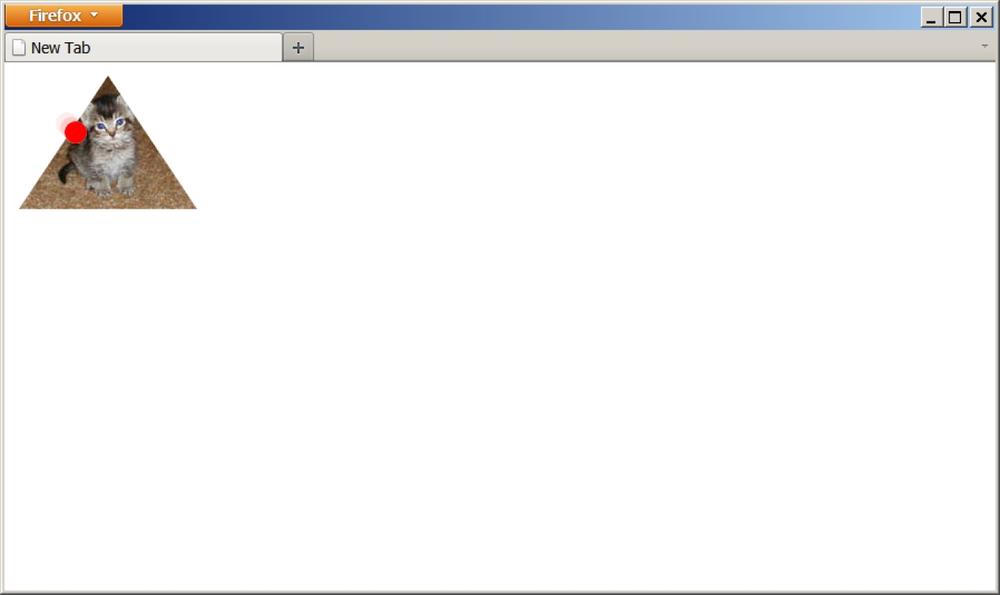
To add the text of the letter “H” but clip it by a circle, you would do this:
mycontext.beginPath();
mycontext.arc(50, 50, 25, 0, Math.PI * 2, true); // circle path
mycontext.clip(); // make the path our clipping mask

mycontext.fillStyle = "#f00";
mycontext.font = "50pt Arial";
mycontext.fillText("H", 25, 75);
The result of the circle-clipped “H” is shown in Figure 9-14.

As you can see, the circle itself was not drawn; instead, it was
used as the clipping path for the subsequent fillText drawing command.
Discussion
The canvas element’s state
defaults to a clipping mask that comprises the entire visible area of
the canvas element. Once you define a
clipping mask using the clip(...)
command, that clipping mask will remain in effect for all future drawing
commands, until you change or reset it.
Just as we saw in Recipe 9.7, you can use stack management of the element’s state to make a temporary clipping mask change, and then roll it back to the default (entire element), as shown in Figure 9-15:
mycontext.save();
mycontext.beginPath();
mycontext.arc(50, 50, 25, 0, Math.PI * 2, true); // circle path
mycontext.clip(); // make the path our clipping mask

mycontext.fillStyle = "#f00";
mycontext.font = "50pt Arial";
mycontext.fillText("H", 25, 75);
mycontext.restore(); // back to default <canvas> state (including clipping)

mycontext.font = "25pt Arial";
mycontext.fillText("ello World", 70, 70); // black text, not clipped
See Also
The W3C specification on clipping at http://www.w3.org/TR/2dcontext/#clipping-region.
9.10. Animating <canvas> Drawings
Problem
Drawing static shapes into the canvas element is fine, but now you want to
make the shapes move around.
Solution
Animation with the canvas
element boils down to drawing a frame of your animation and then, a few
milliseconds later, erasing that drawing and redrawing the next frame,
probably with some elements slightly moved or otherwise changed. If you
animate by showing the frames fast enough—around 20–30 frames per
second—it generally looks like a smooth animation of your shapes.
In this chapter, we’ve already covered how to draw various things
into your canvas element. We also
briefly mentioned one way to clear your canvas element (resetting the width). To fire
up some animation, all we need to do is put those two concepts
together.
Here’s a basic example of a moving red dot (which is shown in Figure 9-16):
function draw_circle(x, y) {
    mycontext.fillStyle = "#f00";
    mycontext.beginPath();
    mycontext.arc(x, y, 10, 0, Math.PI * 2, true);
    mycontext.fill();
}

function erase_frame() {
    mycanvas.width = mycanvas.width;
}

var ball_x = 50;
var ball_y = 50;
var delta = 3;

draw_circle(ball_x, ball_y);

setInterval(function(){
    if (ball_x > 100 || ball_y < 15 || ball_x < 15 || ball_y > 100) {
        delta *= −1;
    }
    ball_x += delta;
    ball_y += delta;
    erase_frame();
    draw_circle(ball_x, ball_y);
}, 35);
Discussion
Depending on the setup of your animation frame, you may need to
employ various methods to get the most efficient drawing (and erasing)
of your shapes and/or images. We’ll now cover several different
approaches to drawing and erasing to accomplish animations with the
canvas element.
If you have a transparent background and one shape (like a circle)
bouncing around in your canvas, as in
the example code above, you don’t need to erase the whole canvas element before drawing the next frame;
you only need to erase the small portion of the element that has
something drawn in it (i.e., the circle).
That is, all you need to do is erase the part of the canvas element that you drew onto in the
previous frame. Especially for larger dimensions, this technique can
enhance performance significantly.
To erase only part of the canvas element, use the canvas API command clearRect(...):
function draw_circle(x, y) {
    mycontext.fillStyle = "#f00";
    mycontext.beginPath();
    mycontext.arc(x, y, 10, 0, Math.PI * 2, true);
    mycontext.fill();
}

function erase_circle(x, y) {
    mycontext.clearRect(x-10, y-10, 20, 20);
}

var ball_x = 50;
var ball_y = 50;
var delta = 3;

draw_circle(ball_x, ball_y);

setInterval(function(){
    if (ball_x > 100 || ball_y < 15 || ball_x < 15 || ball_y > 100) {
        delta *= −1;
    }
    erase_circle(ball_x, ball_y);
    ball_x += delta;
    ball_y += delta;
    draw_circle(ball_x, ball_y);
}, 35);
This technique of drawing the entire frame and then erasing it and redrawing it with some things moved or changed works fine, but in certain circumstances, it’s not ideal. For instance, if you are animating a shape like our red circle on top of a static drawing (or an image/photo/etc.), it’s quite a waste of resources to redraw the unchanging background image 30 times per second, simply because the foreground shape (the red circle) has moved and needs to be redrawn.
One solution to this problem is to use two canvas elements, stacked on top of each other.
In the background canvas element, you
draw your static scene image, and in the foreground canvas element you do your animation of the
red circle, as above. This way, the background image is only drawn once,
not every time you redraw the layer with the moving red circle, as shown
in Figure 9-17.
In this example, drawing and redrawing the entire canvas just to show the same red circle in
different positions doesn’t seem strictly necessary. However, in
practical cases, you may be animating more than just the position. For
instance, you may animate an object by moving its position and rotating
it at the same time. In such cases, the draw/redraw method of animation
is most appropriate.
For this simple case, another option would have been to have a
canvas element in the foreground that
was only big enough to contain the red circle (20×20 pixels), and simply
to move that element itself around, using CSS positioning on the page.
Especially for that case, having the red circle separate from the
background image is quite helpful, so that the two elements can be
positioned independently.
See Also
Basic canvas animation
tutorial at https://developer.mozilla.org/en/Canvas_tutorial/Basic_animations.
9.11. Drawing Graphs with <canvas>
Solution
All of the canvas API commands
discussed in this chapter, plus other advanced commands (for complex
curves, etc.), can be combined to create very nice-looking graphs that
visualize data, either as line, pie, or other types of charts.
As you can probably imagine, the complexity of such a task is quite high. So, we will not discuss specifically how to draw your own graphs, but will instead show how to use a simple, free graphing library (which does the hard work for you!) called flot.
The flot library uses jQuery, so you need to load a recent version of jQuery first, and then the latest release of the flot library:
<script src="jquery.js"></script>
<script src="jquery.flot.js"></script>
Next, you need to create a placeholder element in your page, into
which flot will render the canvas
graph. The flot library will automatically match the bitmap rendered
dimensions of the canvas element to
the size of the placeholder element that you specify:
<div id="my_graph" style="width:600px; height:300px"></div>
Now, you need to set up the data that you will plot onto your graph. You can either load this data dynamically, using Ajax, or include the data inline in your script code, as shown here:
var graph_data = [[0, 3], [4, 8], [8, 5], [9, 13]];
The format of the data is an array of [X,Y] pairs for each data point, representing values for the x- and y-axes for each point, respectively.
Once you have the graph data, if the default graphing options are acceptable, simply call the flot graphing API directly, passing it your data:
var my_graph = $("#my_graph");  // get a reference to the placeholder
$.plot(my_graph, [graph_data]); // pass the graph data as one data series
You will notice that we passed the graph data inside [], meaning we actually passed an array
wrapped around our graph data. The flot graphing API supports graphing
multiple data series at a time on one graph. In our example, our graph
data was only one such data series, but you could pass other data series
as desired. The default options and styles will result in a nice-looking
graph, as shown in Figure 9-18.

As you can see, with just a few lines of code we were able to
leverage the power of the flot library to generate a
professional-looking graph, instead of having to write hundreds of lines
of our own canvas API code.
Note
As an interesting exercise, take your knowledge of the canvas API from this chapter’s recipes and
see if you can reproduce the same graph without using the flot
library.
The flot library API allows you to manually generate and display labels for the x- and y-axes, control the minimum and maximum range for each axis, manually define the grid step size for each axis, control colors and line styles, and much more.
Discussion
The flot library is very flexbile and powerful. It has a multitude of options for controlling how graphs are drawn. We will not cover the details of the flot API here, but you’re encouraged to explore the API and configuration options here: http://people.iola.dk/olau/flot/API.txt.
In addition to the built-in graph options, flot features a plug-in system that allows others to create extensions to its capabilities. This makes flot a very capable browser graphing solution for your sites. Several useful plug-ins are included with the flot distribution, and many others are available for optional usage.
There are, of course, dozens of other canvas graphing libraries available as well,
some free and some for license. These options have a wide range of
capabilities, so be sure to explore what’s available.
See Also
For more information on using flot to plot graphs in a canvas element, see the flot home page at http://code.google.com/p/flot.
9.12. Saving a <canvas> Drawing to a File
Solution
The canvas API provides the
command toDataURL(...), which
will extract the image data from the canvas element into the specified image
format. For instance, to extract the image data for a graph generated by
flot (see Recipe 9.11) as a PNG
format file, you would do this:
var canvas = $("canvas", my_graph)[0];
var image_data = canvas.toDataURL("image/png");
Now that you have the raw image data, you can save the image data as you please.
For instance, to send the image data to a server via Ajax, using jQuery, you might use:
$.post("http://location/path/to/upload", {data: image_data});Discussion
The easy part is extracting the raw image data from the element. The hard part is saving that raw data to an actual file.
If you want to save the file back to a server, you can easily send the data to the server as a string value using Ajax. Once the data arrives on the server, you have to parse out the dataURI format, base64-decode the image data, and save that information to a file.
If you wanted to then let a user save that file to his computer, you could tell the browser to download the file you just created, which would then prompt the user to save the file on his system.
Some very recent releases of browsers are supporting local file access, so that you can (in theory) allow a user to save the image to his own computer without needing to first upload it to a server and then re-download it.
Because the process of actually handling these files in this way is rather complex (and beyond the scope of this chapter), you may want to instead use a tool like Canvas2Image, which takes care of much of this difficult stuff for you: http://www.nihilogic.dk/labs/canvas2image/.
See Also
For more information on saving canvas images to a server (using PHP) and then
making them available for users to download and save, see this blog post: http://blog.kevinsookocheff.com/saving-canvas-data-to-an-image-file-with-java-61171.