
Designing for high performance is becoming more important when using a database running in the cloud because development objectives tend to minimize roundtrips and the amount of data being returned. This chapter provides an overview of some of the most common tuning and troubleshooting techniques available in SQL Azure. Keep in mind that performance tuning is a very complex topic; as a result, this chapter can introduce only selected techniques.
The techniques presented are similar to the ones available in SQL Server, although some of the tools aren't supported in SQL Azure. Along the way, you walk through a few examples of how to improve the performance of a SQL statement and the steps required to tune it.
Before diving into the specifics, let's review some of the things you need to remember when tuning your SQL Azure databases. Some of the techniques you may be using today are available, but others may not be.
Because SQL Azure is a hosted and shared infrastructure, it's important to understand which tuning methods are available and which aren't. Table 12-1 outlines some of the key methods traditionally used by developers and DBAs in tuning a database system. The term system is appropriate here because at times you need to tune the database server, and in other instances you need to tune the actual database code or even address database design issues.
The table lists some tuning methods and tools that you may be familiar with. It also indicates which are available for use with SQL Azure. The unsupported tools listed in the table (such as SQL Profiler and Perfmon) are typically those that are—say, in a SQL Server environment—used by DBAs and system administrators.
Table 12.1. Typical tuning methods and tools
Method or Tool | Available | Comments |
|---|---|---|
SQL Profiler | No | Tools using server-side traces, such as most auditing tools, SQL Profiler, and the Index Tuning Wizard, aren't supported. |
Execution plan | Yes | SQL Server Management Studio can display actual execution plans against a SQL Azure database. You review this later in the chapter. |
No | Any Windows monitoring tool that is typically used for performance tuning is unavailable. | |
DMVs | Limited | A few dynamic management views (DMVs) are available and provide insightful information about running sessions and statements previously executed. |
Library metrics | Yes | ADO.NET provides library-level statistics that offer additional insight to developers, such as the total processing time from the consumer standpoint and bytes transferred. |
Because you have no access to the server-side configuration settings of SQL Azure, such as disk configuration, memory allocation, CPU affinitization, and so forth, you need to place more emphasis on the quality of your SQL statements—and, now more than ever, your network traffic. Indeed, the number of network roundtrips your code generates and the number of packets returned have an impact on performance because the connection to SQL Azure is a far link and the communication is encrypted.
Your performance-tuning exercise should include the following areas:
Connection pooling. Because establishing a new connection requires multiple network roundtrips by itself and can affect your application's performance, you should ensure that your connections are pooled properly. In addition, SQL Azure will throttle you if you establish too many connections. This behavior is controlled by the denial of service (DoS) feature briefly discussed in Chapter 4.
Packet count. Because the time spent to return data is greater than you may be used to, you need to pay attention to SQL code that generates too many packets. For example,
Printstatements generate more network traffic than necessary and should be removed from your T-SQL if at all possible.Indexing. You may remember from chapter 2 that SQL Azure may throttle your connection if it detects that your statement is consuming too many resources. As a result, proper indexing becomes critical when tuning for performance.
Database design. Of course, certain database designs are better than others for performance. A heavily normalized design improves data quality, but a loosely normalized database typically improves performance. Understanding this tradeoff is also important when you're developing in SQL Azure.
Let's dive into the specifics of performance tuning, keeping in mind what you've learned so far. You start by looking at database tuning capabilities and then move up the stack, all the way to the client library making the actual SQL call.
SQL Azure provides a few handy system views called dynamic management views (DMVs) that are also available in SQL Server. SQL Azure exposes a subset of the DMVs, but all those related to query execution are available. SQL Azure supports the DMVs listed in Table 12-2.
Table 12.2. Dynamic management views used for performance tuning
Note
Although queries against some of these views can run when you're connected to the master database, they don't return the information you're looking for unless you connect to the database that your application is running against. Also, a user must have VIEW DATABASE STATE permission to see all executing sessions on the database; otherwise, the user sees only the current session.
If you're looking for performance metrics for a SQL statement and you can isolate the statement to a unique database connection, or the statement is no longer executing, the dm_exec_sessions DMV is for you. This is one of the system views that provides performance metrics such as CPU time and duration. However, this DMV accumulates the performance metrics over all the statements executed through the same connection. So, in order to test a database query and retrieve performance metrics of that query alone, you need to establish two connections: one to execute the query, and another to read the performance metrics so as not to interfere with the performance data that SQL Azure has collected.
Note
You need to establish two connections using the same login name, or you can't retrieve the performance metrics of the SQL statement you're trying to tune.
For example, establish a connection to SQL Azure, and run the following SQL query:
SELECT TOP 50 * FROM sys.indexes
Note your session id; it's found on the status bar in Microsoft SQL Server Management Studio. You can also find it on the query tab, in parentheses. For example, in Figure 12-1, the session id is 144: you can see it both on the selected tab and in the status bar at the bottom.

Next, open another query window, which opens a new connection in SQL Azure. Run the following query (see Figure 12-1), and make sure to specify the session id being investigated:
SELECT
   login_time,
   host_name,
   program_name,
   host_process_id,
   cpu_time,
   memory_usage,
   total_elapsed_time,
   reads,
   writes,
logical_reads,
   row_count,
   original_login_name
FROM sys.dm_exec_sessions
WHERE session_id = 176           // replace with your session_id
This statement returns important performance metrics for your previous SQL statement, as explained in Table 12-3.
Table 12.3. Selected columns from sys.dm_exec_sessions
At this point, you need to be aware of a point that is very important for performance tuning. The cpu_time is perhaps the best metric you can use to determine how long a statement takes to execute in SQL Azure. The total_elapsed_time can be misleading. Elapsed time represents the time it takes for SQL Azure (or SQL Server) to fetch the data and return all the data to the client. So, if your client is slow at displaying data, SQL Azure slows down to match the speed of the client; the slowdown is a function of TCP (Transmission Control Protocol) programming and has nothing to do with SQL Azure. As a result, total_elapsed_time shows the entire time it takes to execute the statement and the client time necessary to finish fetching the data. The total_elapsed_time is the same than the Duration measure returned by SQL Profiler.
Earlier, this chapter mentioned that connection pooling is an important consideration for performance. Although this statement is generally accurate in the world of database programming, it becomes critical for SQL Azure. A poorly designed application may create too many connection requests, which can end up flooding SQL Azure. If too many connection requests are established, your connections will be throttled, meaning that you can no longer connect for a period of time.
Note
Tests confirm that a SQL Azure database becomes unavailable for more than a minute if you quickly issue in excess of 50 distinct database connections. After the same test was run multiple times, the database became unavailable for a few hours.
As you can see, you need to minimize the creation of database connections, which you can achieve through proper connection pooling. First, you should know that connection pooling is affected if any part of the connection string is changed (even slightly), such as the application name or the login id (UID). A new connection pool is created even if you change the order of the parameters of a connection string. For example, if you have an application that performs three database operations, and the operations use the following connection strings, respectively, three pools are created, and hence three distinct database connections in SQL Azure on the same database:
Server=XYZ;Initial Catalog=DB1;UID=hroggero;PWD=123456
Server=XYZ;Initial Catalog=DB1;PWD=123456;UID=hroggero
Server=XYZ;Initial Catalog=DB1;UID=hroggero;PWD=123456;Application Name=MyApp
To ensure that the same database connection is used, you must ensure that the three operations use the exact same connection string:
Server=XYZ;Initial Catalog=DB1;UID=hroggero;PWD=123456
Server=XYZ;Initial Catalog=DB1;UID=hroggero;PWD=123456
Server=XYZ;Initial Catalog=DB1;UID=hroggero;PWD=123456
To measure the number of database connections open on a given database, you can use the sys.dm_exec_connections management view. A row is returned for each distinct database connection; the fewer rows, the better!
Sometimes you need to dig deeper and understand how SQL Azure fetches data, and then use that information to improve performance. In SQL Server, you can also use execution plans to observe the impact of changes to the underlying hardware, such as changing memory configuration. Although you have no control over configuration settings with SQL Azure, execution plans can still be very useful to see the impact of your indexes and to view which physical operators are being used.
Whereas logical operators are used in a SQL statement, such as LEFT JOIN, physical operators tell you which technique SQL Azure is using to solve a given logical operation or to fetch additional data. The most common physical operators SQL Azure uses to represent JOIN operations are listed in Table 12-4.
Table 12.4. Physical JOIN operators
You can give SQL Azure certain hints to use a specific physical operator, but using them isn't generally recommended. You have three proper ways to influence SQL Azure to select an effective physical operator:
Review your
WHEREclause. This is perhaps the most overlooked aspect of performance tuning. When you have the choice, applying theWHEREclause on the tables that have the most rows gives you new opportunities for indexing.Optimize your database design. Highly normalized databases force you to create more
JOINstatements. And of course, the moreJOINstatements, the more tuning you need to do. You shouldn't plan to have a database design at first normal form; however, in certain cases, denormalizing has its benefits.Create better indexes. Having a good indexing strategy is important. The order of your columns and the number of columns can make a world of difference for SQL Azure. This chapter reviews indexing shortly.
Note
To run the following examples, you need to execute the Tuning.sql script. It creates a few sample tables with test data. Make sure to select a user database when running this script.
To show which physical JOIN operators have been selected, execution plans provide insights into the volume of data being worked on and the relative cost of certain operations. For example, execute the following SQL statement (after running the tuning.sql script):
SELECT T.Name, T.UserType
FROM TestUsers T INNER JOIN TestUserType UT
   ON T.UserType = UT.UserType
WHERE T.AgeGroup > 0 AND UT.UserTypeKey = 'Manager'
This statement returns 25 rows. To view the execution plan, you need to request it before running the statement. Either press Ctrl + M or choose Query → Include Actual Execution Plan from the menu in SQL Server Management Studio, and re-run the SQL statement. You should now see an Execution Plan tab. Click the tab to see output similar to that shown in Figure 12-2.

In order to fully understand the previous execution plan, let's review additional symbols often seen in execution plans. Table 12-5 shows a few symbols that have clear performance implications.
Table 12.5. Lookup, index scan, and index seek operators
Operator | Symbols | Comment |
|---|---|---|
Lookup | Lookups can be costly when the statement returns thousands of rows and a lookup is needed for every row. If you determine that the lookup is costly, consider creating a covering index. | |
Index scan | An index or clustered index scan may or may not be a bad thing. Scanning means that SQL Azure reads all the records sequentially in the index. Scanning isn't good for performance if you return a fraction of the records being scanned, in which case an index is needed. But if you want to return all the records from a table, a scan is necessary. | |
Index seek | An index or clustered index seek means the first record matching the query is found quickly, without scanning. |
Execution plans can show many other symbols that have very specific meanings, including hints that a query is using multiple processors, and so on.
Because no indexes are defined on the underlying tables and the execution plan in Figure 12-2 shows two index scans, you have a potential performance problem. The INNER JOIN logical operator is executed with a hash match physical operator. You can see a thicker line coming into the hash match; hovering your cursor on this line shows you that 50 records are being consumed by the JOIN operation (see Figure 12-3). Also, you can see that a clustered index scan is being used to fetch data for both tables. Finally, note that the hash match operation consumes 73% of resources of the entire statement; this means it takes more time to JOIN the records than to read the data from disk.

In summary, the statement you've been working with has three potential issues:
Index scans. An index scan is performed on both tables, causing more reads than necessary.
Heavy operator processing. The hash match operation is consuming most of the processing time.
More reads than records returned. As you can see from Figure 12-3, the statement is processing 50 records but returning only 25. This may be a hint that you're reading more records than necessary. However, this isn't always a problem in itself—just something to keep an eye on.
Note
For those familiar with heap tables, SQL Azure doesn't allow them. If you intend to insert records into a table, a primary key must be defined on the table.
You see shortly how indexing can help you tune this statement. But before leaving the topic of execution plans, it's important to be familiar with a few more points:
Relative query cost. Notice in Figure 12-2, shown earlier, that near the top of the window, a query cost is displayed. This is a relative measure compared to all the other statements being executed as a batch. In this example, the value is 100% because it's the only statement. You should know, however, that this value can be misleading. It's calculated dynamically by SQL Server Management Studio based on estimated costs, not actual costs. As a result, this value is rarely accurate.
Advanced calls. Certain operations, such as XML calls and using functions in your SQL statements, are usually misrepresented in an execution plan; as such, SQL Azure (and even SQL Server) may return 1% as a cost for those operations. This may lead you down the wrong path when tuning your SQL statements.
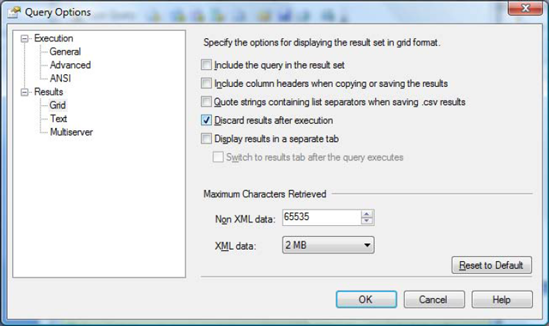
Discarding output. As discussed previously, the duration (as measured by sys.dm_exec_sessions) includes display time, and that applies to SQL Server Management Studio. To minimize the time it takes to display the data, you can disable the output by checking the necessary settings in Query → Query Options. The same option appears in two places: in the Grid and Text Results. Figure 12-4 shows how to disable the output from the Grid display.
Creating the right indexes can be complex; it can take a long time to fully understand indexing and fine-tune database queries. One of the most important things to remember with indexing is that its primary purpose is to help SQL Azure find the data it needs quickly.
Indexes are like smaller tables that contain a subset of the primary table. The tradeoff is that indexes consume space and must be maintained by the SQL Azure engine as the primary data changes, which can impact performance under certain scenarios.
Let's quickly review a simplified syntax to create an index:
CREATE INDEX [index_name] ON [table_name]
(col1, col2...)
INCLUDE (col3, col4...)
Although creating an index is simple, it's important to verify that it's being used by SQL Azure and that it has the desired effect. To continue the previous example (from Figure 12-2), you can create an index on the TestUsers table. But first, let's back up and review a few things about the table and the statement you wish to optimize.
It's important to realize that the columns included in the first part of the index are used as a key when searching for data in the index and when joining tables. And because it's acceptable to have multiple columns as part of the key, their order is absolutely critical! At times, you pick the columns that are included in the WHERE clause first and then those that are part of the JOIN. You may find, however, that sometimes it's best to start with the JOIN columns; this depends on your statement. Next come the columns in the INCLUDE section of the CREATE INDEX command; these columns are here for only one reason: they help avoid a lookup into the primary table for data that is needed by the SELECT clause. Performing lookups isn't always a performance issue, but it can become an issue if you have a lookup operation in a large batch of records.
If you dissect the previous SELECT query, you obtain the columns in the following list (in order of placement in the index) that belong to the TestUsers table:
Let's begin by creating an index that looks like this:
CREATE INDEX idx_testusers_001 ON TestUsers
   (AgeGroup, UserType)
INCLUDE (Name)
Running the statement now yields the execution plan shown in Figure 12-5. This is a better plan than the one in Figure 12-2 because SQL Azure is performing an index seek instead of an index scan. Using an index seek means SQL Azure is able to locate the first record needed by the statement very quickly. However, you still have an index scan on the TestUserType table. Let's fix that.

To remove the index scan on TestUserType, you add another index following the previous guidelines. Because no columns are needed in the SELECT clause, you can leave the INCLUDE section alone. Here's the index:
CREATE INDEX idx_testusertype_001 ON TestUserType
(UserTypeKey, UserType)
Note
Although it's minimal, there is a risk associated with adding new indexes in production systems. Certain routines, especially batch programs, typically depend on data being properly ordered to calculate running sums or carry out specific tasks. If an index is favored over another to run a query, it's possible for the new index to be used, which has the potential to change the order in which the data is returned. If all your statements include an ORDER BY clause, this problem won't affect you. But if some of your programs rely on the natural order of records, beware!
Your execution plan should now look like that in Figure 12-6. Notice that the physical operator has been changed to a loop. Also notice that the cost of the query has shifted away from the JOIN operator: the highest relative cost (76%) of the plan is spent reading the data from the TestUserType index.

But the tuning exercise isn't over just yet. If you hover your cursor on the TestUserType_001 index, you see that the loop performed a lookup (index seek) on that index 50 times (look for Number of Executions in Figure 12-7)! This isn't great, but it's probably better than without the index, because SQL Azure picked this new execution plan.
To reduce the number of lookups, you can change the order of the fields by creating a new index. Let's run this statement:
CREATE INDEX idx_testusers_002 ON TestUsers
       (UserType, AgeGroup) INCLUDE (Name)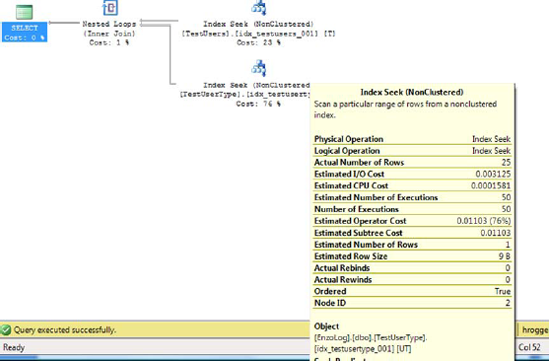
Note
Instead of creating a new index, you could change the one previously created. However, when troubleshooting database performance issues, it's important to see how the SQL Azure query engine behaves; SQL Azure chooses the index it deems the most effective. So go ahead—create as many indexes as you want until you have a good execution plan, and then clean up the unnecessary indexes when you're finished.
If you run the statement again, you see a result close to Figure 12-8. The execution plan is now well balanced. The data search is virtually equal on both tables (49%), with seek operations on both; the number of executions is 1 for both; and the cost of the loop operation is minimal (2%) because there is no real looping taking place.

If you pay attention to the Actual Number of Rows value, you see that this statement fetches only 25 records from the underlying table, instead of 50; this reduces disk reads.
Last but not least, if you were to look at the SELECT statement from a design standpoint, you could ask whether the UserTypeKey value should be unique. The table schema doesn't carry a unique index on that field, but should it? Can there be only one Manager user type? If the answer is yes, then you know the TestUserType table will always return a single record for a Manager user type, in which case you may be able to remove the JOIN entirely and apply the WHERE clause on the TestUsers table directly:
SELECT T.Name, T.UserType
   FROM TestUsers T
   WHERE T.AgeGroup > 0 AND T.UserType = 1
Not only is this statement much simpler, but the execution plan becomes trivial, meaning that SQL Azure can serve this request without spending much time optimizing it. This change means you're moving the filter from a table with few records (only 3 in TestUserType) to a table with many records (100 in TestUsers). And whenever you have the option to make such a move, you should. SQL Azure spends far fewer resources this way. Of course, such a move isn't always possible, but you need to know the importance of having a proper database design before you begin tuning.
Note
Performance tuning can be fun. However, you may end up tuning forever if you don't set yourself performance objectives.
Indexed views are an excellent alternative when you absolutely need to JOIN data, and traditional indexing doesn't yield the performance you're looking for. Indexed views behave like tables; the data covered is materialized to disk so it can be retrieved quickly. Before jumping on indexed views, understand that they have certain limitations and that due to their nature, you may incur a performance hit through the usual Insert, Delete, and Update statements. Taking the previous statement as an example, let's see how to create an indexed view to support the JOIN operation.
First, create a view that contains the statement you want to tune. Make sure you include all the columns you need in the SELECT clause:
CREATE VIEW vTestUsersType WITH SCHEMABINDING AS
      SELECT T.Name, T.UserType, T.AgeGroup, UT.UserTypeKey
      FROM dbo.TestUsers T INNER JOIN dbo.TestUserType UT ON      T.UserType = UT.UserType
Next, create a unique clustered index on the view:
CREATE UNIQUE CLUSTERED INDEX IDX_VIEW_TestUsers
ON vTestUsersType
(UserTypeKey, AgeGroup, Name, UserType)
Et voilà. When you run the statement again, you see a beautiful execution plan like the one in Figure 12-9. Because the view contains all the necessary columns, and the clustered index contains all the columns of the view, you obtain the fastest possible data-retrieval technique, next to caching.

You've seen various ways to tune your statements and improve execution plans. However, keep in mind that you also have stored procedures at your disposal.
Stored procedures can give you an edge if you need to execute logic that requires a large volume of data. Because you know that returning lots of data turns into a performance problem in SQL Azure, you can place the business logic that needs the data in a stored procedure, and have the procedure return a status code. Because you aren't charged for CPU time, this becomes an affordable option.
Stored procedures can also be an interesting security tool, allowing you proxy the calls to underlying tables through a procedure and never allowing direct access to the tables.
Imagine that you need to calculate the cost of an item; however, in order to calculate the cost, you must loop to obtain certain values and perform advanced operations. You can make a call from your application and calculate the cost in the application code as follows:
float cost = 0.0;     // the total cost
int id = 15; // the product category

string sql = "SELECT * FROM category WHERE catergoryId = " + id.ToString();
SqlConnection conn = new SqlConnection(connString);
SqlCommand cmd = new SqlCommand(sql, conn);
cmd.CommandType = CommandType.Text;
conn.Open();
SqlDataReader dr = cmd.ExecuteReader();

try
{
   while (dr.Read())
   {
      cost += 0.25 * ...; // calculation logic goes here
   }
}
finally
{
   dr.Close();
   conn.Close();
}
Or you can calculate the cost in a stored procedure and change the previous code to call the stored procedure instead:
float cost = 0.0; // the total cost
int id = 15;       // the product category

string sql = "proc_CalculateCost";
SqlConnection conn = new SqlConnection(connString);
SqlCommand cmd = new SqlCommand(sql, conn);
cmd.Parameters.Add(new SqlParameter("categoryId", SqlDbType.Float);
cmd.Parameters[0].Value = id;
cmd.CommandType = CommandType.StoredProcedure;
conn.Open();
SqlDataReader dr = cmd.ExecuteReader();

try
{
   if (dr.Read())
      cost = (float)dr[0];
}
finally
{
   dr.Close();
   conn.Close();
}
The code for the stored procedure looks something like this:
CREATE PROC proc_CalculateCost
 @categoryId int
AS

DECLARE @i intDECLARE @cost float
SET @cost = 0.0

SET @i = (SELECT count(*) FROM category WHERE ID = @categoryId)
WHILE (@i > 0)
BEGIN
   SET @cost = @cost + 0.25*(SELECT Min(dollars) FROM ...)
   SET @i = @i - 1
END

SELECT @cost
The advantage of calling a stored procedure is that you don't need to fetch the necessary records across the Internet to calculate the cost figure. The stored procedure runs where the data is located and returns only a single value in this case.
Last but not least, let's look at the ADO.NET library's performance metrics to obtain the library's point of view from a performance standpoint. The library doesn't return CPU metrics or any other SQL Azure metric; however, it can provide additional insights when you're tuning applications, such as giving you the number of roundtrips performed to the database and the number of packets transferred.
As previously mentioned, the number of packets returned by a database call is becoming more important because it can affect the overall response time of your application. If you compare the number of packets returned by a SQL statement against a regular SQL Server installation to the number of packets returned when running the same statement against SQL Azure, chances are that you see more packets returned against SQL Azure because the data is encrypted using SSL. This may not be a big deal most of the time, but it can seriously affect your application's performance if you're returning large recordsets, or if each record contains large columns (such as a varbinary column storing a PDF document).
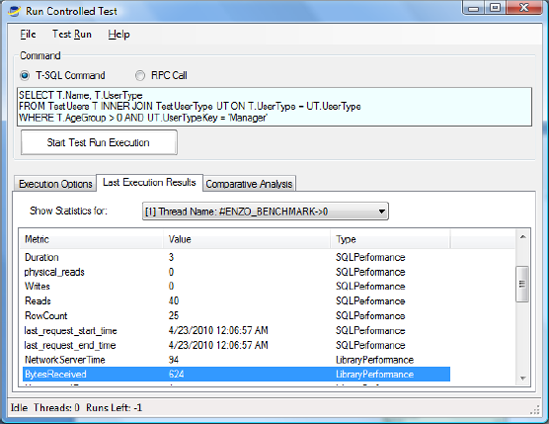
Taking the performance metrics of an ADO.NET library is fairly simple, but it requires coding. The methods to use on the SqlConnection object are ResetStatistics() and RetrieveStatistics(). Also, keep in mind that the EnableStatistics property needs to be set to true. Some of the most interesting metrics to look for are BuffersReceived and BytesReceived; they indicate how much network traffic has been generated.
You can also download from CodePlex an open source project called Enzo SQL Baseline that provides both SQL Azure and provider statistics metrics (http://EnzoSQLBaseline.CodePlex.Com). This tool allows you to compare multiple executions side by side and review which run was the most efficient. Figure 12-10 shows that the latest execution returned 624 bytes over the network.
Note
If you'd like to see a code sample using the ADO.NET provider statistics, go to http://msdn.microsoft.com/en-us/library/7h2ahss8.aspx.
Last, but certainly not least, design choices can have a significant impact on application response time. Certain coding techniques can negatively affect performance, such as excessive roundtrips. Although this may not be noticeable when you're running the application against a local database, it may turn out to be unacceptable when you're running against SQL Azure.
The following coding choices may impact your application's performance:
Chatty design. As previously mentioned, a chatty application uses excessive roundtrips to the database and creates a significant slowdown. An example of a chatty design includes creating a programmatic loop that makes a call to a database to execute a SQL statement over and over again.
Normalization. It's widely accepted that although a highly normalized database reduces data duplication, it also generally decreases performance due to the number of
JOINs that must be included. As a result, excessive normalization can become a performance issue.Connection release. Generally speaking, you should open a database connection as late as possible and close it explicitly as soon as possible. Doing so improves your chances of reusing a database connection from the pool.
Shared database account. Because SQL Azure requires a database login, you need to use a shared database account to retrieve data instead of using a per-user login. Using a per-user login prohibits the use of connection pooling and can degrade performance significantly, or even render your database unusable due to throttling.
There are many other application design considerations, but the ones listed here apply the most to programming against SQL Azure. For more information, read the following chapter from Microsoft's Patterns and Practices: http://msdn.microsoft.com/en-us/library/ff647768.aspx.
This chapter provided an overview of some of the most important tuning techniques that are available to help you address SQL Azure performance issues. As you've seen, troubleshooting and tuning statements can be complex and require various tools and methods to obtain the desired outcome. You saw a few dynamic management views and execution plans, took a quick tour of indexing, and briefly touched on the statistics provided by the ADO.NET library. You also learned about some design considerations that can affect application performance.
Many more tuning options are available in SQL Azure that couldn't fit in this chapter. You can discover additional techniques and concepts on Microsoft's web site at http://msdn.microsoft.com/en-us/library/ms190610(v=SQL.90).aspx.