
Research for this chapter found that other than a few blog and forum posts, not much information is available regarding the use of SQL Server Reporting Services (SSRS) with SQL Azure. The goal of this chapter is to provide a brief overview and example of how to use SSRS and Report Designer to build reports for SQL Azure, to discuss ways you may be able to improve your SSRS experience with SQL Azure, and to look at ways to improve reporting performance.
The main question that comes up when working with reports and SQL Azure is primarily based on where the data for the report comes from. The answer to this question isn't cut and dried—as with everything else Azure, the answer is "it depends." For example, you may end up creating a report that draws on a mix of both on-premises data and SQL Azure data.
Not every report is the same or pulls the same data. You can easily have one report that pulls all of its data from an on-premises database, another report that is 100 percent SQL Azure, and a third report that pull data from both locations.
This chapter first illustrates how to connect a report to, and pull data from, a SQL Azure database using SQL Server 2008 R2 Report Services. You then modify the example to add a subreport to pull additional report data from your local instance. This chapter assumes that you're familiar with SQL Server Reporting Services and how to create and work with reports and subreports. Plenty of great books on SSRS are available if you need an introduction.
Let's get started.
When you're creating reports that access data from SQL Azure, the process is the same as creating reports that access local data, with one slight difference: the connection to the data. These examples use SQL Server 2008 R2. It comes with Visual Studio 2008 Business Intelligence Development Studio (BIDS), and that is what you use to create and deploy the reports. To create a report, follow these steps:
Open BIDS, and create a new Report Server Project. In Figure 8-1 the project is called AzureReports, but feel free to change the name. Click OK.
Note
All the projects throughout this book have used Visual Studio 2010, which uses the .NET Framework 4.0. But because SQL Server 2008 R2 ships with Visual Studio 2008 BIDS, this example uses version 3.5 of the .NET Framework. So, don't be confused by what you see in this chapter's figures versus what you see in other chapters.
In Solution Explorer, right-click the solution, and select Add → New Item from the context menu.
In the Add New Item dialog, select the Report template, and name this report Documents, as shown in Figure 8-2. Click OK.


At this point, you're staring at a blank report, but you also see a new Report Data tab displayed in the Visual Studio IDE. Your task is to tell the report where to get its data from, and SQL Server 2008 R2 makes it very easy. Prior to SQL Server 2008 R2, you had a couple of data providers to choose from: ADO.NET (SqlClient) and OLE DB. However, R2 added a new SQL Azure–specific provider. You see this shortly.
Continue with these steps:
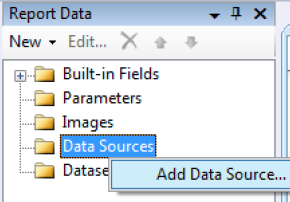
In the Report Data window, right-click the Data Sources node, and select Add Data Source from the context menu, as shown in Figure 8-3.
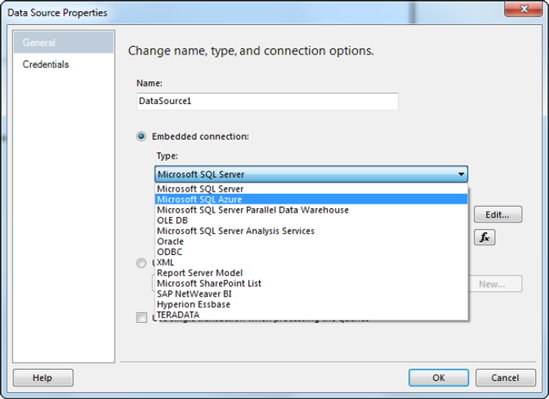
In the Data Source Properties dialog, you define the type of connection and the connection properties. Select the "Embedded connection" option, and then click the Type down arrow. You read earlier that SQL Server 2008 R2 includes SQL Azure–specific providers, and this is where you find them. As shown in Figure 8-4, select the new data provider for SQL Azure called Microsoft SQL Azure (what else are you going to call it?).
When you select this provider, the Connection String text box defaults to
Encrypt=True;TrustServerCertificate=False
Although these two parameters and associated values are defaulted for you, it's recommended that you not change them. The Encrypt parameter indicates that SQL Server will use SSL encryption for all data sent between the server and client if the server has a cert installed. The TrustServerCertificate property tells the transport layer to use SSL to encrypt the channel and bypass walking the cert chain to validate trust. When both Encrypt and TrustServerCertificate are set to True, the encryption level specified on the server is used even if the value of the Encrypt parameter in this connection string is set to False.
However, even with this default string set, you still need to add the SQL Azure connection information, so continue as follows:
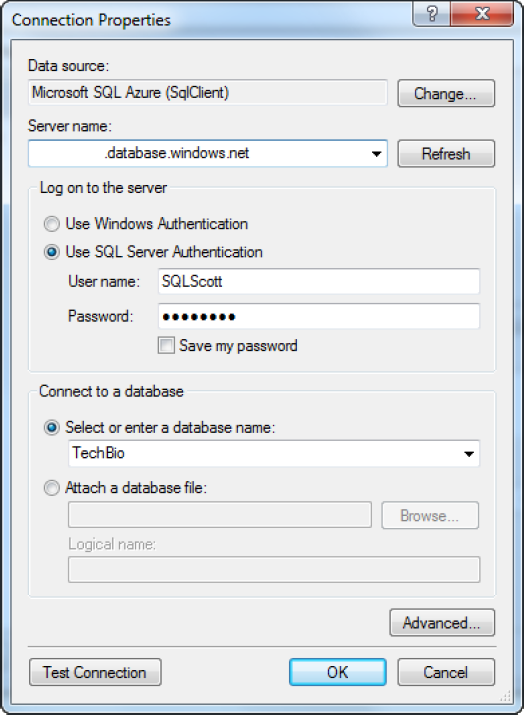
Click the Edit button to open the Connection Properties dialog, shown in Figure 8-5. Enter your SQL Azure database, username, and password. You should know by now that you can't use Windows Authentication with SQL Azure, so make sure you enter the SQL Azure account username and password.
Select (or type in) the database you want to pull the data from, and then click Test Connection to ensure that all your settings are correct.
Click OK to close this dialog and take you back to the Data Source Properties dialog. It should now look like Figure 8-6, which shows the appropriate connection type and connection string.

Granted, these steps are no different than those for connecting to a local database. But although the steps are the same, some of the key selection components are different, such as those in Figures 8-4 and 8-5, where you select the specific Microsoft SQL Azure provider and the SQL Azure–specific connection information.
Your data source definition also allows you to specify the credentials with which to connect to your data source. Selecting Credentials at left in the Data Source Properties dialog shows you four options.
Windows Authentication (integrated security)
Prompt for credentials
Specify a user name and password
Do not use credentials
Obviously, you need to use credentials, so not specifying credentials isn't the option you want. And integrated security isn't available with Azure, so that won't work either. You can either prompt for credentials or specify a username and password. The default value is to prompt for credentials; if you leave that setting, the report prompts you to enter a username and password every time you run the report. Continue as follows:
With your data source created, you now need to add a dataset for the report. For each data source, you can create one or more datasets. Each dataset specifies the fields from the data source that you would like to use in the report. The data set also contains, among other things, the query used to get the data and any query parameters to filter the data:
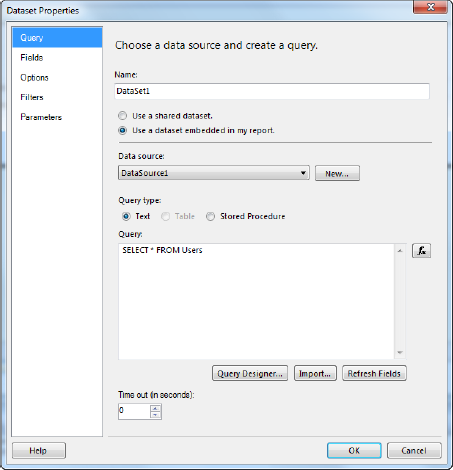
In the Report Data window, right-click the Datasets node, and select Add Dataset from the context menu. Doing so opens the Dataset Properties window, shown in Figure 8-7.
The Query page of the Dataset Properties window allows you to do two primary things: specify the data source on which this dataset is based, and specify the query type and associated query. For this example, base your dataset on the data source you created earlier. The query type is Text, meaning you type a T-SQL statement in the Query field. For this example, you want to return everything (all rows and columns) from the Users table, so enter the
SELECTstatement shown in Figure 8-7. The Name of the dataset defaults to DataSet1, which is fine for this example. Click OK.
There is nothing else you need to do for your dataset; you're ready to define and lay out your report.
With your report in Design view, you can now start laying it out. In this example you don't do anything flashy or extensive, just something simple to demonstrate your connectivity to SQL Azure. Follow these steps:
From the Toolbox, drag a text box and table onto the Report Designer window. Move the text box to the top of the report: it's the report title. Change the text in the text box to
My First Azure SSRS Report.The table you placed on the report has three columns, but you need five. Right-click any of the existing columns, and select Insert Column → Right from the context menu to add an additional column. Add one more column for a total of five.
From the Report Data window, drag the Name, Intro, Title, State, and Country columns from the dataset to the columns in the table, as shown in Figure 8-8.
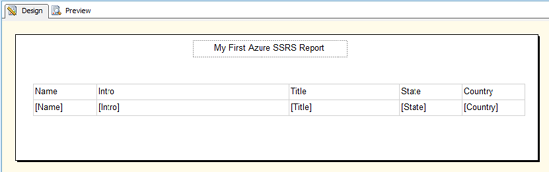
Your simple report is finished—it isn't complex or pretty, but it's functional. You're now ready to test the report: to do that, select the Preview tab. You see the result in Figure 8-9.

Figure 8-9 shows the results of your labors, displaying the Name, Intro, Title, State, and Country data from the Users table in your SQL Azure database. If your report looks like this, congratulations are in order—you just created a report that queries a SQL Azure database.
Currently, you can't deploy a report to Azure, so all reports must be deployed locally. To deploy a report, follow these steps:
Right-click the report solution, and select Properties from the context menu.
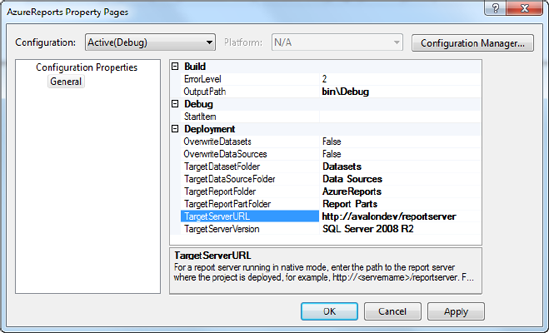
In the Property Pages dialog, the only thing you need to enter is the TargetServerURL, shown in Figure 8-10. Notice also the name of the TargetReportFolder, which in this case is
AzureReports—the name of your Visual Studio solution.Right-click the solution in Solution Explorer, and select Deploy from the context menu.
When the report has deployed successfully, open your browser, and navigate to
http://[machinename]/Reports. You should be presented with your SQL Server Reporting Services Home folder and theAzureReportsfolder. In theAzureReportsfolder is your newly created Documents report. To view the report, click the link for it.
You just walked through a simple example of creating a report that pulls data from SQL Azure. Let's modify it to add a subreport that pulls data from the on-premises database.
Your report is called Documents, but it displays users—and that's why you're going to add a subreport. You want to display all documents for the related users (one user can have multiple documents). To do this, you need to create another report and, along with it, a new data source and dataset. This time, however, you want to pull the documents from your on-premises database. Thus, the users come from SQL Azure, and the related documents from your on-premises database. Follow these steps:
You need to create the subreport to display the documents. Using the steps outlined earlier in this chapter, create a new report and an associated data source and dataset. For this exercise, the name of this new report doesn't matter. The data source should be pointed to the local, on-premises copy of the database, and the dataset should be the same as the dataset for the Azure-based report.
With the new report open in Design mode, create a new data source that points to your local (on-premises) copy of the TechBio database. This new data source can use a different authentication method if you like, such as Windows Authentication (integrated security).
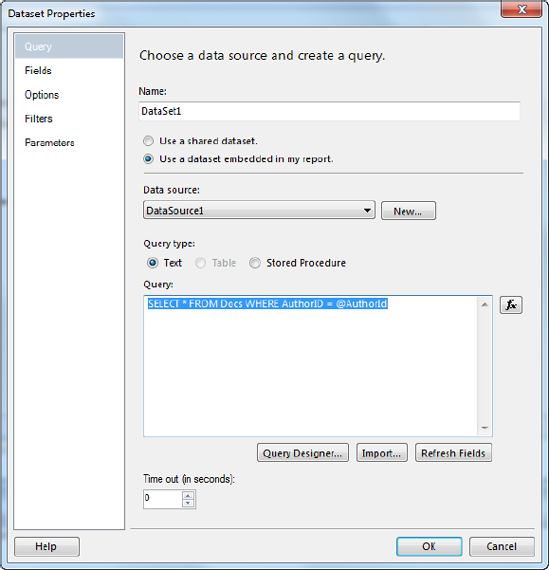
Create a new dataset based on this new data source. On the Query page in the Dataset Properties dialog, select the data source you just created, and use the Text query type. Enter the query shown in Figure 8-11: it pulls from the Docs table, and you need to apply a filter so that it gives you only the documents for the associated user. You want this to be dynamic, so your filter uses a parameter that you define shortly.
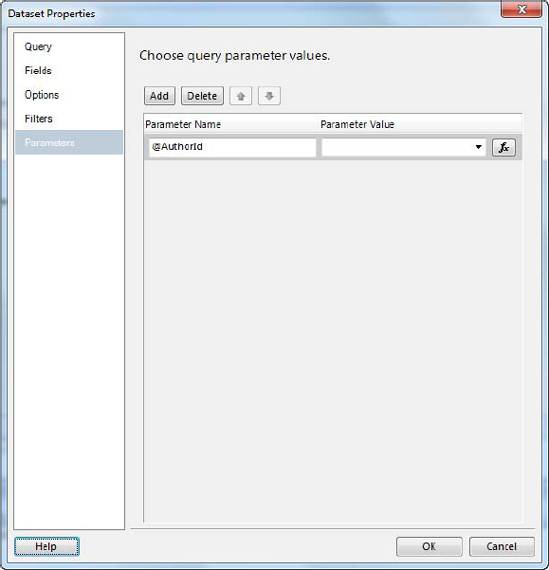
Select the Parameters page of the Dataset Properties dialog (see Figure 8-12), and notice that the parameter was added for you when you used it in the query on the Query page. It's nice to see that SSRS automatically picks up this information.
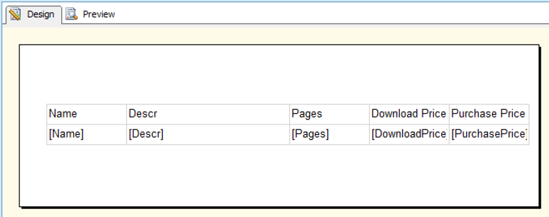
Your next step is to design your report. Back on the report, make sure the Design tab is selected, and drag a table onto the report. Again, the table has three columns by default, and you want to display five; so, add two more columns, and then center the table on the report.
From the Report Data window, drag Name, Descr, Pages, Download Price, and Purchase Price columns onto the table. When you're done, the report should look like Figure 8-13.
Test the report by selecting the Preview tab. The report prompts you for an AuthorId value: type in a valid value (111 or 113 should work). The report should display the appropriate data for the id you entered.
Now that you're confident that your subreport works, let's wire it up to the main report:
With the first report open (the Documents report), there are two ways you can add a subreport: you can either drag the report you've designated as a subreport from Solution Explorer onto the parent report, which automatically sets the appropriate properties of the subreport; or you can drag a SubReport control from the Toolbox onto the parent report and manually set the properties. How you choose to do it isn't important, as long as the appropriate properties are set; you access them by right-clicking the subreport and selecting Properties. In the Subreport Properties dialog, make sure the correct report is selected as the subreport.
Select the Parameters page, and add the parameter that is being passed from the parent report to the subreport—in this case, AuthorId.
You need to make a change to the parent report so your data is displayed correctly. Right now, the table lists all of the users. If you kept it that way, the report would list all the users and then list all the documents. Instead, you want it to list the users and associated documents, grouped by user. To do this, delete the table on the parent report and, from the Report Data window, drag the Name, Intro, and Title fields from the dataset onto the report, as shown in Figure 8-14. Now, when you run the report, it lists a user and that user's documents, as shown in Figure 8-15.


In this chapter, you've seen how to create a SQL Server Reporting Services report that gets its data from SQL Azure. You've also seen how to create a hybrid report that pulls data from both SQL Azure on an on-premises database. Chapter 9 will discuss how to deploy an ASP.NET application in Windows Azure and how to connect to it SQL Azure.