
Risk Management
Abstract
The need for risk management is emphasized with examples of successful applications. The five main stages of risk management, i.e., risk awareness, risk identification, risk assessment, risk evaluation, and risk management are described in detail, as well as risk monitoring. The advantages and disadvantages of the different risk identification methods are discussed. Diagrams of a probability/impact matrix, risk summary chart, risk exposure table, frequency/time histogram, Tornado diagram, and a risk register (risk log) are included.
Keywords
Risk management; risk awareness; risk identification; risk assessment; risk evaluation; risk monitoring; impact; probability matrix; risk register (log); Delphi technique; risk mitigation; risk owner
Chapter Outline
Every day we take risks. If we cross the street we risk being run over. If we go down the stairs, we risk missing a step and tumbling down. Taking risks is such a common occurrence that we tend to ignore it. Indeed, life would be unbearable if we constantly worried whether we should or should not carry out a certain task or take an action, because the risk is, or is not, acceptable.
With projects, however, this luxury of ignoring the risks cannot be permitted. By their very nature, because projects are inherently unique and often incorporate new techniques and procedures, they are risk prone, and risk has to be considered right from the start. It then has to be subjected to a disciplined regular review and investigative procedure known as risk management.
Before applying risk management procedures, many organizations produce a risk management plan. This is a document produced at the start of the project that sets out the strategic requirements for risk assessment and the whole risk management procedure. In certain situations the risk management plan should be produced at the estimating or contract tender stage to ensure that adequate provisions are made in the cost build-up of the tender document.
The project management plan (PMP) should include a résumé of the risk management plan, which will first of all define the scope and areas to which risk management applies, particularly the risk types to be investigated. It will also specify which techniques will be used for risk identification and assessment, whether SWOT (strengths, weaknesses, opportunities, and threats) analysis is required and which risks (if any) require a more rigorous quantitative analysis such as Monte Carlo simulation methods.
The risk management plan will set out the type, content, and frequency of reports, the roles of risk owners, and the definition of the impact and probability criteria in qualitative and/or quantitative terms covering cost, time, and quality/performance.
The main contents of a risk management plan are as follows:
• General introduction explaining the need for the risk management process;
• Project description. Only required if it is a stand-alone document and not part of the PMP;
• Types of risks. Political, technical, financial, environmental, security, safety, programme, etc.;
• Risk processes. Qualitative and/or quantitative methods, maximum number of risks to be listed;
• Tools and techniques. Risk identification methods, size of P-I matrix, computer analysis, etc.;
• Risk reports. Updating periods of risk register, exception reports, change reports, etc.;
• Attachments. Important project requirements, dangers, exceptional problems, etc.
The risk management plan of an organization should follow a standard pattern in order to increase its familiarity (rather like standard conditions of contract), but each project will require a bespoke version to cover its specific requirements and anticipated risks.
Risk management consists of the following five stages, which, if followed religiously, will enable one to obtain a better understanding of those project risks that could jeopardize the cost, time, quality, and safety criteria of the project. The first three stages are often referred to as qualitative analysis and are by far the most important stages of the process.
Stage 1: Risk Awareness
This is the stage at which the project team begins to appreciate that there are risks to be considered. The risks may be pointed out by an outsider, or the team may be able to draw on their own collective experience. The important point is that once this attitude of mind has been achieved, i.e., that the project, or certain facets of it, are at risk, it leads very quickly to …
Stage 2: Risk Identification
This is essentially a team effort at which the scope of the project, as set out in the specification, contract and WBS (if drawn), is examined and each aspect investigated for a possible risk.
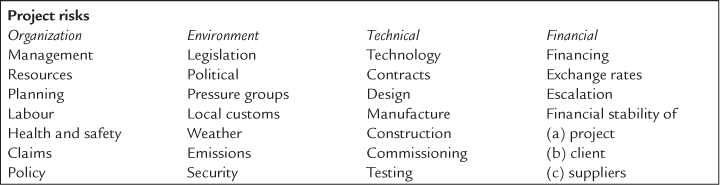
To get the investigation going, the team may have a brainstorming session and use a prompt list (based on specific aspects such as legal or technical problems) or a checklist compiled from risk issues from similar previous projects. It may also be possible to obtain expert opinion or carry out interviews with outside parties. The end product is a long list of activities that may be affected by one or a number of adverse situations or unexpected occurrences. The risks that generally have to be considered may be conveniently split into four main areas as shown in Table 15.1.Any applicable risk in each area can then be examined by a further screening process as shown by the samples given below:
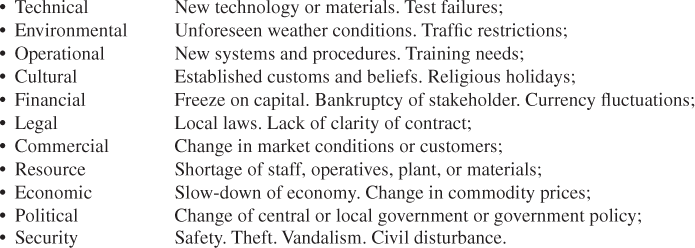
Some risks could be categorised in more than one area or section, such as civil unrest, which could be a political as well as a security problem.
Table 15.1
The following gives the advantages and disadvantages:
| Brainstorming | |
| Advantages: | Wide range of possible risks suggested for consideration Involves a number of stakeholders |
| Disadvantages: | Time consuming Requires firm control by the facilitator |
| Prompt list | |
| Advantages: | Gives benefit of past problems Saves time by focusing on real possibilities |
| Disadvantages | Restricts suggestions to past experience Past problems may not be applicable |
| Checklist | |
| Advantages: | Similar to prompt list: Company standard |
| Disadvantages | Similar to prompt list |
| Work breakdown structure | |
| Advantages: | Focused on specific project risks; |
| Quick and economical. | |
| Disadvantages: | May limit scope of possible risks. |
| Delphi technique | |
| Advantages: | Offers wide experience of experts; |
| Can be wide ranging. | |
| Disadvantages: | Time consuming if experts are far away; |
| Expensive if experts have to be paid; | |
| Advice may not be specific enough. | |
| Asking experts | |
| Advantages: | As Delphi. |
| Disadvantages: | As Delphi. |
At this stage it may be possible to identify who is the best person to manage each risk. This person becomes the risk owner.
To reduce the number of risks being seriously considered from what could well be a very long list, some form of screening will be necessary. Only those risks that pass certain criteria need be examined more closely, which leads to the next stage …
Stage 3: Risk Assessment
This is the qualitative stage at which the two main attributes of a risk, probability and impact, are examined.
The probability of a risk becoming a reality has to be assessed using experience and/or statistical data such as historical weather charts or close-out reports from previous projects. Each risk can then be given a probability rating of HIGH, MEDIUM, or LOW.
In a similar way, by taking into account all the available statistical data, past project histories, and expert opinion, the impact or effect on the project can be rated as SEVERE, MEDIUM, or LOW.
A simple matrix can now be drawn up which identifies whether a risk should be taken any further. Such a matrix is shown in Figure 15.1.

Figure 15.1 Probability versus impact table. Such a table could be used for each risk worthy of further assessment, and to assess, for example, all major risks to a project or programme.
Each risk can now be given a risk number, so that it is now possible to draw up a simple chart that lists all the risks considered so far. This chart will show the risk number, a short description, the risk category, the probability rating, the impact rating (in terms of high, medium, or low), and the risk owner who is charged with monitoring and managing the risk during the life of the project.
Figure 15.2 shows the layout of such a chart.

A quantitative analysis can now follow. This is known as …
Stage 4: Risk Evaluation
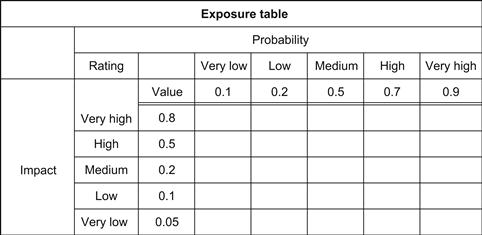
It is now possible to give comparative values, often on a scale 1 to 10, to the probability and impact of each risk and by drawing up a matrix of the risks, an order of importance or priority can be established. By multiplying the impact rating by the probability rating, the exposure rating is obtained. This is a convenient indicator that may be used to reduce the list to only the top dozen that require serious attention, but an eye should nevertheless be kept on even the minor ones, some of which may suddenly become serious if unforeseen circumstances arise.
An example of such a matrix is shown in Figure 15.3. Clearly the higher the value, the greater the risk and the more attention it must receive to manage it.
Another way to quantify both the impact and probability is to number the ratings as shown in Figure 15.4 from 1 for very low to 5 for very high. By multiplying the appropriate numbers in the boxes, a numerical (or quantitative) exposure rating is obtained, which gives a measure of seriousness and hence importance for further investigation.
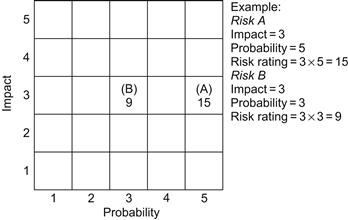
For example, if the impact is rated 3 (i.e., medium) and the probability 5 (very high), the exposure rating is 3 × 5 = 15.
Further sophistication in evaluating risks is possible by using some of the computer software developed specifically to determine the probability of occurrence. These programs use sampling techniques like ‘Monte Carlo simulations’ that carry out hundreds of iterative sampling calculations to obtain a probability distribution of the outcome.
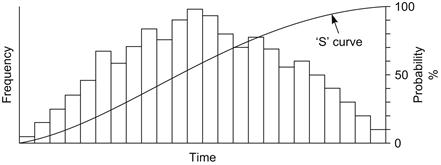
One application of the Monte Carlo simulation is determining the probability to meet a specific milestone (like the completion date) by giving three time estimates to every activity. The program will then carry out a great number of iterations resulting in a frequency/time histogram and a cumulative ‘S’ curve from which the probability of meeting the milestone can be read off (see Figure 15.5).
At the same time a Tornado diagram can be produced, which shows the sensitivity of each activity as far as it affects the project completion (see Figure 15.6).

Other techniques such as sensitivity diagrams, influence diagrams, and decision trees have all been developed in an attempt to make risk analysis more accurate or more reliable. It must be remembered, however, that any answer is only as good as the initial assumptions and input data, and the project manager must give serious consideration as to the cost effectiveness of these methods for his/her particular project.
Stage 5: Risk Management
Having listed and evaluated the risks and established a table of priorities, the next stage is to decide how to manage the risks; in other words, what to do about them and who should be responsible for managing them. For this purpose it is advisable to appoint a risk owner for every risk that has to be monitored and controlled. A risk owner may, of course, be responsible for a number or even all of the risks. There are a number of options available to the project manager when faced with a set of risks. These are:
These options are perhaps most easily explained by a simple example.
The owner of a semi-detached house decides to replace part of his roof with solar panels to save on his hot water heating bill. The risks in carrying out this work are as follows:
| Risk 1 | The installer may fall off the roof; |
| Risk 2 | The roof may leak after completion; |
| Risk 3 | The panels may break after installation; |
| Risk 4 | Birds may befoul the panels; |
| Risk 5 | The electronic controls may not work; |
| Risk 6 | The heat recovered may not be sufficient to heat the water on a cold day; |
| Risk 7 | It may not be possible to recover the cost if the house is sold within 2–3 years; |
| Risk 8 | The cost of the work will probably never pay for itself; |
| Risk 9 | The cost may escalate due to unforeseen structural problems. |
These risks can all be managed by applying one or several of the above options:
| Risk 1 | Transfer | Employ a builder who is covered by insurance; |
| Risk 2 | Transfer | Insist on a two-year guarantee for the work (at least two season cycles); |
| Risk 3 | Insurance | Add the panel replacement to the house insurance policy; |
| Risk 4 | Mitigation | Provide access for cleaning (this may increase the cost); |
| Risk 5 | Reduction | Ensure a control unit is used which has been proven for a number of years; |
| Risk 6 | Contingency | Provide for an electric immersion heater for cold spells; |
| Risk 7 | Deference | Wait 3 years before selling the house; |
| Risk 8 | Acceptance | This is a risk one must accept if the work goes ahead, or |
| Risk 8 | Avoidance | Don’t go ahead with the work; |
| Risk 9 | Sharing | Persuade the neighbour in the adjoining house to install a similar system at the same time. |
Monitoring
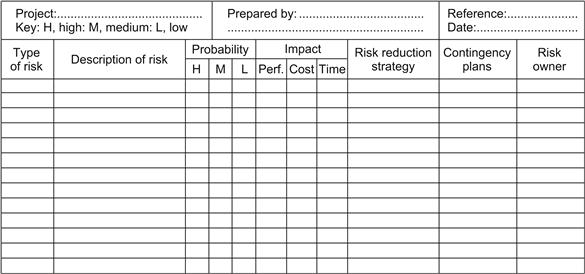
To keep control of the risks, a risk register should be produced that lists all the risks and their method of management. Such a list is shown in Figure 15.7. Where risk owners have been appointed, these will be identified on the register. The risks must be constantly monitored and at preset periods, the register must be reassessed and if necessary amended to reflect the latest position. Clearly as the project proceeds, the risks reduce in number, so that the contingency sums allocated to cover the risk of the completed activities can be allocated to other sections of the budget. These must be recorded in the register under the heading of risk closure. However, sometimes new rules emerge that must be taken into account.
The summary of the risk management procedure is then as follows:
2. Risk identification (checklists, prompt lists, brainstorming);
5. Quantification of probability;
To aid the process of risk management, a number of software tools have been developed. The most commonly used ones are @Risk, Predict, Pandora, and Plantrac Marshal, but no doubt new ones will be developed in the future.
Example of Effective Risk Management
One of the most striking and beneficial advantages of risk analysis is associated with the temporary jetties system known as Mulberry Harbour, which was towed across the Channel to support Allied landings in Normandy on D-Day, 6 June 1944.
The two jetties (A) at Gold beach for the British army and (B) at Omaha for the American army consisted of floating roadways, pontoons, and caissons, protected by breakwaters, which were pre-fabricated at numerous sites across Britain and towed across the Channel where the caissons were sunk onto the seabed. All site construction of the roadways was carried out by British and American military engineers. The harbours were completed 12 days later on 18 June, and on 19 June an enormous storm blew up, which by 22 June destroyed the American and badly damaged the British harbour.
Fortunately someone carried out a risk analysis that identified the possibility of such a disaster. As a result, the provision had been made for a large quantity of spare units to be ready at British ports to be towed out as replacements. By using these spare sections and cannibalising the wrecked American harbour, the British harbour could be repaired and until it was abandoned following the capture of Cherbourg 8 months later, more than 7000 tons of vital military supplies per day were delivered to the allied armies in France.
Positive Risk or Opportunity
Although most risks are generally regarded as negative or undesirable, and indeed most mitigation strategies have been devised to reduce the impact or probability of negative risk, there is paradoxically also such a thing as positive risk, or opportunistic risk. This is basically the risk that any entrepreneur or investor takes when he/she invests in a new enterprise. A simple case of ‘Nothing ventured, nothing gained.’ A case may also arise where a perceived negative risk becomes a positive risk or opportunity. For example, in an attempt to reduce the risk of skidding, a car manufacturer may invent an anti-skid device that can be marketed independently at a profit. If there had been no risk, there would have been no need for the antidote.
Local authorities tend to use the term “positive risk taking” when referring to the pro-active approach of providing services and facilities to certain sections of the community (usually challenged by a disability). However, apart from discussing and agreeing on their risks with clients, the process is in effect a comprehensive programme of ascertaining, prioritizing, and mitigating perceived risks before they occur.