
The following test objectives for Exam CX-310-200 are covered in this chapter
Explain how to view system processes and clear hung processes.
![]() Managing system processes is a common task for any system administrator. You should know how to use the commands that display information for all active processes on the system, and how to terminate an active or deadlocked process.
Managing system processes is a common task for any system administrator. You should know how to use the commands that display information for all active processes on the system, and how to terminate an active or deadlocked process.
Explain how to schedule an automatic one-time execution of a command and the automatic recurring execution of a command.
![]() Many processes compete for execution time so scheduling jobs to run at off-peak hours can dramatically improve system performance. The system administrator needs to understand how to use the Solaris batch processor to schedule execution of commands.
Many processes compete for execution time so scheduling jobs to run at off-peak hours can dramatically improve system performance. The system administrator needs to understand how to use the Solaris batch processor to schedule execution of commands.
The following study strategies will help you prepare for the test:
![]() Understand each of the commands in this chapter enough so that you can match the command and option with a description. Practice them on a Solaris system so that you can become familiar with the output they produce.
Understand each of the commands in this chapter enough so that you can match the command and option with a description. Practice them on a Solaris system so that you can become familiar with the output they produce.
![]() Know all the commands used to display information about a process. When viewing processes, understand each of the fields that are displayed in the output.
Know all the commands used to display information about a process. When viewing processes, understand each of the fields that are displayed in the output.
![]() Finally, understand how to schedule commands via the Solaris batch-processing facilities. Become familiar with all of the associated configuration files: what they do and how they are formatted.
Finally, understand how to schedule commands via the Solaris batch-processing facilities. Become familiar with all of the associated configuration files: what they do and how they are formatted.
Exam Alert
Managing System Processes As of this writing, the topic of managing system processes is covered lightly on the CX-310-200 exam. This could change in the future as Sun keeps updating and changing its exams. The best approach is to be prepared and learn the material thoroughly. After all, it’s a topic every system administrator needs to know to effectively perform the job.
This chapter covers Solaris processes—how to view processes, understand the effects signals have on processes, and how to manage processes.
Objective:
Explain how to view system processes.
Solaris is a multitasking environment in which a number of programs run at the same time. This means that many users can be active on the system at the same time, running many jobs (processes) simultaneously. Each Solaris program can start and stop multiple processes while it is running, but only one job is active per processor at any given time while the other jobs wait in a job queue. Because each process takes its turn running in very short time slices (much less than a second each), multitasking operating systems give the appearance that multiple processes are running at the same time. A parent process forks a child process, which, in turn, can fork other processes.
Note
Forks The term fork is used to describe a process started from another process. As with a fork in the road, one process turns into two. You’ll also see the term spawn used—the two words are interchangeable for the purposes of this subject.
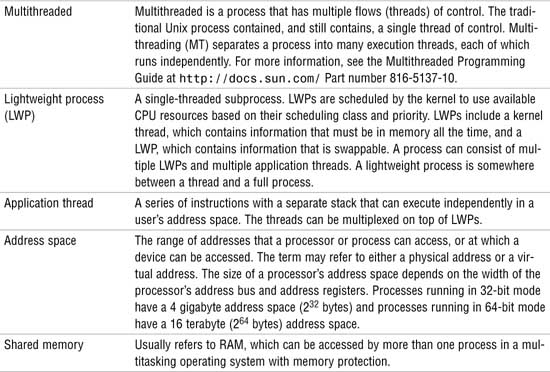
A program can be made up of many processes. A process is part of a program running in its own address space. A process under Solaris consists of an address space and a set of data structures in the kernel to keep track of that process. The address space is divided into various sections that include the instructions that the process may execute, memory allocated during the execution of the process, the stack, and memory-mapped files. The kernel must keep track of the following data for each process on the system:
![]() Address space
Address space
![]() Current status of the process
Current status of the process
![]() Execution priority of the process
Execution priority of the process
![]() Resource usage of the process
Resource usage of the process
![]() Current signal mask
Current signal mask
![]() Ownership of the process
Ownership of the process
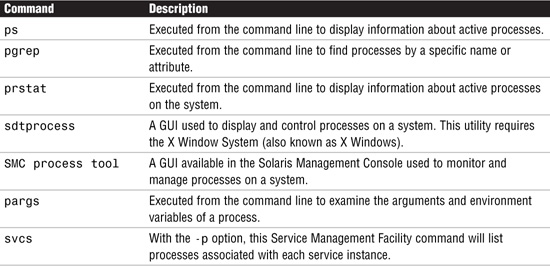
A process is distinct from a job, command, or program that can be composed of many processes working together to perform a specific task. For example, a computer-aided design application is a single program. When this program starts, it spawns other processes as it runs. When a user logs in to the program, it spawns yet other processes. Each process has a process ID associated with it and is referred to as a PID. You can monitor processes that are currently executing by using one of the commands listed in Table 5.1.
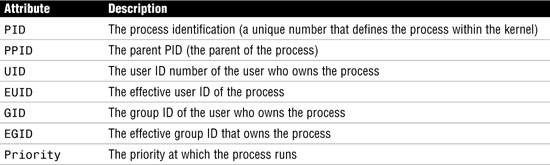
Before getting into the commands used to monitor processes, you first need to become familiar with process attributes. A process has certain attributes that directly affect execution. These are listed in Table 5.2.
Use the ps command to view processes currently running on the system. Use the ps command when you’re on a character-based terminal and don’t have access to a graphical display. Adding the -l option to the ps command displays a variety of other information about the processes currently running, including the state of each process (listed under S). The codes used to show the various process states are listed in Table 5.3.

To see all the processes that are running on a system, type the following:
ps -el
The system responds with the following output:
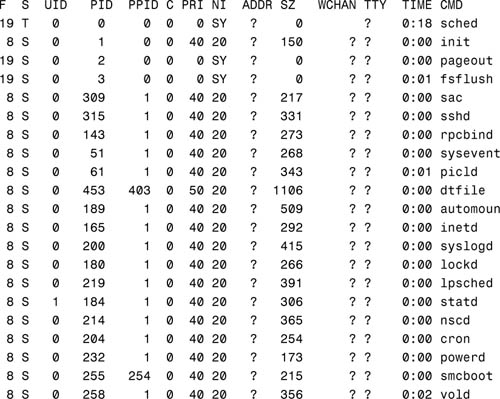
The manual page for the ps command describes all the fields displayed with the ps command, as well as all the command options. Table 5.4 lists some important fields.
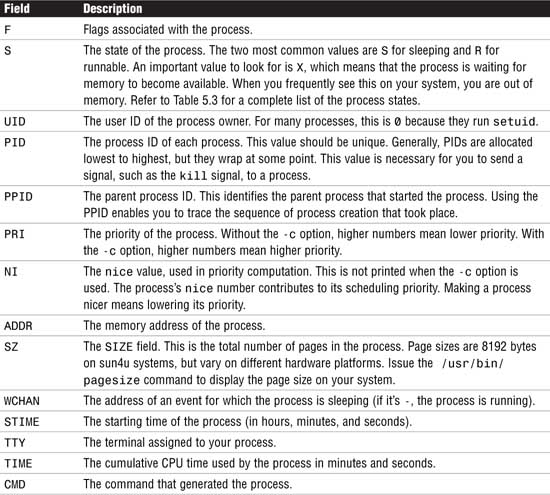
You often want to look at all processes. You can do this using the command ps -el. A number of options available with the ps command control what information gets printed. A few of them are listed in Table 5.5.
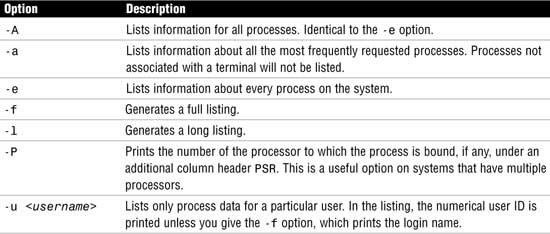
For a complete list of options to the ps command, refer to the Solaris online manual pages.
Note
sort Command The sort command is useful when you’re looking at system processes. Use the sort command as the pipe output to sort by size or PID. For example, to sort by the SZ field, use the command ps -el | sort +9 (remember, sort starts numbering fields with 0).
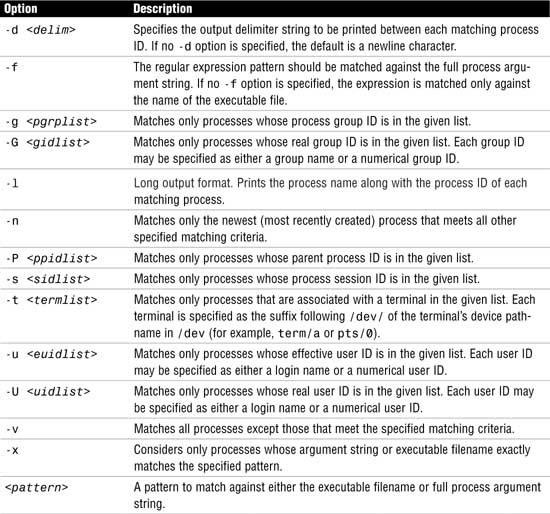
The pgrep command replaces the combination of the ps, grep, egrep, and awk commands that were used to manage processes in earlier releases of Solaris. The pgrep command examines the active processes on the system and reports the process IDs of the processes whose attributes match the criteria you specify on the command line. The command syntax for the pgrep command is shown here:
pgrep <options> <pattern>
pgrep options are described in Table 5.6.
For example, the following pgrep command finds all processes that have "dt" in the process argument string:
pgrep -l -f "dt"
The system responds with this:
500 /usr/dt/bin/dtlogin -daemon
16224 ./dtterm
438 /usr/dt/bin/dtlogin -daemon
448 /usr/openwin/bin/Xsun :0 -defdepth 24 -nobanner -auth /var/dt/A:0-p_aW2a
520 dtgreet -display :0
To find the process ID for the lpsched process, issue this command:
pgrep -l lpsched
The system responds with this:
6899 lpsched
Use the prstat command from the command line to monitor system processes. Again, like the ps command, it provides information on active processes. The difference is that you can specify whether you want information on specific processes, UIDs, CPU IDs, or processor sets. By default, prstat displays information about all processes sorted by CPU usage. Another nice feature with prstat is that the information remains on the screen and is updated periodically. The information displayed by the prstat command is described in Table 5.7.
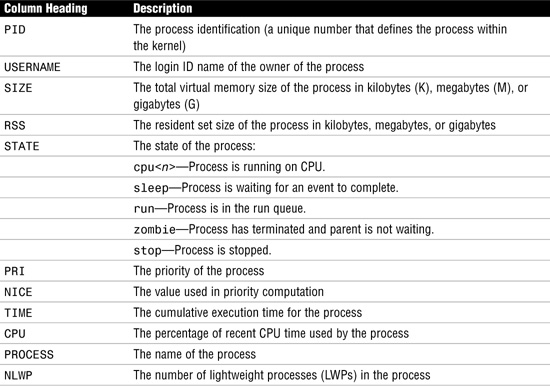
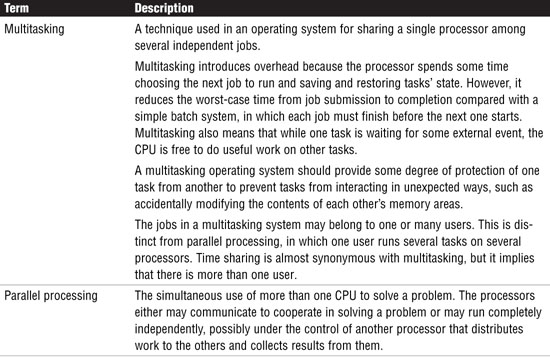
This section will introduce some new terminology, so Table 5.8 defines a few terms related to processing in general.
The syntax for the prstat command is as follows:
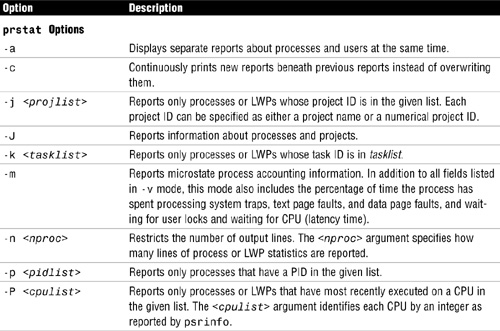
prstat [options] <count> <interval>
Table 5.9 describes a few of the prstat command options and arguments.
Note
psrinfo Command psrinfo displays one line for each configured processor, displaying whether it is online, non-interruptible, offline, or powered off, as well as when that status last changed.
The following example uses the prstat command to view the four most active root processes running. The -n option is used here to restrict the output to the top four processes. The next number, 5, specifies the sampling interval in seconds, and the last number, 3, runs the command three times:
prstat -u root -n 4 5 3
The system displays the following output:

The output updates on your display five times every three seconds.
I described projects in Chapter 4, “User and Security Administration,” where user accounts can be assigned to project groups. These projects can also be used to label workloads and separate projects and a project’s related processes from one another.
The project provides a networkwide administrative identifier for related work. A project consists of tasks, which collect a group of processes into a manageable entity that represents a workload component.
You can use the prstat command with the -J option to monitor the CPU usage of projects and the -k option to monitor tasks across your system. Therefore, you can have prstat report on the processes related to a project rather than just list all system processes. In addition, the system administrator can set processing limits on the project, such as setting a limit on the total amount of physical memory, in bytes, that is available to processes in the project. For more information on projects and resource capping, read the man pages on the following commands: rcapd(1M), project(4), rcapstat(1), and rcapadm(1M).
In the Desktop Environment (CDE & JAVA Desktop) you have access to the Process Manager GUI, sdtprocess, a graphical tool that provides a process manager window for monitoring and controlling system processes.
Exam Alert
The exam will most likely ask you about the command-line tools used to manage system processes, such as kill, pkill, pargs, and pgrep. You only need to understand that GUI tools can be used to manage processes and you should be prepared to identify these GUI tools.
The advantage of using the Process Manager is that you can view and control processes without knowing all the complex options associated with the ps and kill commands. For example, you can display processes that contain specific character strings, and you can sort the process list alphabetically or numerically. You can initiate a search using the find command, or you can terminate a process simply by highlighting it and clicking kill.
To open the Process Manager, you need to log into the Desktop windowing environment. You can start the GUI by executing the command sdtprocess, as follows:
sdtprocess &
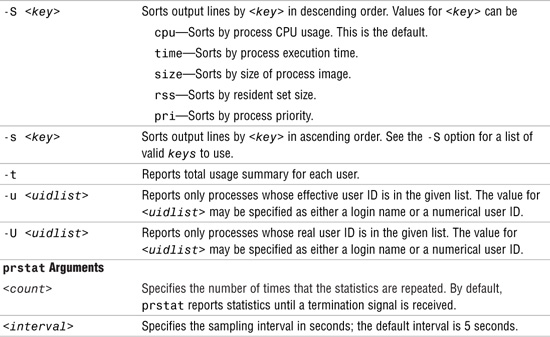
Or, you can click Find Process on the Tools subpanel, as shown in Figure 5.1.
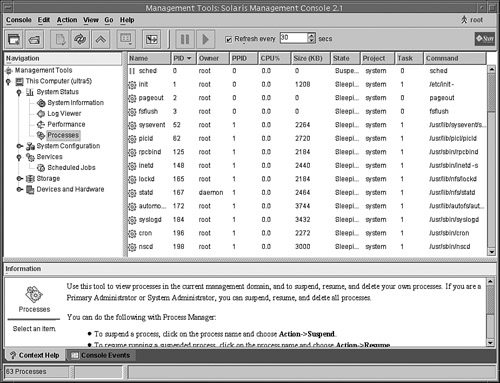
The Process Manager window opens, as shown in Figure 5.2.
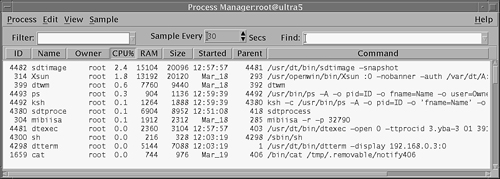
Each process attribute in the header of the Process Manager window provides detailed information about the process and is described in Table 5.10.
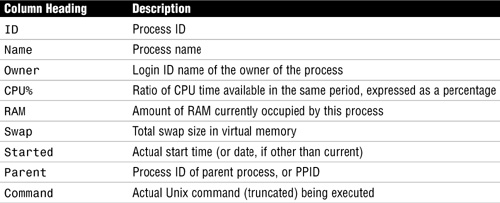
Click any of the column headings to sort the processes by that attribute. For example, click the CPU heading to sort all processes by their CPU usage. The list updates every 30 seconds, but you can enter a value in the Sampling field to update the list as frequently as you like. Finally, you can enter a text string that is common to the process entries of all the processes you want to display in the Find drop-down menu. In Figure 5.3, I entered “root” in the Find field to display all processes owned by root. I also changed the sampling rate to every 5 seconds and clicked the CPU heading to sort processes by their CPU usage.
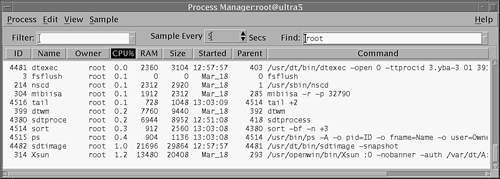
Another nice feature of the Process Manager is the capability to display the ancestry of a process. When a Unix process initiates one or more processes, these are child processes, or children. Child and parent processes have the same user ID. To view a parent process and all the child processes that belong to it, highlight the process in the Process Manager window. Click Process from the toolbar at the top of the window and select Show Ancestry, as shown in Figure 5.4.
The window shown in Figure 5.5 displays showing all the processes belonging to the parent.
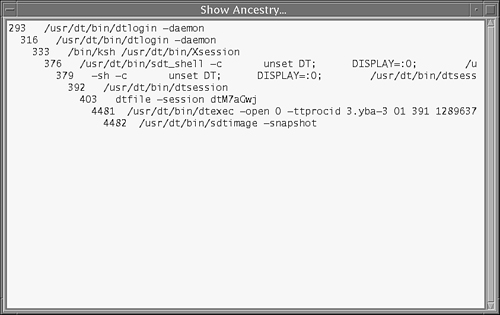
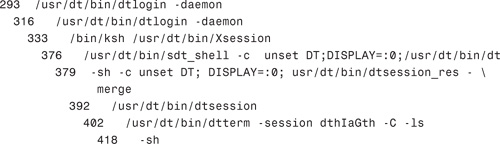
The command-line equivalent to the Ancestry selection in the Process Manager is the ptree command. Use this command when you don’t have a graphical display terminal. The ptree command displays the process ancestry trees containing the specified PIDs or users. The child processes are displayed indented from their respective parent processes. For example, here is the process tree for the -sh process, which has a PID of 293:
ptree 293
The system responds with this:
The Solaris Management Console (SMC) includes a GUI called the Process Tool, which is used for viewing and managing processes, similar to the Desktop Process Manager tool described in the previous section. You can use the job scheduler tool to
![]() Suspend a process
Suspend a process
![]() Resume a suspended process
Resume a suspended process
![]() Kill a process
Kill a process
![]() Display information about a process
Display information about a process
To open the Process Tool, follow Step by Step 5.1.
STEP BY STEP
5.1 Opening the Process Tool
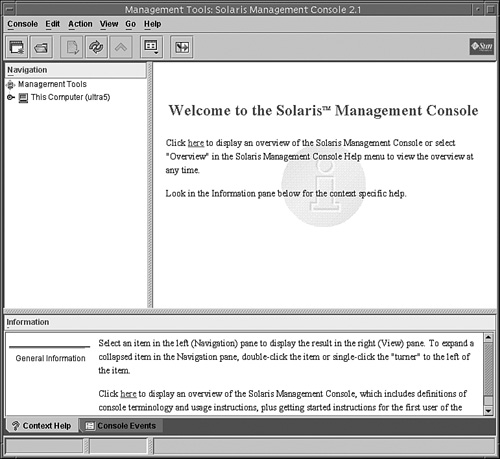
1. Start up the Solaris Management Console by typing
smc
2. The SMC Welcome window appears as shown in Figure 5.6.
3. In the SMC navigation pane, open the Process Tool by clicking on the This Computer icon, then click on the System Status icon, then click on the Processes icon as shown in Figure 5.7.
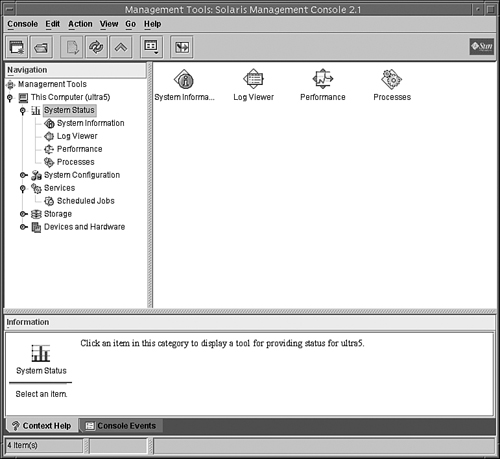
The Process Tool works much the same way as the Process Manager tool described earlier.
The pargs command is used from the command line to examine the arguments and environment variables of a process (or number of processes). pargs can also be used to examine core files.
The syntax for the pargs command is as follows:
pargs [options] pid | core
Table 5.11 describes the pargs command options and arguments.

For example, use the pargs command to view all of the environment variables associated with the telnetd process, I first need to find the PID of the telnetd process using pgrep as follows:
# pgrep telnetd
16173
Next, I issue the pargs command using the PID for the telnetd process as an argument:
# pargs -e 16173
The system responds with
16173: /usr/sbin/in.telnetd
envp[0]: SMF_RESTARTER=svc:/network/inetd:default
envp[1]: SMF_FMRI=svc:/network/telnet:default
envp[2]: SMF_METHOD=inetd_start
envp[3]: PATH=/usr/sbin:/usr/bin
envp[4]: TZ=US/Michigan
The Service Management Facility (SMF) was described in Chapter 3, “Perform System Startup and Shutdown Procedures,” so I won’t be redundant by describing it again here. However, this is just a reminder that you can use the svcs command with the -p option to list all processes associated with each service instance.
When sitting at a terminal and typing in commands, the user is typically executing foreground processes. Commands such as vi are foreground processes—they read input from the keyboard and display output to the terminal. Foreground processes maintain control of the terminal, and the user cannot do anything else in that terminal window until the execution of that command is complete.
Some processes are not interactive and don’t need to run in the foreground. These are referred to as background processes or jobs. A background process gets detached from the terminal, freeing up the terminal while it is running. When a user decides to run a process in the background, you must arrange for the process to get its input from another source. In addition, you need to arrange for the process to output to a device other than the terminal, such as a file.
To run a process in the background, enter an & (ampersand) after the command:
find . -name core -print &
After typing in this command, you’re returned to a command prompt. The find command executes in the background. One problem, however, is the standard output is still on your terminal. In other words, as the find command executes, the results still are displayed on your screen, which can become quite annoying. It’s best to redirect the output to a file, as follows:
find . -name core -print > /tmp/results &
After you put the find command in the background, the system displays two numbers associated with that process—the job number and the process ID number (PID) as follows:
[1] 14919
You use this job number to control background processes.
Note
No Job Control in the sh shell The Bourne shell does not provide job control. Job control enables you to check and manage your background jobs. Thus, with the Bourne shell, you can submit jobs to the background, but you cannot manage them. Use jsh (job shell), which provides all the functionality of sh and enables job control. The Korn shell (ksh) and the C shell (csh) both allow for job control.
The shell maintains a table containing information about processes that are currently in the background. This is referred to as the jobs table. The jobs table is unique to the user, and each user has his own jobs table. Furthermore, the jobs table contains only entries for jobs that are running in your current shell. If you start a new shell, the jobs table for the new shell is empty. Each job in the table is assigned a number that is unique to that user only. In other words, two users can each have a job numbered 1. Don’t confuse this job number with a process ID number; remember, process IDs are unique, and no two share the same number. Any jobs that the user has placed in the background are displayed here by typing in the jobs command, as follows:
jobs
The system responds with this:
![]()
The jobs table contains the following information:
![]() A numeric value for each job
A numeric value for each job
![]() A
A + (plus) symbol to designate the current job that user commands will operate on
![]() A
A - (minus) symbol to designate the next job that the user commands will operate on
![]() The status of the job
The status of the job
![]() The name of the job
The name of the job
Each job in the job table has one of the following states:
![]()
Running—An active job
![]()
Stopped—A job that has been suspended
![]()
Terminated—A job that has been killed
![]()
Done—A completed job
When the job finishes, the following is displayed on your terminal:
[1] + Done find / -name core -print > /tmp/results &
Note the job number of 1 and the status of Done.
If you want to terminate a job, use the kill command followed by a % (percent sign) and then the job number, as follows:
kill %1
Caution
Pay special attention to the use of the % (percent) symbol—it’s absolutely required. Without it, you could kill the wrong process and potentially crash the system. Get familiar with the kill command in the next section of this chapter before you use it.
If you do not enter a number following the % sign, the command acts upon the current job entry listed in the jobs table. For this example, you are going to kill job number 1, as follows:
kill %1
The following message is displayed indicating successful termination:
[1] + Terminated find / -name core -print > /tmp/results &
You can also bring a job back into the foreground with the fg command. Typing fg with no arguments brings the current job (the job with the + sign next to it in the jobs table) into the foreground. You can also specify the job by typing fg %<job number>, as follows:
fg %2
This brings job 2 back into the foreground on your terminal.
In a windowing environment such as Java Desktop System, placing jobs in the background is not an issue. Typically, you start a job in one window and open another window to continue working. Therefore, placing jobs into the background has all but disappeared unless you are working on a character-based terminal.
Objective:
Clearing hung processes.
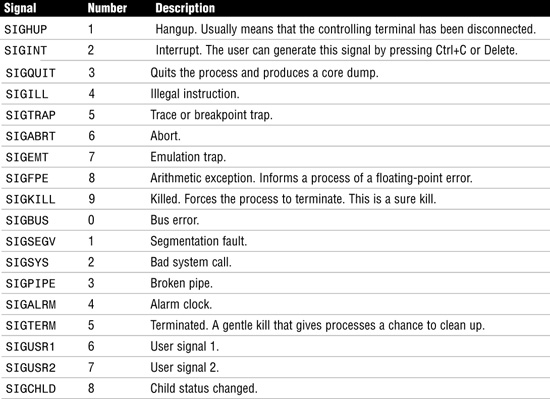
Solaris supports the concept of sending software signals to a process. These signals are ways for other processes to interact with a running process outside the context of the hardware. The kill command is used to send a signal to a process. System administrators most often use the signals SIGHUP, SIGKILL, SIGSTOP, and SIGTERM. The SIGHUP signal is used by some utilities as a way to notify the process to do something, such as re-read its configuration file. The SIGHUP signal is also sent to a process if the remote connection is lost or hangs up. The SIGKILL signal is used to abort a process, and the SIGSTOP signal is used to pause a process. The SIGTERM signal is the default signal sent to processes by commands such as k ill and pkill when no signal is specified. Table 5.12 describes the most common signals an administrator is likely to use.

Exam Alert
Don’t worry about remembering all of the signals listed; just be familiar with the more common signals, such as SIGHUP, SIGKILL, SIGSTOP, and SIGTERM.
In addition, you can write a signal handler, or trap, in a program to respond to a signal being sent. For example, many system programs, such as the name server daemon, respond to the SIGHUP signal by re-reading their configuration files. This signal can then be used to update the process while running, without having to terminate and restart the process. Signal handlers cannot be installed for SIGSTOP (23) or SIGKILL (9). Because the process cannot install a signal handler for signal 9, an otherwise well-behaved process may leave temporary files around or not be able to finish out critical operations that it is in the middle of. Thus, kill -9 invites corruption of application data files and should only be used as a last resort.
Here’s an example of how to trap a signal in a script:
trap '/bin/rm tmp$$;exit 1' 1 2 3 15
As the name suggests, trap traps system interrupt until some command can be executed. The previous example traps the signals 1, 2, 3, and 15, and executes the /bin/rm tmp$$ command before exiting the program. The example deletes all tmp files even if the program terminates abnormally.
The kill command sends a terminate signal (signal 15) to the process, and the process is terminated. Signal 15, which is the default when no options are used with the kill command, is a gentle kill that allows a process to perform cleanup work before terminating. Signal 9, on the other hand, is called a sure, unconditional kill because it cannot be caught or ignored by a process. If the process is still around after a kill -9, either it is hung up in the Unix kernel, waiting for an event such as disk I/O to complete, or you are not the owner of the process.
The kill command is routinely used to send signals to a process. You can kill any process you own, and the superuser can kill all processes in the system except those that have process IDs 0, 1, 2, 3, and 4. The kill command is poorly named because not every signal sent by it is used to kill a process. This command gets its name from its most common use—terminating a process with the kill -15 signal.
Note
Forking Problem A common problem occurs when a process continually starts up new copies of itself—this is referred to as forking or spawning. Users have a limit on the number of new processes they can fork. This limit is set in the kernel with the MAXUP (maximum number of user processes) value. Sometimes, through user error, a process keeps forking new copies of itself until the user hits the MAXUP limit. As a user reaches this limit, the system appears to be waiting. If you kill some of the user’s processes, the system resumes creating new processes on behalf of the user. It can be a no-win situation. The best way to handle these runaway processes is to send the STOP signal to suspend all processes and then send a KILL signal to terminate the processes. Because the processes were first suspended, they can’t create new ones as you kill them off.
You can send a signal to a process you own with the kill command. Many signals are available, as listed in Table 5.12. To send a signal to a process, first use the ps command to find the process ID (PID) number. For example, type ps -ef to list all processes and find the PID of the process you want to terminate:
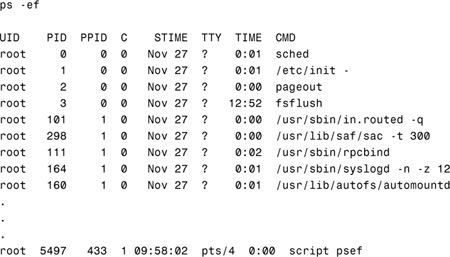
To kill the process with a PID number of 5497, type this:
kill 5497
Another way to kill a process is to use the pkill command. pkill functions identically to pgrep, which was described earlier, except that instead of displaying information about each process, the process is terminated. A signal name or number may be specified as the first command-line option to pkill. The value for the signal can be any value described in Table 5.12. For example, to kill the process named psef with a SIGKILL signal, issue the following command:
pkill -9 psef
Note
Killing a Process If no signal is specified, SIGTERM (15) is sent by default. This is the preferred signal to send when trying to kill a process. Only when a SIGTERM fails should you send a SIGKILL signal to a process. As stated earlier in this section, a process cannot install a signal handler for signal 9 and an otherwise well-behaved process might not shut down properly.
In addition, the Desktop Process Manager, which was described earlier, can be used to kill processes. In the Process Manager window, highlight the process that you want to terminate, click Process from the toolbar at the top of the window, and then select Kill from the pull-down menu, as shown in Figure 5.9.

The equivalent Unix command used by the Process Manager to terminate a process is shown here:
kill -9 <PID>
<PID> is the process ID of the selected process.
The preap command forces the killing of a defunct process, known as a zombie. In previous Solaris releases, zombie processes that could not be killed off remained until the next system reboot. Defunct processes do not normally impact system operation; however, they do consume a small amount of system memory. See the preap manual page for further details of this command.
Processes compete for execution time. Scheduling, one of the key elements in a time-sharing system, determines which of the processes executes next. Although hundreds of processes might be present on the system, only one actually uses a given CPU at any given time. Time sharing on a CPU involves suspending a process and then restarting it later. Because the suspension and resumption of active processes occurs many times each second, it appears to the user that the system is performing many tasks simultaneously.
Unix attempts to manage the priorities of processes by giving a higher priority to those that have used the least amount of CPU time. In addition, processes that are waiting on an event, such as a keyboard press, get higher priority than processes that are purely CPU-driven.
On any large system with a number of competing user groups, the task of managing resources falls to the system administrator. This task is both technical and political. As a system administrator, you must understand your company goals to manage this task successfully. When you understand the political implications of who should get priority, you are ready to manage the technical details. As root, you can change the priority of any process on the system by using the nice or priocntl commands. Before you do this, you must understand how priorities work.
All processes have assigned to them an execution priority—an integer value that is dynamically computed and updated on the basis of several different factors. Whenever the CPU is free, the scheduler selects the most favored process to resume executing. The process selected is the one with the lowest-priority number because lower numbers are defined as more favored than higher ones. Multiple processes at the same priority level are placed in the run queue for that priority level. Whenever the CPU is free, the scheduler starts the processes at the head of the lowest-numbered nonempty run queue. When the process at the top of a run queue stops executing, it goes to the end of the line and the next process moves up to the front. After a process begins to run, it continues to execute until it needs to wait for an I/O operation to complete, receives an interrupt signal, or exhausts the maximum execution time slice defined on that system. A typical time slice is 10 milliseconds.
A Unix process has two priority numbers associated with it. One of the priority numbers is its requested execution priority with respect to other processes. This value (its nice number) is set by the process’s owner and by root; it appears in the NI column in a ps -1 listing. The other priority assigned to a process is the execution priority. This priority is computed and updated dynamically by the operating system, taking into account such factors as the process’s nice number, how much CPU time it has had recently, and other processes that are running and their priorities. The execution priority value appears in the PRI column on a ps -1 listing.
Although the CPU is the most-watched resource on a system, it is not the only one. Memory use, disk use, I/O activity, and the number of processes all tie together in determining the computer’s throughput. For example, suppose you have two groups, A and B. Both groups require large amounts of memory—more than is available when both are running simultaneously. Raising the priority of Group A over Group B might not help if Group B does not fully relinquish the memory it is using. Although the paging system does this over time, the process of swapping a process out to disk can be intensive and can greatly reduce performance. A better alternative might be to completely stop Group B with a signal and then continue it later, when Group A has finished.
The nice command is supported only for backward compatibility with previous Solaris releases. The priocntl command provides more flexibility in managing processes. The priority of a process is determined by the policies of its scheduling class and by its nice number. Each time-sharing process has a global priority that is calculated by adding the user-supplied priority, which can be influenced by the nice or priocntl commands, and the system-calculated priority.
The execution priority number of a process is assigned by the operating system and is determined by several factors, including its schedule class, how much CPU time it has used, and its nice number. Each time-sharing process starts with a default nice number, which it inherits from its parent process. The nice number is shown in the NI column of the ps report.
A user can lower the priority of a process by increasing its user-supplied priority number. Only the superuser can increase the priority of a process by lowering its nice value. This prevents users from increasing the priorities of their own processes, thereby monopolizing a greater share of the CPU.
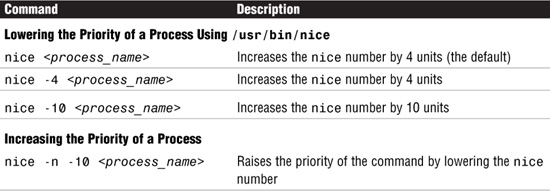
Two versions of the nice command are available: the standard version, /usr/bin/nice, and a version that is integrated into the C shell as a C shell built-in. /usr/bin/nice numbers range from 0 to +39 and the default value is 20, while the C-shell built-in version of nice has values that range from –20 to +20. The lower the number, the higher the priority and the faster the process runs.
Use the /usr/bin/nice command as described in Table 5.13 when submitting a program or command.
Note
Root may run commands with a priority higher than normal by using a negative increment, such as -10. A negative increment assigned by an unprivileged user is ignored.
As a system administrator, you can use the renice command to change the priority of a process after it has been submitted. The renice command has the following form:
renice priority -n <value> -p <pid>
Use the ps -el command to find the PID of the process for which you want to change the priority. The process that you want to change in the following example is named largejob:
![]()
Issue the following command to increase the priority of PID 8200:
renice -n -4 -p 8200
Issuing the ps -el command again shows the process with a higher priority:
![]()
The standard priority scheme has been improved since earlier versions of Solaris as part of its support for real-time processes. Real-time processes are designed to work in application areas in which a nearly immediate response to events is required. These processes are given nearly complete access to all system resources when they are running. Solaris uses time-sharing priority numbers ranging from -20 to 20. Solaris uses the priocntl command, intended as an improvement over the nice command, to modify process priorities. To use priocntl to change a priority on a process, type this:
priocntl -s -p <new-priority> -i pid <process-id>
new-priority is the new priority for the process, and process-id is the PID of the process you want to change.
The following example sets the priority level for process 8200 to -5:
priocntl -s -p -5 -i pid 8200
The following example is used to set the priority (nice value) for every process created by a given parent process:
priocntl -s -p -5 -I ppid 8200
As a result of this command, all processes forked from process 8200 have a priority of -5.
The priority value assigned to a process can be displayed using the ps command, which was described earlier in this chapter.
The functionality of the priocntl command goes much further than what is described in this section. Consult the online manual pages for more information about the priocntl command.
The Fair Share Scheduler (FSS) in Solaris 10 can be used to control the allocation of resources. The Fixed Scheduler (FX) is a fixed priority scheduler that provides an ensured priority for processes. Neither of these are objectives on the CX-310-200 exam and they are not covered in this chapter.
A way to divide processes on a busy system is to schedule jobs so that they run at different times. A large job, for example, could be scheduled to run at 2:00 a.m., when the system would normally be idle. Solaris supports two methods of batch processing: the crontab and at commands. The crontab command schedules multiple system events at regular intervals, and the at command schedules a single system event.
Objective:
Explain how to schedule the automatic recurring execution of a command.
cron is a Unix utility named after Chronos (“time”), the ancient Greek god of time. It enables you to execute commands automatically according to a schedule you define. The cron daemon schedules system events according to commands found in each crontab file. A crontab file consists of commands, one per line, that will be executed at regular intervals. The beginning of each line contains five date and time fields that tell the cron daemon when to execute the command. The sixth field is the full pathname of the program you want to run. These fields, described in Table 5.14, are separated by spaces.

Follow these guidelines when making entries in the crontab file:
![]() Use a space to separate fields.
Use a space to separate fields.
![]() Use a comma to separate multiple values in any of the date or time fields.
Use a comma to separate multiple values in any of the date or time fields.
![]() Use a hyphen to designate a range of values in any of the date or time fields.
Use a hyphen to designate a range of values in any of the date or time fields.
![]() Use an asterisk as a wildcard to include all possible values in any of the date or time fields. For example, an asterisk (
Use an asterisk as a wildcard to include all possible values in any of the date or time fields. For example, an asterisk (*) can be used in the first five fields (time fields) to mean all legal values.
![]() Use a comment mark (
Use a comment mark (#) at the beginning of a line to indicate a comment or a blank line.
![]() Each command within a
Each command within a crontab file must consist of one line, even if it is very long, because crontab does not recognize extra carriage returns.
![]() There can be no blank lines in the
There can be no blank lines in the crontab file.
The following sample crontab command entry displays a reminder in the user’s console window at 5:00 p.m. on the 1st and 15th of every month:
0 17 1,15 * * echo Hand in Timesheet > /dev/console
crontab files are found in the /var/spool/cron/crontabs directory. Several crontab files besides root are provided during the SunOS software installation process; they are also located in this directory. Other crontab files are named after the user accounts for which they are created, such as bill, glenda, miguel, or nicole. They also are located in the /var/spool/cron/crontabs directory. For example, a crontab file named root is supplied during software installation. Its contents include these command lines:
10 3 * * * /usr/sbin/logadm
15 3 * * 0 /usr/lib/fs/nfs/nfsfind
30 3 * * * [ -x /usr/lib/gss/gsscred_clean ] && /usr/lib/gss/gsscred_clean
#10 3 * * * /usr/lib/krb5/kprop_script ___slave_kdcs___
The first command line instructs the system to run logchecker at 3:10 a.m. on Sunday and Thursday. The second command line orders the system to execute nfsfind on Sunday at 3:15 a.m. The third command line runs each night at 3:30 a.m. and executes the gsscred command. The fourth command is commented out. The cron daemon never exits and is started via the svc:/system/cron:default service. The /etc/cron.d/FIFO file is used as a lock file to prevent running more than one instance of cron.
Creating an entry in the crontab file is as easy as editing a text file using your favorite editor. Use the steps described next to edit this file; otherwise, your changes are not recognized until the next time the cron daemon starts up. cron examines crontab configuration files only during its own process-initialization phase or when the crontab command is run. This reduces the overhead of checking for new or changed files at regularly scheduled intervals.
Step by Step 5.2 tells you how to create or edit a crontab file.
STEP BY STEP
5.2 Creating or Editing a crontab File
1. (Optional) To create or edit a crontab file belonging to root or another user, become superuser.
2. Create a new crontab file or edit an existing one by typing the following:
crontab -e
Note
crontab Default Editor The crontab command chooses the system default editor, which is ed, unless you’ve set the VISUAL or EDITOR variable to vi (or another editor), as follows:
EDITOR=vi;export EDITOR
3. Add command lines to the file, following the syntax described in Table 5.14. Because cron jobs do not inherit the users environment, such as PATH, you should specify the full pathname for commands.
4. Save the changes and exit the file. The crontab file is placed in /var/spool/cron/crontabs.
5. Verify the crontab file by typing the following:
crontab -1
The system responds by listing the contents of the crontab file.
You can control access to crontab by modifying two files in the /etc/cron.d directory: cron.deny and cron.allow. These files permit only specified users to perform crontab tasks such as creating, editing, displaying, and removing their own crontab files. The cron.deny and cron.allow files consist of a list of usernames, one per line. These access control files work together in the following manner:
![]() If
If cron.allow exists, only the users listed in this file can create, edit, display, and remove crontab files.
![]() If
If cron.allow doesn’t exist, all users may submit crontab files, except for users listed in cron.deny.
![]() If neither
If neither cron.allow nor cron.deny exists, superuser privileges are required to run crontab.
Superuser privileges are required to edit or create cron.deny and cron.allow.
During the Solaris software installation process, a default /etc/cron.d/cron.deny file is provided. It contains the following entries:
![]()
daemon
![]()
bin
![]()
nuucp
![]()
listen
![]()
nobody
![]()
noaccess
None of the users listed in the cron.deny file can access crontab commands. The system administrator can edit this file to add other users who are denied access to the crontab command. No default cron.allow file is supplied. This means that, after the Solaris software installation, all users (except the ones listed in the default cron.deny file) can access crontab. If you create a cron.allow file, only those users can access crontab commands.
Objective:
Explain how to schedule an automatic one-time execution of a command.
The at command is used to schedule jobs for execution at a later time. Unlike crontab, which schedules a job to happen at regular intervals, a job submitted with at executes once, at the designated time.
To submit an at job, type at. Then specify an execution time and a program to run, as shown in the following example:
at 07:45am today
at> who > /tmp/log
at> <Press Control-d>
job 912687240.a at Thu Jun 6 07:14:00
When you submit an at job, it is assigned a job identification number, which becomes its filename along with the .a extension. The file is stored in the /var/spool/cron/atjobs directory. In much the same way as it schedules crontab jobs, the cron daemon controls the scheduling of at files.
The command syntax for at is shown here:
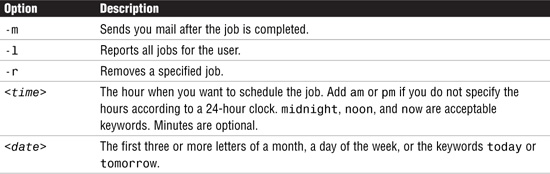
at -m <time> <date>
The at command is described in Table 5.15.
You can set up a file to control access to the at command, permitting only specified users to create, remove, or display queue information about their at jobs. The file that controls access to at is /etc/cron.d/at.deny. It consists of a list of usernames, one per line. The users listed in this file cannot access at commands. The default at.deny file, created during the SunOS software installation, contains the following usernames:
![]()
daemon
![]()
bin
![]()
smtp
![]()
nuucp
![]()
listen
![]()
nobody
![]()
noaccess
With superuser privileges, you can edit this file to add other usernames whose at access you want to restrict.
To check your jobs that are waiting in the at queue, use the atq command. This command displays status information about the at jobs you created. Use the atq command to verify that you have created an at job. The atq command confirms that at jobs have been submitted to the queue, as shown in the following example:
atq
The system responds with this:
![]()
Another way to check an at job is to issue the at -1 command. This command shows the status information on all jobs submitted by a user, as shown in this example:
at -1
The system responds with this:
![]()
To remove the at job from the queue before it is executed, type this:
at -r [job-id]
job-id is the identification number of the job you want to remove.
Verify that the at job has been removed by using the at -1 (or atq) command to display the jobs remaining in the at queue. The job whose identification number you specified should not appear. In the following example, you’ll remove an at job that was scheduled to execute at 8:00 a.m. on June 6. First, check the at queue to locate the job identification number:
at -1
The system responds with this:
![]()
Next, remove the job from the at queue:
at -r 912690000.a
Finally, verify that this job has been removed from the queue:
at -1
The system responds with this:
user = root 912690300.a Thu Jun 6 08:05:00
The Solaris Management Console (SMC) includes a graphical tool to create and schedule jobs on your system. You can use the Job Scheduler Tool to
![]() View and modify job properties
View and modify job properties
![]() Delete a job
Delete a job
![]() Add a scheduled job
Add a scheduled job
![]() Enable or disable job logging
Enable or disable job logging
To open the Job Scheduler, follow the steps described in the “SMC Process Tool” section to start up the SMC using the smc command.
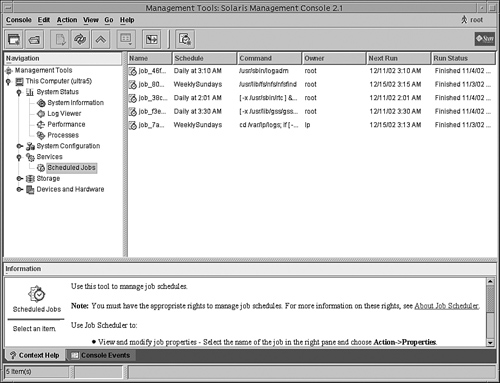
1. In the Navigation pane of the SMC Welcome window, open the Job Scheduler by clicking on the This Computer icon, then click on the Services icon, and then click on the Scheduled Jobs icon as shown in Figure5.10.
2.
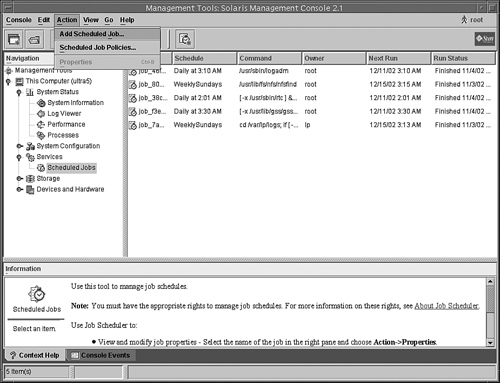
You can add jobs to the crontab by selecting Action from the top toolbar as shown in Figure 5.11.
3. Modify a cron job by double clicking on the job in the main window pane as shown in Figure 5.12.

This chapter described Solaris processes and the various Solaris utilities available to monitor them. Using commands such as ps, prstat, pargs, sdtprocess, and the SMC Process Tool, you can view all the attributes associated with a process. In addition, we described foreground and background jobs.
The concept of sending signals to a process was described. A signal is a message sent to a process to interrupt it and cause a response or action. You also learned how to send signals to processes to cause a response such as terminating a process.
Setting process priorities was described. We also described the concept of projects and tasks along with administrative commands used to administer them. The various commands, such as nice and priocntl, that are used to set and change process priorities were described. In addition, you learned how to use the crontab and at facilities. You can use these facilities to submit batch jobs and schedule processes to run when the system is less busy, to reduce the demand on resources such as the CPU and disks.
The system administrator needs to be aware of the processes that belong to each application. As users report problems, the system administrator can quickly locate the processes being used and look for irregularities. By keeping a close watch on system messages and processes, you’ll become familiar with what is normal and what is abnormal. Don’t wait for problems to happen—watch system messages and processes daily. Create shell scripts to watch processes for you and to look for irregularities in the system log files. By taking a proactive approach to system administration, you’ll find problems before they affect the users.
In Chapter 6, “Managing the LP Print Service,” we’ll explore another topic that you’ll need to become acquainted with—the LP Print Service, the facility responsible for printing within the Solaris environment.
In this exercise, you’ll use the various utilities described in this chapter to display information about active processes.
Estimated time: 10 minutes
1. Log in as root into the Java Desktop Environment or CDE.
2. Open a new window and display the active processes using the ps command:
ps -ef
3. Open another new window and display the active processes using the prstat command:
prstat
Notice how the ps command took a snapshot of the active processes, but the prstat command continues to update its display.
4. Type q to exit prstat.
5. Display the dtlogin process and all of its child processes. First obtain the PID of the dtlogin process with the pgrep command:
pgrep dtlogin
Now use the ptree command with the PID of the dtlogin process to display the ancestry tree:
ptree <PID from dtlogin>
6. Now start the Process Manager.
sdtprocess &
Notice how the window updates periodically.
7. In the sample field at the top of the window, change the sample period from 30 to 5 seconds.
8. Sort the processes by ID by clicking on the ID button in the header.
In this exercise, you’ll use crontab to configure a process to execute everyday at a specified time.
Estimated time: 10 minutes
1. Log in as root into a Java Desktop or CDE session.
2. Make sure your default shell editor is set to vi (EDITOR=vi;export EDITOR) before beginning this exercise.
3. Open a new window and edit the crontab entry.
crontab -e
4. Enter the following after the last line at the end of the file:
0 11 * * * echo Hand in Timesheet > /dev/console
5. Save and close the file.
Open a console window and at 11:00 a.m., you’ll see the message Hand in Timesheet displayed.
Answers to Exam Questions
|
1. |
A, D. Use the |
|
2. |
A. The command |
|
3. |
B, C. The |
|
4. |
A. In output from the |
|
5. |
C. In output from the |
|
6. |
D. The |
|
7. |
A. The |
|
8. |
A. The command |
|
9. |
A. Signal 9 stops a process unconditionally. |
|
10. |
A, B. The commands |
|
11. |
A. The |
|
12. |
B, C. The utilities |
|
13. |
C. The |
|
14. |
A, B. The |
|
15. |
B. The |
|
A. The log file named |
|
|
17. |
B. Use the |
|
18. |
B. Users can manage jobs if their name appears in the |