8. Technology That Supports Instrumenting the Planet
8.1. Challenges on the Path to an Instrumented World
The potential challenges associated with instrumenting the planet require numerous nontrivial needs to be met. Achieving strategic change, operational change, and cultural change in organizations is undoubtedly as much a challenge in this area as any other where significant transformation occurs, as discussed earlier in Section 2.2 of Chapter 2, “Formulate Green Strategy to Complement Traditional Strategy.” However, because technology plays such a central role in an instrumented world, its challenges are particularly important for enterprises to understand and address.
Among the technical challenges is the integration of disparate models and data sources. Establishing metadata and data standards, data-filtering methods, erratic data-detection and correction processes, sensor network maintenance processes and procedures, model aggregation rules, standard interfaces, autocalibration and recalibration mechanisms, and fail-safe system designs are only a few of the needs that must be met.
8.1.1. Meeting the Need for Standard Interfaces to Support Mathematical Models
Computer models are frequently customized for a specific user before they are implemented, although examples also exist of simulation software that is widely shared. Customization often limits the capability to share or jointly develop models across different users. The need for a standardized modeling adapter, or translator, that includes a standard data model and requirements for each domain is an important one. A standard technology architecture for storing and extracting the data; standard processes for collecting, testing, and “cleansing” the data (that is, filtering the data to remove inappropriate elements); and standard methods for preparing the data for use by the models are also needed. Although the task of achieving such convergence is far from trivial, some industries have made similar advancements. For example, researchers resolved many differences in various standards associated with genomics research in the early 1990s, greatly facilitating the work of scientists in that field. Similarly, widespread adoption of Universal Product Code (UPC) numbers and associated bar codes in the retail industry has made countless processes more efficient over the last few decades.
One example of a modeling system that provides some of the functionality from such an adapter is the Spatiotemporal Epidemiological Modeler (STEM),[1] developed at IBM Research. STEM provides a standard modeling interface for epidemiological models and facilitates the development of advanced mathematical models for epidemiology. Although the domain is different from those in environmental stewardship, the principles are similar.
Another example that supports environmental stewardship comes from the Geophysical Fluid Dynamics Laboratory at Princeton University: Researchers there developed the Flexible Modeling System,[2] a software framework for the efficient development, construction, execution, and scientific interpretation of atmospheric, oceanic, and climate system models. An alternative framework is the Earth System Modeling Framework,[3, 4], jointly funded by the United States Department of Defense, the National Aeronautics and Space Administration (NASA), the National Science Foundation, and the National Oceanic and Atmospheric Administration (NOAA). Some progress has clearly been made in this area, but more work is needed.
8.1.2. Establishing Consistency Among Fragmented Data Sources
To study interactions between systems (such as between weather and power grid systems, or between atmospheric and hydrological systems), data sources from different fields of research must be combined. However, data from different sources are often inconsistent. For example, inconsistencies might exist in the frequency and density of the data, or in the definition and precision of the data itself.
To illustrate this need in one area, Xu, et al.,[5] anticipate that, in the near future, studies in which both climatologists and hydrologists address the same problem at the same time will lead to significantly improved predictions. The implication is that greater interdisciplinary dialogue and collaboration are needed to integrate disparate models and data that supports the models.
8.1.3. Sharing Data and Using Distributed Collaboration Tools
In a world where people are increasingly aware of the benefits associated with shared information and knowledge, a natural advancement is collecting and assembling information provided by many different individuals and enterprises to achieve a “network effect.” This shared data can provide value far beyond the value of private information available to any of the individual contributing entities themselves. For example, in the financial services industry, Moody’s ratings[6] on bonds became sufficiently established to be required for any financial services offering. An instrumented world could face similarly important pressures for gathering data on, for example, carbon or water efficiency, to ensure that the information reaches a public utility where it can become a resource for others to use and compare. Even some business models, such as that of YouTube.com, are founded on the principle that value can come from sharing data from a wide range of disparate sources while conforming to certain standards. The Carbon Rating Agency (CRA) and Bloomberg already provide uniform information about the carbon market and integrate that data with analytic tools to help organizations make informed decisions about carbon offset trading. Information is made available across a range of carbon-reduction projects[7]. The Climate Disclosure Project (CDP) is another organization that maintains a database of corporate climate change information and provides primary climate-change data to the global marketplace.
Researchers might also require a means of visualizing data supplied from various groups or individuals. IBM Many Eyes has explored one approach, derived from social-networking methods and applied to data analysis[8]. This work allows people to share and analyze data, with collaboration adding value to insights from the data.
An instrumented world not only provides the technology needed to collect, store, and disseminate data from sensor networks, but also enables the analytic capability to generate solutions that decision makers and policy makers can use to improve the efficiency with which they manage constrained resources. Mathematical models are already being applied in many ways to provide the analytical capabilities needed. Still, some important challenges remain in creating an instrumented world.
8.2. Real World–Aware Systems and Interactive Models
Real world–aware (RWA) computing provides the bridge that captures the state of the actual world and extracts insights for decision making to enable an instrumented world. Three important drivers for instrumenting the planet that we have already discussed are the availability of detailed sensing data in real time, the need to manage and optimize the use of scarce natural resources, and the availability of advanced modeling techniques that offer guidance on how to more efficiently use scarce resources and provide advance warning of shortages.
A fourth enabling driver is the emergence and growing use of real world–aware information technologies for adaptive, automated control of manufacturing, mining, transport, distribution, and other processes that integrate with enterprise business information records, policies, and processing systems. Real world–aware processing builds on optimization and control modeling and might also incorporate simulation. It is relevant to many of the application areas discussed previously, particularly in demand-driven electricity and water resource management, as well as optimal traffic and public transportation management.
Well-established business information systems focus on the reliable, transactional processing and storage of business information, such as requests to transfer funds, make travel reservations, and order goods. Real world–aware systems in an instrumented world extend this type of functionality by tightly coupling traditional business information processing with the current state of the world. They also use stream (continuous) processing to link the real world and the business processing functions. This capability enables leaders to make more informed business decisions and enables optimization based on current information instead of static, historical reporting. Business operations benefit from enterprisewide optimization, policy guidance, and analytics that use information from such networked devices as automated sensors, actuators, and RFID systems.
Figure 8.1 shows the topology of a real world–aware system. It is organized into an edge domain, a stream-processing domain, and a transactional and business-processing domain.
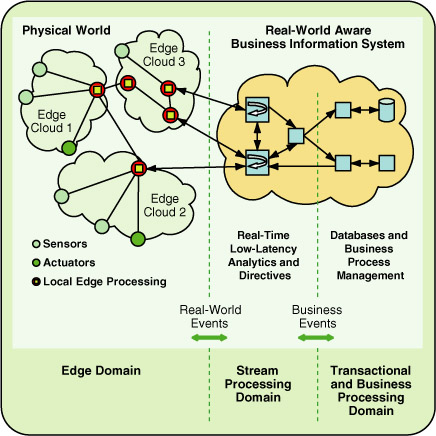
Figure 8.1 Topology of real world–aware systems
Source: IBM Journal of Research and Development
8.2.1. Edge Domain of a Real World–Aware System
The edge domain at the left of Figure 8.1 shows potentially numerous deployments of sensors gathering real-world data and actuators taking action, such as opening and closing valves or doors, in response to feedback controls. The edge domain is organized into edge clouds. The edge clouds each represent a physically contiguous, or connected, group of sensor and actuator devices, with some level of local processing close to them. Local processing in a particular edge cloud is useful for initially screening or filtering sensor data; first-level feedback for the control of actuators in that cloud is based only on local-state information. For example, in a real world–aware system designed to represent many rivers on a continent, one edge cloud might be associated with each river, with each edge cloud including data processing to filter out anomalous information and activate local irrigation systems.
8.2.2. Transactional and Business-Processing Domain of a Real World–Aware System
The transactional and business-processing domain at the right of Figure 8.1 includes the processes and databases necessary for reliable and robust business request handling. This domain incorporates an enterprise’s awareness of the state of its business and, thus, resembles a conventional business IT system, such as an enterprise resource planning (ERP) application. The domain accepts and handles direct requests for specific business actions from end users. It also receives and reacts to business events and insights derived from analytics in the stream-processing domain in the central part of the figure.
8.2.3. Stream-Processing Domain of a Real World–Aware System
The stream-processing domain includes functionality to continuously analyze information that arrives from multiple edge clouds, and processing to combine this information with business events and requests for real-world action (which are received from the adjacent business processing domain). The stream-processing domain can receive large amounts of continuously arriving data from many edge clouds, and it applies low-latency analytics and correlation analysis to extract insights in real time. This domain interacts with edge clouds by receiving information related to the physical world and passing directives and actuation guidance back to the clouds. The stream-processing domain interacts with the transactional and business-processing domain by exchanging business events and real-world information.
The net effect of this three-domain approach is twofold. It enables business processes to use current-state information, and it optimizes operational actions associated with distributed resources. These actions are guided and potentially automated based on both time-dependent analytics and enterprisewide business information.
Several emerging technological advances are being combined to make this new approach to real world–aware systems more feasible and economically attractive. These include advances in stream-processing systems, in sensor networks and analytics for sensed data, and for component-based assemblies of distributed and responsive systems.
Although the technology involved is becoming increasingly complex, some of the most advanced stream-processing systems are being designed to achieve a number of objectives that are important to any enterprise that uses them. First, the software capabilities focus on high performance, enable parallel processing, and scale over a range of hardware configurations. This leverages legacy (existing) infrastructure. Second, rapid and automated reconfiguration of the stream-processing system is possible in response to changing user objectives, available data, and the variability of system resources. For example, if computing capacity becomes constrained, data-processing actions can be prioritized to avoid neglecting the most important insights. Third, incremental tasking in the face of rapidly changing data forms and types is possible. For example, if a new edge cloud is added to an edge domain that includes new data types and requires new tasks in the stream-processing domain, the necessary system changes are only incremental. Finally, the systems are secure and privacy-compliant, and can be audited.[9]
Stream-processing systems enable low-latency, continuous analysis of potentially large amounts of information arriving from sensor networks or other real-world streams from such sources as the Internet, wired networks, and wireless “sensor fields.” The stream-processing programming model facilitates the construction of an analytic flow network in which simple processing elements can be connected and combined to provide an incrementally extensible system with multiple inputs and outputs.
The system can be optimized to use virtually all available processing capacity, while high bandwidth and reliable connectivity facilitate the support of large quantities of streamed data. In some contexts, the stream-processing results must connect to a storage system, to retain insight and data features or replay historical streams. The stream-processing approach enables subject matter experts to easily develop flexible, time-dependent, real-time analytics. Insights derived from the analytics can offer high business value, and the system can be easily scaled to receive and respond to large volumes of real-world data as it arrives.
8.2.4. Advantages and Illustrations of Real World–Aware Systems
One advantage of a typical real world–aware solution is that it addresses multiple levels of responsiveness. That is, some events require detection and response within milliseconds, others assume human response times of hundreds of milliseconds or longer, and yet others afford processing windows of seconds or minutes. For example, in a system that senses vehicles and charges different amounts for road use based on traffic density, data can be analyzed in the field for immediate action and subsequently can be reused to optimize traffic behavior, this time with relaxed constraints on time dependency.
In the past, when real-time data and the insights from it were not available, business managers sometimes had difficulty initially determining what to do with them. In the area of water management, for example, to make real-time visibility of water quality most valuable, new processes might be needed, such as direct communication channels and new delegation of authority to rapidly respond to adverse changes before problems occur. As an example, such processes could immediately shut off water flow from contaminated sources once detected.
A second critical area of advantage and recent progress for real world–aware systems involves sensor networks and sensor-based analytics. Technology is becoming available for self-organizing sensor networks[10] to use wireless devices, to decrease the cost of gathering basic information from the environment. Progress is also being made in extracting and analyzing significant metadata features from sensed data sources such as video images[11]. The combination of inexpensive digital cameras, wireless functionality to deliver video streams to processing locations, automated feature extraction, and low-cost intelligent storage has led to a significant cost reduction for the deployment of, for example, a video-based safety system. Casinos, airports, and city governments are all beginning to deploy systems with thousands of cameras on a scale that would have been prohibitively expensive a few years ago.
A third advantage and emerging technological advance that is critical to the widespread use of real world–aware systems is in component-based middleware that connects software components or applications with messaging for assembling time-dependent distributed solutions. Service Oriented Architecture (SOA) and its associated infrastructure technologies can support precise specifications for the functional properties of each element (shown in Figure 8.2) needed to assemble the information-processing solutions. The lifecycle cost of a solution, such as analytics-based operations in an intelligent electrical utility network, will be prohibitive if performance reengineering (around such parameters as latency or expected fault tolerances) is required each time a subnetwork is deployed or a new household is attached. This will be true even though each household and subnetwork comes with its own individual topology, attached devices, processing hardware, and usage patterns.
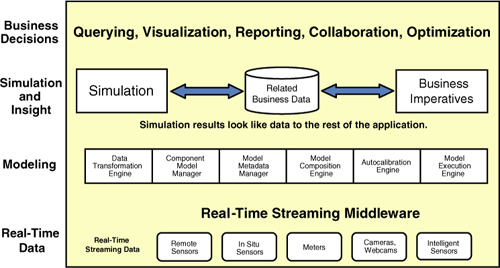
Figure 8.2 Application layers of an interactive modeling framework
Source: IBM
8.2.5. The Application Layers and Technical Architecture of Interactive Models
Figure 8.2 illustrates five application layers of an interactive modeling framework. As information moves from one layer to the next, the level of analysis and insight from the sensed data increases. At the lowest levels, multiple sensors can generate and relay data to a real-world model through streaming middleware, as in the stream-processing system described earlier. The modeling layer provides for data transformation, metadata management, and different modeling components and compositions. It also supports calibration and execution. Models then form the basis for running simulations and generating insight from both sensed data and related business data. Finally, insights are communicated so that improved business decisions can be made at the top layer.
The application layers in Figure 8.2 are generalized and can apply conceptually to many areas in support of environmental stewardship, including intelligent transportation systems; intelligent utility networks; advanced water management; enterprise and supply chain carbon management; energy and water management for smart buildings and cities; management and planning of weather-sensitive operations; industrial process management at refineries and chemical plants; recyclable content management; resource demand forecasting for energy, water, or minerals; alternative energy production management, such as wind or photovoltaic power; and regional climate impact modeling.
The generalized reference architecture in Figure 8.3 illustrates sample technology elements that are relevant at the enterprise level, the operational level, and the sensor level. This figure illustrates the level of complexity that can be involved, with a diverse portfolio of functional requirements, hardware and data needs, and significant integration effort.
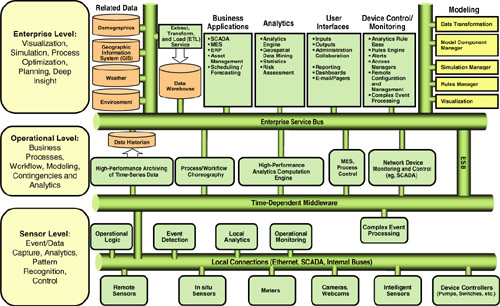
Figure 8.3 Reference architecture to support an interactive modeling framework
Source: IBM
Success of the enabling technologies described here is measured by the extent to which the technologies help subject matter experts assemble solutions that combine high performance computing (HPC)–based models using time-dependent sensor data with analytics. An instrumented world is a better place to live in only if the additional information helps people manage scarce resources better and consume them more efficiently and safely. Real world–aware solutions, made feasible by the technologies summarized here, provide a natural approach to combining the best available analytics and modeling of resources, and integrating that insight with business information–processing systems to improve the management of intelligent transportation, manufacturing and energy, or other scarce resources.
Many of the business processes in both private and public enterprises have traditionally operated within the boundaries of an organization and its extended ecosystem, and have had little intelligent interaction with events in the real world. However, these processes will increasingly need to be aware of the state of the real world, to achieve optimal use of scarce or expensive resources.
8.3. Examples of Instrumented World Systems
Examples of these new systems are beginning to deliver benefits to the enterprises that use them. In 2007, the Pacific Northwest National Laboratory (PNNL) conducted a pilot project for distributed energy resource management in northwest Washington State on behalf of the U.S. Department of Energy. The pilot was known as the GridWise Olympic Peninsula Project.[12] One purpose of the project was to explore time-dependent pricing for electric power, essentially in real time, to enable the local utility to control residential demand for power. In the time-dependent pricing part of the project, residential customers used a personal computer connected to the Internet to establish a range of prices they would be willing to pay to maintain the temperature of their homes within a zone of comfort. These price preferences were converted into bids that were submitted to a shadow energy market (defined shortly) that was “cleared” every five minutes. The term clearance refers to the fact that, every few minutes, the “buy bids” from the customers were matched to the “sell bids” from the utility, and the process began again. If a given consumer’s monetary bid for energy is accepted in the market (that is, accepted by the utility company providing the energy as a service), the air-conditioning or heating system would run at the residence.
Figure 8.4 shows the major elements of this project and the central role the energy market played in regulating consumer demand. The left side of the figure, labeled “Residential Home,” shows the kinds of appliances and systems that were actively controlled in the pilot, including clothes dryers and heating systems. Networking devices from Invensys, one of the partners for the project, remotely controlled appliances. In the figure, a grid-friendly appliance (GFA) implies that an electrical utility is controlling the device. Load control modules (LCM) indicated the particular interface between the control logic and the controlled device. Domestic demand was communicated through personal computers, and domestic load was controlled via a “home gateway.”
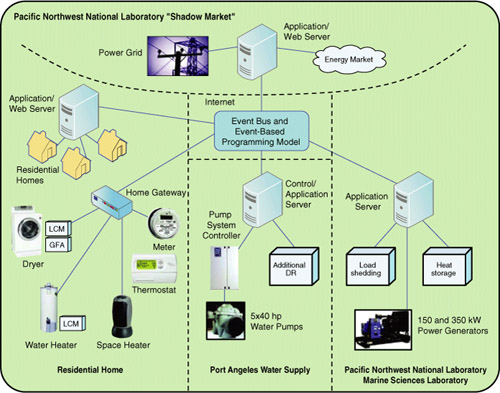
Figure 8.4 Schematic diagram of key elements in the GridWise project
Source: IBM Journal of Research and Development
The central part of Figure 8.4, labeled “Port Angeles Water Supply,” represents a municipal water supply district that used electric motors to drive water pumps. Again, a control or application computer connected to the network served as the means for the utilities to control the pumps. The term “Additional DR” refers to additional pieces of equipment that were controlled as part of managing the demand response. The right part of Figure 8.4 shows a power generator at the PNNL, together with various energy consumers at the laboratory, including a heating system.
Information on available generating capacity and domestic demand were collected and matched through the shadow “energy market.” The top part of Figure 8.4 shows the shadow energy market operated by PNNL, which matched and cleared bids submitted on behalf of energy consumers and energy providers. The term shadow market indicates that this market was shadowing (that is, tracking) wholesale energy costs in the western interconnection power grid. Finally, the various technology elements in the figure were integrated through the event-based programming environment shown in the center of the figure.
Although the pilot study was relatively small in scale, with 112 residences total, it demonstrated the potential use of auctions in making operational decisions in close to real time. The energy market mechanism permitted the utility to express the true marginal cost of power as demand started to rise, and the rising price smoothed the demand curve. This enabled the utility to optimize the available energy-generating capacity. In some cases, in which demand peaks would ordinarily drive some subnetworks in the distribution system to their operational limits, the utility delivered more total energy over the course of the day.
In another industry, more information is needed about water supplies to improve how water systems work and to enable more efficient use of this increasingly scarce resource. With IBM’s participation, the Great Rivers Partnership of the Nature Conservancy,[13] now called Water for Tomorrow, is using information from several of the most important rivers in the world and from the surrounding land to enable fact-based decision making for water and land use. One objective of the project is to better understand the impact of land-use decisions on different aspects of the river basin ecosystem, such as water quantity, water quality, crop production, and biodiversity. This project’s initial focus is the Mississippi River basin in the U.S., Brazil’s Paraguay–Paraná River system, and China’s Yangtze River.[14]
Another effort monitors progress for one of the largest American flood plain-restoration projects, at Emiquon, in central Illinois. This project uses sensors from YSI, Inc., that detect water quality. The technology that monitors this wetland uses wireless links to send time-dependent data to a web-based visualization system.[15] Similarly, the Beacon Institute is establishing a River and Estuary Observatory Network (REON)[16] to collect, analyze, and visualize time-dependent data from hundreds—and, eventually, thousands—of sensors in the Hudson River from the headwaters to the New York City bay. These devices can sense physical characteristics such as temperature, depth, flow rate, turbidity; chemical characteristics such as acidity and pollution; and potential biological contamination such as bacteria. Combining such data will enable scientists to detect pollution earlier and track it to its source within a matter of minutes or hours.
In 2005, in the province of Canterbury in New Zealand, researchers installed a network of sensors in the Te Ngawai River catchment[17] to measure variables relating to river flow, water usage, and weather conditions. Farmers can use the information to decide how to extract and better manage water resources without exceeding their agreed-upon limits. In addition to producing environmental and productivity benefits for the farmers, the remote monitoring resulted in cost savings for the province.
The U.S.-based Consortium of Universities for the Advancement of Hydrologic Science has announced plans for a Hydrologic Information System to create the first integrated data-management system for the U.S. water supply.[18] This platform is based on federating existing hydrological databases, so it does not include time-dependent data streams. Instead, the platform addresses one of the major challenges for water management, to simply provide access and tools that help analyze and visualize existing data. In another example, the Bear River Commission, along with other partners, is working to address the multiple pollutants and diverse pollutant sources in the Bear River Basin, which covers large areas in Idaho, Wyoming, and Utah. The approach is to develop a water-quality trading program that allows point and nonpoint pollutant sources to trade water-quality credits. Along with such a trading program, a water-quality trading model is being developed that can analyze potential water quality–monitoring scenarios.[19] According to the U.S. Environmental Protection Agency, more than a dozen states have some form of water-quality trading framework in place or under development; statewide water-quality trading frameworks exist in Oregon, Idaho, Colorado, Michigan, Ohio, Pennsylvania, and Vermont. Pollutants that can potentially be measured and traded include phosphorus, nitrogen, heavy metals, selenium, copper, temperature, sediment, and flow.[20]
Following the 2004 tsunami off the coast of Sumatra, Indonesia, many countries around the Pacific Ocean have deployed or strengthened their tsunami warning systems. For example, in 2008, the Tsunami Program of the National Oceanic and Atmospheric Administration deployed 39 Deep-Ocean Assessment and Reporting of Tsunamis (DART) sensors[21] around the Pacific Rim and in the Atlantic Ocean. The stations monitor hydrostatic pressure at the ocean floor and search for changes in the apparent sea surface height. The system is adaptive, normally reporting on a 15-minute schedule, but it can shift to burst mode and provide 15-second averages immediately following an apparent tsunami danger. Next, the system provides one-minute reporting. The tsunami system collects data from all sensors via a wireless network. Its detection algorithm continuously predicts the next sample of apparent sea surface height from preceding samples and raises an alarm when the difference exceeds 3cm.
False warnings from tsunami alarm systems are extremely disruptive and expensive, and they can cause personnel to not take warnings seriously. Thus, considerable intelligence is required to avoid false warnings. The U.S. National Oceanic and Atmospheric Administration (NOAA) emphasizes the need to reduce false-positive alarms by combining this kind of sensing with other sources of information, such as that from seismic instruments. More precise insights arise from combinations of data streams from varied sources, and combination is a key characteristic of systems in an instrumented world.
The Singapore Land Transport Authority introduced an Electronic Road-Pricing[22] scheme in 1998 and continues to improve it as a means of regulating congestion by moderating road usage during peak hours. The Singapore system works by detecting an RFID device mounted in each vehicle. The driver inserts a cash card into the RFID device, and the value of the card is decremented by a back-end transaction system whenever the vehicle is detected. A similar system was tested in Stockholm in 2005 and brought into full production in 2007. The Stockholm system, which relies on license-plate recognition from video cameras, produced a reduction in traffic of nearly 25 percent, a 14 percent reduction in emissions from traffic in the inner city, and a 6 percent increase in the use of public transportation.[23]
The transaction rates in such traffic systems can be quite high: Large numbers of vehicles are viewed perhaps hundreds of times per day in a city with a dense networks of cameras. However, the transactions are independent, so it is easy to provide highly scalable platforms. Although these are relatively simple transaction systems, they create a platform of spatiotemporal data on which more sophisticated traffic-prediction systems can be developed to deliver a hierarchy of insights both for the operating agency and for commuters and transportation companies.
Masdar, a planned city in Abu Dhabi, in the United Arab Emirates, is another example in which technology and environmental stewardship go hand-in-hand. The city plans to rely entirely on solar energy and other renewable sources, with a zero-carbon, zero-waste environmental impact. Although some compromises are being made to meet these objectives (such as importing electricity from traditional sources during the night and exporting solar generated electricity during the day, and not allowing energy-intensive industries), the model is an impressive environmental marvel. A carbon-management unit monetizes greenhouse gas emission reductions and identifies greenhouse gas emission–improvement projects to achieve benefits, consistent with the Kyoto Protocol provisions.[24] One of the anchor partners, General Electric, will have an ecomagination center there that, among other things, will support the development of energy-efficient products in the region and raise awareness of energy conservation among the Masdar City community.[25]
These are just a few examples of innovative technology solutions that provide an early glimpse into the potential of an instrumented world. Although the technology underlying these systems has been emerging for some time, it is being more widely applied and becoming more visible, as a result of pressures from climate change, natural resource constraints, and limitations in our constructed infrastructure. This evolution is beginning in the public domain but is moving toward the private sector as well. In a world of constrained resources (whether through speculation or real shortages), the new approach to resource management described here can enable enterprises, governments, and individuals to be significantly more efficient and can mitigate the volatile costs and risks associated with scarce resources.
8.4. Leading Toward the Future in an Instrumented World
An increasingly instrumented world will affect businesses across all industries. In the twenty-first century, humanity faces new challenges, with information technology and analytics, as embodied in an instrumented world, playing important roles. Growing populations and rising living standards are leading to scarcity in basic resources such as clean water, energy, food, and minerals, all of which directly influence the global economy. The expected result is price volatility and increased business risk related to the availability of these scarce resources. Responses to the scarcity of resources are constrained by the need to minimize greenhouse gas emissions. Hence, the efficient use and management of resources has become increasingly desirable, even though it has never been unimportant in the past.
A promising approach to managing these resources better is to apply mathematical optimization and other quantitative operations-research methods, which depend highly on the availability of data describing the environment. Fortunately, a large deployment of various sensor types is producing potentially valuable data about social and environmental phenomena. Moreover, the pervasive global deployment of wireless and wired digital network systems offers the capability to capture streams of real-world sensor data. Still, some key areas, notably hydrology, are seriously underprovisioned.
Only a few years ago, the cost of such systems restricted their use mostly to academic research. Computing technology has now become inexpensive and powerful enough that enterprises can readily afford to apply it to capture, manage, process, and store data for commercial and social purposes. In parallel, the improved affordability of computing power and access to various sources of data have led researchers to implement increasingly sophisticated mathematical modeling techniques that generate insights from these streams of real-world data and offer optimal decisions. Leaders can use these insights and decisions to drive organizational and individual activity to optimize resource management.
Thanks to the combination of increased amounts of accessible real-world data over pervasive networks and affordable computing platforms for implementing innovative modeling techniques, we can implement systems to improve our efficiency in managing scarce resources. Partnerships will become increasingly important in an instrumented world, and all industries will be affected—and all will potentially benefit. These include well-established businesses, such as those that depend on and provide communications and networking infrastructure, agricultural resources, engineering skills, geotechnical skills, transportation, water infrastructure, buildings and facilities, appliances, energy infrastructure, sensors and meters, enterprise and specialized software, and specialty hardware. Some new business models are also possible and could emerge in areas such as carbon trading, advanced optimization and modeling of scarce resources and emissions, sensor network deployment, and outsourcing of ongoing monitoring and maintenance.
Instrumenting the planet is feasible and increasingly viable, and it can help address some of the challenges the world faces. Certainly, technology alone cannot serve as a panacea, yet we can expect that the form of computing associated with an instrumented world can play a key role in addressing the challenges of climate change, the scarcity of basic resources, and limited transportation and utility infrastructures.
Already, some business leaders are moving away from managing their operations based on historical reports and are managing based on real-time intelligence from the environment. Companies are realizing opportunities to optimize waste, better manage natural resources, and improve environmental stewardship, but much work remains to be done. In the future, business leaders will increasingly manage in “future time” instead of real time, anticipating and even avoiding future consequences before they occur. In some cases, the management time shift from historical, to real time, and then to future time will occur gradually as sensor networks and technology solutions advance; in other cases, business leaders should expect and be looking for rapid step-changes. Best-in-class businesses have been viewed for some time as having proactive operations instead of reactive ones, and that view is now working its way into how businesses manage their activities for environmental stewardship.
Companies will not realize all the business benefits overnight, even though important steps have already been taken on the journey toward an instrumented world. Green supply-chain optimization, business event–processing software, traffic management and integration, water management, intelligent utility demand management, and intelligent meter management and integration are all areas currently being explored; in most cases, at least proof-of-concept pilot projects exist. Further out in time, but still within the foreseeable future, are opportunities in areas such as carbon-trading services, advanced predictive water management, smart-grid operations, and condition-based asset management. Even further in time are information utility services based on smart planet knowledge, total city integration and management, water management with total system integration, and utility integration.