7. Instrumenting the Planet for an Intelligent, Sustainable World
7.1. Benefits from Instrumenting Our Planet Are Enormous
“Instrumenting the planet” is an important part of realizing the full potential of an increasingly intelligent world, just as environmental stewardship can be an integral part of an organization’s social responsibility program.
Organizations can construct and deploy instrumentation technology (such as sensors), imaging technology (such as video cameras), and information technology (such as integrated systems) to monitor resources and better manage their end-to-end lifecycles. Such systems enable organizations to measure the state of different resources at key points throughout their lifecycles, from extraction to reuse. This describes an instrumented world. Implementation of such systems is referred to as instrumenting the planet. Organizations can analyze real-time or continuous data streams to enable quantitative decision making and to optimize use of constrained resources. Organizations can apply the concept of an instrumented world at any level, including the department or site level, the enterprise or city level, and the country or planet level.
In creating an instrumented world, enterprises can capture many business benefits. Products, services, and new infrastructure requirements of an instrumented world offer revenue-growth opportunities to companies that are well positioned to develop and supply them. Instrumented world systems will also greatly enhance how enterprises manage and use natural resources, such as energy and water, and construct infrastructure to lower costs. Environmental benefits are equally significant from lower water and natural-resource waste, and reduced greenhouse gas emissions.
The Climate Group’s 2008 report “SMART 2020: Enabling the Low-Carbon Economy in the Information Age,” concludes that smarter technology use could reduce global emissions by 15 percent and save global industry $800 billion in annual energy costs by 2020. This represents a reduction of 7.8 gigatons of carbon dioxide equivalent (gtCO2e). This work has been called the first comprehensive global study of the information and communication technology (ICT) sector’s growing significance for the world’s climate. Although this industry sector’s carbon footprint represents only 2 percent of global emissions, its importance in enabling all industries to reduce greenhouse gas emissions is substantial.[1] In a speech to the Council on Foreign Relations in 2008, Sam Palmissano, IBM’s chairman and CEO, stated that a smarter planet is being made possible because the world is becoming more instrumented, the world is becoming interconnected, and “all things are becoming intelligent.”[2]
More than 50 years ago, instrumentation and widespread measurement systems for monitoring the environment were already beginning to emerge from efforts to better understand the planet. Activities in 1957 and 1958 associated with the “International Geophysical Year” actually spanned the globe with participation from scientists. One primary focus was on making Earth measurements, such as measuring ice depths, and the effort represented advancements not only in technology, but also in process and global cooperation.[3]
The means for collecting data on human activity and the many transactions we experience has also been developing higher degrees of sophistication during the past several decades. By 2008, Earth supported three billion mobile telephones[4] and several million radio frequency identification (RFID) sensors[5] and Global Positioning System (GPS) receivers.[6] According to iSuppli, a market-research firm, the shift from radio frequency–delivered video to Internet Protocol (IP) cameras that use IP for data transport will increase the number of video-surveillance units from 30 million in 2006 to 66 million in 2011.[7] These devices represent only a handful of those whose widespread use has delivered conveniences and efficiencies, but they can also serve as useful infrastructure in an instrumented world.
Significant growth is also occurring for the number of water meters[8] and sensor networks that monitor natural environments, such as forests[9] and other habitats,[10] rivers, oceans,[11] and glaciers.[12] Sensor networks that monitor human-made infrastructures are growing in size and number to measure such things as electricity grids, traffic patterns, and managed water supplies. Organizations can measure other activities through electronic payment systems, mobile telephone calls and text messages, e-mail traffic, and navigation systems that all create detailed record trails. Technologists have also launched weather and imaging satellites, and installed weather radar systems and dense networks of weather stations around the world. Instrumentation for hydrology is less common, but interest is rising for large-scale sensor deployments that monitor rivers and oceans.[13] Widely available wireless and wired networks can now connect sensors to inexpensive data storage and computing facilities to gather and process vast streams of data, and to ultimately improve our understanding and management of the Earth’s natural resources.
We are surrounded by a virtual cloud of real-world data representing people’s behavior and the Earth’s environment. With computing capabilities and analytical modeling techniques sufficiently advanced, it’s now possible to extract “real-time” insights from available information to support better decision making and improved environmental stewardship. “Real-time,” as it’s used here, refers to situations in which operational deadlines (for a system response to the occurrence of an event) are established. In contrast, a non–real-time system has no deadline. Therefore, real-time intervals can vary widely for different systems. For example, deadlines for a system response when monitoring electricity usage on a power grid might be very short and possibly measured in fractions of a second; however, a system that monitors pollution levels or water-flow rates in a network of rivers might require measurements to be reported only every hour, day, or week. The systems for capturing data streams, analyzing them to gain insights, and applying those insights to drive operational efficiency represent a new form of computing that is essential for an instrumented world. Without these capabilities, much of the potential value from insights that support better business decisions and improved management of critical natural resources would be lost.
Figure 7.1 shows the conceptual flow of data and information for a system in an instrumented world. The system begins with real-world data and ends with insight that drives decision making. On the left side of the figure, the flow begins with the capture of raw, unprocessed data from sensors and other devices, such as intelligent electric meters, and possibly from the output of other systems. The raw data is transported over various access networks to the processing system that converts it into information streams that are standardized by the type of industry application being supported. The processing system might combine the streams from different types of input in predefined ways for processing. Then the processing system communicates the standard streams to an analytical or modeling framework that is again standardized according to the type of industry application. The purpose of this analytical or modeling framework is to identify insights from real-world events or features in the information streams that are relevant to decision making. Data from real-world sensors can enable time-dependent decision making for improved process efficiency and management of natural resources. Businesses might implement these systems for their own use, such as improving operations in a chemical plant. In other cases, the sensors might be part of a public infrastructure, such as a highway system, and authorities can share the insights as a service to multiple organizations. This “information utility” concept at the top of Figure 7.1 indicates that multiple processing steps and data-visibility levels can exist for the various insights that the system produces.

Figure 7.1 Data and information flow in an instrumented-world system
Source: IBM
In one example of an information utility, Cisco is partnering with NASA, the United Nations, multilateral development banks, businesses, international government agencies, universities, think-tank organizations, nongovernmental agencies, and foundations to develop the “planetary skin” that captures, collects, analyzes, and reports data on environmental conditions around the world. The concept is to create an online collaborative platform to capture and analyze data from satellite-, airborne-, sea-, and land-based sensors across the globe. This data would be made available for the general public, governments, and businesses to measure, report, and verify environmental information in near-real-time to help detect and adapt to global climate change.[14]
The figure uses the term “real-world” to represent data from systems in the physical environment, such as weather and traffic, which is different than data from systems in virtual environments, such as e-commerce and online banking systems. This leads to the concept of real world–aware (RWA) computing, an essential component of an instrumented world. This chapter provides examples of several existing systems that support the concept of an instrumented world and examples of others that are in development and emerging. It also describes distinctive features of an instrumented world.
New forms of environmental data and modern high-performance computing systems during the late twentieth century have established a solid foundation for instrumenting the planet and have helped develop real-world models. Organizations can now apply such models to gain an understanding of and formulate a response to global climate change. Processing large streams of time-dependent data places different requirements on computing infrastructures than mainstream transaction-oriented systems that businesses are most familiar with.
Humankind’s capability to instrument the planet is growing at a time when several factors compel us to address the increasing challenges of climate change and the scarcity of many important natural resources (such as fossil fuels, clean water, and air) and constructed resources (such as roadways and utility networks). At a time when businesses are identifying ways to improve their role as environmental stewards, understanding the contribution that instrumenting the planet offers toward addressing environmental challenges is especially relevant.
7.2. Growing Demand and Increased Scarcity of Resources
Much of the world’s supply of constrained natural resources can easily be transported anywhere around the globe. Effective management and efficient use of these resources increasingly requires insight from an instrumented world. In 1970, the Club of Rome sponsored a body of work that was published with the title Limits to Growth.[15] This work reviewed the effect of a number of parameters upon the planet’s resources, including exponential population growth. The researchers built a model that explained the effect of these parameters upon the long-term growth and material economy of the world. They also presented a number of scenarios in which the world could exist in a sustainable state, and other scenarios in which humanity could use resources in such a way that they would not be replaced. A recent update[16] reviewed this and subsequent works and presents a number of scenarios, ranging from the dire to the benign.
In 1999, Wackernagel and colleagues studied the world’s capacity to sustain its population and determined that the “regenerative capacity of the biosphere” was exceeded in 1980.[17] That is, the population was using resources at a rate that exceeded the planet’s capability to replace them. More recently, the 2007 United Nations Environment Program (UNEP) “Global Environment Outlook 4 Report”[18] showed that insufficient arable land exists on the planet to extend Western lifestyles to the global population. A growing body of credible work shows that demands from society for the Earth’s resources will outstrip supplies without making changes in how those resources are managed and used.
Since the early 1950s, the global population has grown from 2.5 billion to approximately 6.7 billion people,[19] and it is projected to reach 9.3 billion by the middle of the twenty-first century.[20] During this span of time, worldwide oil production[21] has grown from approximately 4 billion barrels of oil per year to 24 billion, and global grain production has risen from about 500 million tons to 3 billion tons.[22]
Historically, supplies of petroleum and basic agricultural crops, such as corn, grain, and soy, have been relatively unconstrained. Today global demand approaches supply so closely that even small variations in availability can disrupt markets, increase prices, and invite speculation. The use of agricultural crops to produce “clean” energy and other environmentally friendly products has also led to food price increases[23] as their original destinations for animal and human consumption are diverted to other areas, such as ethanol and biodiesel production. To add to evidence that risk is growing, the prices for many commodities have at least doubled[24] and fluctuated widely with economic cycles during the last several years as demand—driven by emerging economies and rising living standards—has increased. In general, scarcity invites speculation, and speculation tends to widen price fluctuations and decrease price stability, ultimately leading to increased risk for business operations across industries. Yet compelling evidence exists that industries can improve supply constraints if they manage resources more effectively. For example, it’s estimated that up to 30 percent of food is wasted in developed countries because of a host of inefficiencies that come from such areas as the supply chain and how consumers use food.[25]
Unwanted variation in the supply of increasingly constrained natural resources, and the business risk from potential price variability, points to a more general concern. The constrained availability of many natural resources requires a better understanding and efficient management of their use. Economics will continue to play a major role in maintaining the balance between supply and demand for constrained resources, but changes in the behavior of governments, enterprises, and individuals will produce much of the necessary operational restructuring. These behavioral changes will emerge, at least in part, as price signals and other triggers corresponding to resources that were formerly considered low-cost become recognized as financially significant or contributors to other global distress. Price, availability, societal distress, or climate change from global warming might be the trigger. An appropriate global response then is imperative when the implications of the scarcity or distress become known.
For example, the European Commission, backed by government regulations, has established a cap-and-trade program[26] and market-based dynamics to reduce carbon dioxide emissions and other greenhouse gases to mitigate global warming and associated climate and weather change. Experiments by electrical utilities to optimize consumer demand while giving consumers the choice to reduce power or maximize comfort[27] have shown that overall demand can be reduced with little actual change in comfort for the consumer. Also in the utility sector, IBM launched a pilot project with Consumer Energy to test a smart-metering program.[28] In another example, IBM teams[29] working with the Singapore government are developing traffic models that enable the government to predict vehicle volumes and more efficiently manage the road infrastructure.
It’s clear that the twenty-first century will require improved methods for managing the use of natural resources and constructed infrastructure. Information technology and analytics, such as mathematical modeling, will play critical roles in stimulating behavioral change. Through the design and implementation of effective models that utilize real-world information, businesses can make better decisions to improve price, reduce greenhouse gas emissions, and effectively manage scarce resources.
7.3. Growth of Real-World Sensing
In a world that has been instrumented, business leaders and policy makers can use information technology and analytics to make use of data to develop insights about strategic decisions, effective planning, and tactical operations. Organizations have deployed large numbers of sensors in recent years for monitoring various aspects of the planet, collectively producing vast streams of data from both the ecosphere and human activity. The scope of in situ (on-site) sensing is vast, covering such areas as water quality and quantity, air quality and atmospheric information, camera and video images for traffic management and facilities safety, and global positioning of vehicles and containers.
For many decades, remote sensing from afar has provided communication and monitoring services for commercial and military purposes, using technology such as aircraft and satellites. Modern satellites in both low-Earth and geostationary orbits can facilitate scientific observation of the universe and collection of meteorological, remote-sensing, geodetic, atmospheric, and navigation data.[30] According to a NASA Goddard report,[31] more than 4,000 satellites have already been launched, and several hundred remain in orbit today. Some satellites[32] generate terabytes of data each day.
One notable U.S. scientific program focuses on the measurement of atmospheric carbon dioxide gas. The Orbiting Carbon Observatory[33] was expected to make 8 million carbon-dioxide measurements every 16 days and identify greenhouse-gas sources from around the planet. However, the program experienced a setback in 2009 when the satellite failed to launch successfully.[34] A Japanese satellite program, the Greenhouse Gases Observing Satellite (GOSAT), is capable of measuring carbon dioxide, water, methane, and ozone in the atmosphere.[35] This satellite successfully launched in 2009.[36] Satellites are only one source that provide information both synchronously and in various processed formats to many different industries for their use and benefit.
In a comparable way, the approximately three billion mobile telephones[37] currently in use provide a valuable network of sensors to measure many aspects of human behavior. This sensor network is already being leveraged in social-network applications and related marketing programs. The technology to triangulate the location of mobile devices continues to improve. These technologies include Path Intelligence,[38] which can locate a user’s phone within 1–2m inside a retail store; Cellint,[39] which monitors vehicle traffic movement through cellphone triangulation; and INRIX,[40] which uses Bayesian statistical-analysis models integrated with vehicle traffic information and other parameters to predict traffic conditions. Clearly, organizations can use this information to analyze all types of traffic and to predict patterns in urban travel.
Organizations are using information from accelerometers in laptop computers, normally used to protect hard disks from sudden jolts, for environmental monitoring to detect earthquakes. Project Quake Catcher Network (QCN), with about 1,500 laptops connected in a network, has detected seismic activity that ranges from tremors to a magnitude-5.4 earthquake in Los Angeles.[41]
Video-surveillance cameras are another nearly ubiquitous source of sensor data that is beginning to permeate most developed cities. Central London has deployed 500,000 cameras, and Shenzhen, China, plans to install two million cameras during the next few years.[42]
These kinds of sensor networks and others, such as those facilitated by radio frequency identification (RFID) sensors and Global Positioning System (GPS) technology, will provide increasingly detailed information as companies add more functionality to devices and techniques to extract insight from sensor data improve. Although they provide valuable environmental and societal data, such sensors also raise difficult questions with respect to privacy and human rights. The importance of resolving privacy and human rights issues is difficult to understate as the use of information from personal technology devices, individual activity and transactions, and video imaging expands. Data-security technology and privacy policy is certain to play a central role as such issues are identified and resolved.
The sensor-network systems being deployed today lead to the accumulation of large databases that reflect real-world phenomena, such as the detailed flow of vehicles in an urban area for technology applications such as Cellint and INRIX. From these networks and technology applications, organizations can use mathematical modeling and analysis to capture insights for more effective decision making.[43] The rapid growth in computing power and data-storage capacity also enables more efficient implementations and effective use of mathematical models.
Integrating data from the growing sets of distributed sensors enables organizations to apply a broad range of information technology and analytics-based services to manage resources within agriculture, land management, engineering and construction, weather related emergencies, defense management, environmental management, mineral and oil management, electrical-power management, water management, and other areas. Dramatic cost reductions in semiconductor manufacturing have made these sensors more affordable for large-scale deployments. Similarly, the commercial adoption of the Internet Protocol and the emergence of pervasive IP networks since 1995 provide an enabling layer of connectivity. Finally, flexible integration methods, such as service-oriented architecture (SOA), enable rapid experimentation with various sensor networks. By applying information technology, organizations are making better business decisions and managing natural resources more efficiently.
7.4. Models for Managing Real-World Systems
Mathematical models and simulation are an essential component in a world that has been instrumented, providing the “intelligence” behind the design and control of its systems. These models aim to optimize multivariable systems in ways that haven’t been possible in the past, such as optimizing greenhouse gas emissions during daily supply-chain operations or using appropriate business logic in manufacturing execution systems (MES) software. In such systems, mathematical models might fill one or more of the roles described in Table 7.1, subject to appropriate constraints.

Table 7.1 Roles of Mathematical Models in an Instrumented World
A variety of mathematical-modeling approaches exist for performing these roles. For example, organizations can use statistical and data-mining techniques to discover interesting and insightful patterns in a data set, and to predict the values of missing data and future outcomes. Table 7.2 describes some of the most frequently used techniques.
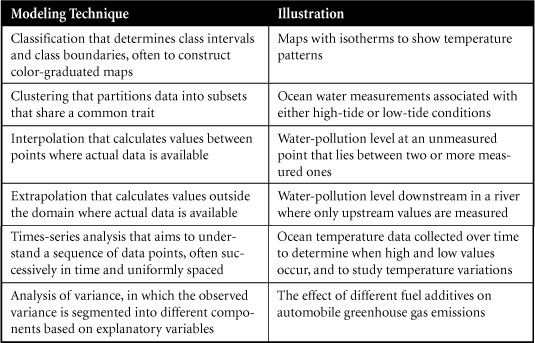
Table 7.2 Mathematical-Modeling Techniques
Organizations can also use simulation techniques to predict future outcomes and to perform a variety of analyses for testing sensitivities to different initial conditions. Table 7.3 describes three of these techniques.
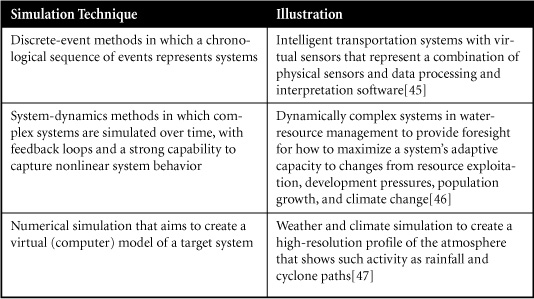
Table 7.3 Computer Simulation Techniques
Organizations can use optimization techniques to identify an optimal action or set of actions, and then establish a set that is realistically acceptable, particularly in the presence of multiple real-world constraints. Organizations measure the optimal actions against a given objective, such as minimizing cost or carbon emissions, or maximizing revenue or fresh-water flow. These actions might facilitate improvements to the systems that sensor networks are monitoring, or even influence the design of the sensor networks themselves. Table 7.4 describes four common optimization techniques.
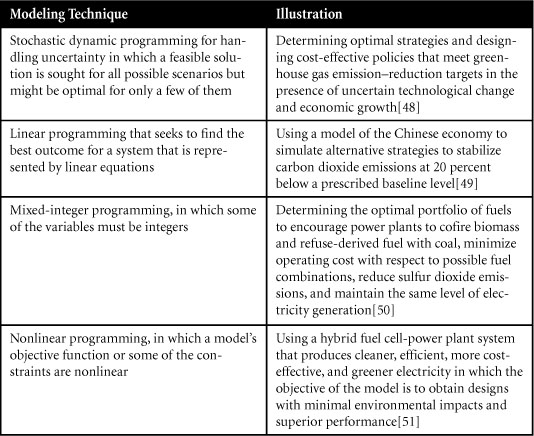
Table 7.4 Optimization Techniques
Ensemble models that combine results from different models to achieve a better prediction are also relevant to the area of environmental stewardship. Organizations can use several approaches to create ensemble models. The ensemble modeling method of “bagging” seeks to reduce the variability of predictive models, “stacking” seeks to decrease the predictive bias in addition to reducing variance, and “boosting” aims to transform the results from a collection of weak models into one strong model through such techniques as weighting. Ensemble models are used in areas such as forecasting, in which combining forecast results can provide a better result than simply trying to choose the best model.[52]
An instrumented world will support broader types of systems models[53] that consist of assemblies of models representing heterogeneous systems. National power-grid models that are assembled from many local models are one example. The data required to support such complex system models will come from multiple data sources and sensor networks. The capability to combine data from different domains and use that data for a common objective is a challenge that remains to be overcome, but it’s within the reach of existing science and technology. Although it’s for a relatively small population of approximately 400,000 people, one project aims to develop a national “smart-utility” system for the Mediterranean island nation of Malta that will digitize the country’s electricity grid and water system.[54]
High-quality, reliable, real-world data is essential for the development of mathematical models that represent actual systems. Such models and the data they analyze must account for the definition and validation of model assumptions and the calibration of model parameters. Organizations shouldn’t underestimate the need to validate models because inadequate validation can inhibit model acceptance. After mathematical models have been developed and deployed, high-quality data is again essential for providing input to the model and for adapting the model to potential changes in the real system environment. Instrumenting the planet makes it possible to provide large volumes of high-quality, current data for the development, implementation, and ongoing use of mathematical models.
Beyond the underlying science and technology of modeling, a gap often remains between the scientists who develop the models and the business practitioners who use their results. Most companies that develop or use mathematical models struggle with the issue of making knowledge and insight developed by highly focused mathematicians, environmentalists, and other scientists available and useful to business line managers, who are often generalists. Peter Williams, IBM’s chief technology officer (CTO) for Big Green Innovations, has commented that to close this gap, “We have to democratize the models that will run different aspects of our lives” so that the scientists developing models, the practitioners making decisions, and the public at large whose surroundings might be affected all have a voice and understand how the management of their environment is transforming.[55]
7.5. Applications of Models in an Instrumented World
Several examples of applications already exist in which mathematical models are providing the “intelligence” that is essential to an instrumented world. Such intelligence enables better decision making, more effective real-world system design, and improved resource management. Enterprises must consider and overcome some of the potential challenges that they might encounter during the course of instrumenting the planet. The rest of this chapter discusses several important examples of existing applications.
7.5.1. Electric Power Supply Management
A combination of environmental and behavioral factors drives electricity consumption. Two environmental factors include temperature, which influences heating and air-conditioning usage, and natural sunlight intensity, which influences lighting use. Behavioral factors include the level of “conservation culture” achieved, the discretionary budget that is made available for electricity usage, and the usage response to price fluctuations. Information on consumption patterns and trends is a critical input to mathematical models for electric-utility production planning, capacity planning, and demand management, with the objective to match supply and demand. In an instrumented world, organizations can combine environmental information, such as weather data and forecasts, with time-series data collected from utility meters at customer locations to better predict consumption patterns using simulation or statistical models. Continual data streams from sensors that monitor the capacity of the power-generation network are also valuable inputs to these models.
A 2006 report by the Department of Energy (DOE)[56] recognized a need to develop improved optimization models for solving the optimal power-flow problem. Solving this problem is to optimize the production cost of energy, subject to numerous operating constraints. According to this report, “a next-generation optimal power-flow problem solution needs to perform time-dependent, full-system calculations for location-dependent, marginal prices” that reflect the value of energy at a specific location and time of delivery, subject to an accurate representation of current bids from customers and offers from the provider. Clearly, mathematical models that address this problem would benefit from time-dependent data feeds of marginal prices by location, hourly fluctuations in bids and offers, and the state of the power grid for plant-production capacities. All these data elements would ideally be available in an instrumented world. Integrating alternative energy supplies into a conventional grid is also a key part of solving the power-flow problem.
Dynamic pricing is a form of demand management that organizations can use to optimally match supply and demand under changing conditions. Organizations can use mathematical models to develop effective mechanisms for implementing dynamic pricing. Dynamic electricity pricing for household consumers is not widely practiced today, beyond a number of experiments. A pilot study implementing dynamic electricity pricing for certain household consumers was conducted in Denmark and Norway.[57] In the U.S., the Electric Power Research Institute (EPRI) has contemplated reducing peak consumption by building a dynamic energy infrastructure that supports a “prices-to-devices” concept that delivers hourly power prices to the homes of end users using smart devices.[58] These smart devices could conceivably make use of optimization models that determine the best time to operate household appliances, subject to constraints specified by the resident.
7.5.2. Water Management
As global climate change redistributes fresh water supplies, industrialization places more stress on existing sources; as growing populations consume more water, effective water management is becoming critical to global sustainability. In fact, several areas associated with water management have already deployed instrumentation as a means to better manage supplies.
7.5.2.1. Reservoir Management
Managing the water in a reservoir or network of reservoirs generally involves controlling the volume of water in the reservoir, to limit the risk of flooding, while maximizing the storage of water for future consumption, navigation, and recreation. Reservoir management might also involve optimally coordinating hydroelectric power-generation needs with other demands for reservoir water.
Organizations can use mathematical models to help optimize reservoir-management decisions.[59, 60] Important inputs to reservoir-management models include rainfall, evaporation rates, runoff and infiltration rates, water composition and quality, and the rate at which consumers and businesses use water. Research work by Westphal, et al.[61]; Rasmussen, et al.[62]; Georgakakos, et al.[63]; and the Maryland Department of Natural Resources[64] made attempts to combine climate and hydrology forecasts with reservoir-management models. In an instrumented world, environmental data for variables such as rainfall and evaporation rate could be provided on a continuous basis to reservoir-management models.
7.5.2.2. Water Quality Prediction
The quality of the water in Earth’s rivers and streams is important for sustaining wildlife and supporting human activities, such as agriculture and fishing. Although water quality–monitoring networks do exist,[65] gaps in coverage are unavoidable. Organizations can use various spatiotemporal-statistical methods to estimate the quality of the water in unmonitored regions, using input factors such as chemical and sediment composition and temperature. In one example, the Kriging[66] method produces an estimator that is a weighted sum of observations at measurement sites, with the weights depending on the correlation structure of the underlying spatial process. However, spatiotemporal models that are based on regression analysis might be more useful for predicting water quality in unmonitored locations because they account for root causes of contamination.[67]
Supported by the insights generated from statistical models, organizations can use optimization techniques to determine the optimal position of water-monitoring sensors that generate the most accurate predictions of water quality for a given sensor-network investment. Bandwidth constraints can impact routing data from a network of wireless sensors. Therefore, it might be desirable to determine the most efficient way of aggregating and routing data within the network without a loss in the quality of the insights gained from information retrieved.[68] Using models for optimizing sensor positions, aggregating sensor data, and routing is also relevant in non-water-related sensor-network applications.
7.5.2.3. Water-Supply and Demand Management
Brandt and Lauria developed goal-programming optimization models for implementing water-supply rationing rules. They point out the need for greater dependence on optimization and simulation when implementing such rules, as opposed to the current practice of relying heavily on experience and judgment.[69] As an alternative to rationing, southeastern Australia, Chile, and the U.S. are using market trading of water to manage consumption.[70] In market-driven environments, businesses might begin to view water pricing similar to carbon-trading activities,[71] in which a business’s right to use water above its quota must be offset by purchasing unused quotas from other businesses. In such an environment, market participants can use mathematical models that forecast future water prices to guide their decisions. In a nonmarket setting, organizations can use optimization models to design effective pricing schemes for improving the alignment between the supply and demand for water.
7.5.3. Traffic and Public Transportation Management
Given the limited amount of road and highway infrastructure available to growing volumes of traffic in urban areas, an increasing number of cities are considering measures to implement controls for traffic volume during peak hours. For example, the Singapore government recognizes the need to not only discourage driving into the most congested parts of the island during certain hours (using methods such as congestion pricing), but also to encourage greater use of public transportation systems. The success of such approaches depends on the capability to accurately predict traffic patterns. Min, et al.,[72] successfully developed a prototype for a statistical traffic-prediction tool for Singapore’s central business district using time-dependent data feeds of traffic volume and speed. Because transportation networks might not be fully monitored, gaps can exist in the data for certain links in the transportation network, such as missing information for volume and speed. Organizations can use statistical models to estimate traffic flow along unmonitored links, and then use the results from these models as input to optimization models that would recommend the most effective locations for additional sensors, to improve the accuracy of the estimations on unmonitored links.
Accurate and continuous predictions of traffic patterns would enable congestion-pricing policies to become more dynamic, with prices changing not only by time of day, but also in reaction to developing traffic conditions. Predictive models would also enable public transportation systems to run more effectively. For example, monitors at bus stops could display bus arrival times, or mobile devices could convey arrival times to commuters so they can better plan their journeys, perhaps with the aid of an optimization model.
7.5.4. Wind Farm, Solar-Electric, and Solar-Thermal Power Management
The energy yield from wind farms is highly uncertain because it depends on wind speed and direction. Simulation models to investigate the performance of wind farms have been developed that evaluate power production under varying wind conditions and turbine availability.[73, 74] Organizations could combine these models with weather and atmospheric models that predict wind speed and direction[75] to forecast wind farm electricity production. Organizations could use these forecasts to support demand-management models for dynamic pricing, or production models for optimally coordinating the amount of electricity generated by wind in contrast to electricity generated by hydroelectric dams. Delerue, Luickx, and D’haeseleer use a combination of simulation and mixed-integer optimization models to investigate the potential cost and carbon dioxide emission savings from wind power.[76, 77] They also study the impact of wind-forecast accuracy on the reliability of power generation.
Solar electricity generation from photovoltaic technology and solar-thermal power generation, often from generating steam, share a similar trait to wind farms: Electricity production levels depend partly on weather conditions. Instead of modeling wind, organizations can model and predict factors such as cloud cover. Organizations can include other factors in mathematical models, such as sunlight intensity variation throughout the day and through seasonal changes, the angle at which power-generating equipment is set, potential dust on protective equipment covering, and other equipment-performance parameters, such as efficiency as a function of age. If fragile equipment, such as mirrors, is involved, organizations could use models to predict high wind, hail, and storm conditions to mitigate the risk of damage and predict associated power outages when protective action is necessary.
7.5.5. Intelligent Levee Management
Systems that use sensors based on Brillouin optical time domain reflectometry (BOTDR) have been demonstrated to provide early detection of the deformation of river embankments.[78] BOTDR technology measures the elapsed time and intensity of light reflected on optical fiber, and has already been applied to measure strain in the ground and in buildings and bridges.[79] This technology can also monitor the movement and subsidence of levee structures, which might be precursors to levee failure. Using the data from this monitoring technology, along with weather forecasts and data produced by flow meters in the water, hydrological simulation models can estimate the probability of structural failure in levees and the subsequent flooding probability and severity. If such monitoring and modeling is done continually, results could be used as input to stochastic-optimization models to compute the optimal trade-offs between the risk of flooding and the cost of alternative mitigation strategies. In the case of extreme deformations, the sensor data might help alert local authorities of an impending disaster. One project in the Netherlands is working to understand what an instrumented levee will “look and feel like” as it breaks, evaluate the effectiveness of different sensor types and their application to levee management, evaluate the applicability of numerical models, and predict storm impacts and responses.[80]
7.5.6. Data-Centric Modeling of the Environment
Current approaches to climate modeling typically involve explicitly simulating physical and social processes to identify and understand key contributors to climate change. Such simulations have limitations. For example, it’s computationally intensive to model all potentially significant physical and behavioral processes pertaining to the climate.[81]
Researchers at the IBM T. J. Watson Research Center are studying the potential use for a data-centric, as opposed to physics-based, approach to modeling the climate. Given the vast amount of spatiotemporal climate data that is publicly available (such as surface and atmospheric data; snow, ice, and frozen-ground observations; and oceanic-climate, sea-level, and atmospheric-constituent measurements) and the spatiotemporal data that might explain climate change (such as data related to land cover, land use, carbon dioxide, methane, aerosols, ozone emissions, solar irradiance, and volcanic activity), they aim to develop new mathematical modeling approaches for effectively generating insights about climate change. By using sophisticated data-modeling approaches, researchers hope to quantify the impact of various factors on climate change more efficiently than relying purely on simulations. This type of approach has also been applied with some success in the field of computational biology.[82] More tractable methods for modeling causal relationships would also improve subsequent optimization models that use these relationships.
Researchers can apply the systems of an instrumented world to a vast number of ecosystems. However, without the technology to support instrumenting the planet and optimizing resource management, many imagined benefits would be impossible to achieve. The next chapter describes important elements of this enabling technology.