7. The Financial Impact of Effective (or Ineffective) ES&G/Sustainability Management
This chapter reviews and discusses the financial impact of effective ES&G practices, from a theoretical standpoint and on the basis of what has been demonstrated through empirical, published research. This discussion builds on the concepts and terms introduced in the preceding chapter and demonstrates how financial market actors have evaluated and judged the outcomes of corporate ES&G activities. This chapter illustrates how economic and market theory and the bilateral relationships between capital markets and corporate ES&G practices have been expressed over the past 20 years or so. I explore what is believed and what is known about how making investments in ES&G improvements directly affects the firm’s financial performance. I also look at how a lack of attentiveness to these issues can increase the firm’s risk profile and costs and otherwise erode its competitive position and long-term sustainability. Finally, I review information on the beliefs and attitudes of market participants regarding the financial impacts of ES&G posture and performance, including increased profitability and returns to the investor.
In keeping with the approach used throughout this book (and in my consulting practice), the relationships I postulate are based on facts and empirical analysis. Numerous theories and beliefs in the expanding marketplace of ideas address the “value” created by disciplined investments in ES&G improvements. In sorting through these often competing ideas, I believe that the most rational way forward is to focus on what has been proven and/or can reasonably be inferred from evidence, rather than ascribing financial or other benefits to activities based solely on theory (or wishful thinking). Similarly, although examples and anecdotal experience can be interesting and highly relevant, it is fundamentally difficult to build a compelling case in support of a new approach intended to challenge long-standing orthodoxy, such as that practiced in many corners of the capital markets, with such evidence. Accordingly, the focus in this chapter is limited to a discussion of what has been demonstrated in the published literature—specifically, well-designed studies of multiple firms, generally examined over an extended period of time.
Insights from the Literature
During the past several years, I have had the opportunity to examine the published literature on the relationships between environment and finance on several occasions. The information presented in this section includes a synthesis of those research efforts,1 supplemented by a review of some of the more interesting and relevant literature published recently. You are advised that this review is illustrative and meaningful, but not comprehensive. In most cases the literature reviewed here pertains specifically to one or more environmental endpoints. But given the overlaps between environmental and health and safety issues and prevailing management practices, I believe that the findings and conclusions of the studies examined could reasonably be extended to health and safety issues as well. In addition, to evaluate certain aspects of market behavior, I have included works that address a broader spectrum of ES&G/SRI issues.
My purpose here is not to provide a full literature review, as one might in a scholarly research article. Instead, I attempt to support my contention that despite long-standing and widely accepted economic theory to the contrary, it can be shown that well-conceived and -executed investments in improved ES&G management capability and related performance improvements more than pay for themselves. In fact, they create new financial value and corporate wealth. I assert that the empirical evidence is sufficiently strong to consider the matter settled, and I provide the major threads of the argument and supporting evidence in the interests of proving my case.
If you don’t need to be convinced, you may choose to skip the detailed examination of the literature that makes up the bulk of this chapter and move to the final section, which briefly summarizes and discusses the implications. If you want to review the evidence, continue reading.
The literature I have selected for discussion was culled from a much larger collection of works. In evaluating each source’s utility, I considered the source/sponsor of the work. I gave greater weight to studies that were produced independently of the organizations under study and their industries and that were otherwise free of any obvious potential bias or vested interest. I also considered carefully the endpoint(s) addressed by each study, favoring those examining variables that are of interest to external stakeholders (such as investors and other capital market participants). Another distinguishing characteristic was breadth; I was most impressed by studies that had a broad perspective—ideally, one that was market- or industry-wide as opposed to a collection of anecdotal examples. I also was attuned to the presence of new insights, data, and/or methods in the sources reviewed. In evaluating the importance of the material collected, I ascribed greater significance to works that offered a clear articulation of one or more research hypotheses; valid, appropriate, and sensible methods; rigorous data development and hypothesis testing; and fully supported conclusions. For clarity and ease of exposition, I present the major literature findings in the form of the most important studies organized by categories defined by the financial questions and/or endpoints addressed.
A number of interesting and relevant findings emerge from the literature review. As an initial point, it is worth noting that virtually no published literature was found addressing environmental management, risk, or performance in the context of fixed-income investing in the U.S.2 One exception to this general pattern is described later. When and where studies have been performed, their focus has almost invariably been on internal corporate financial results or investor behavior in the equity markets.
The Accounting Perspective
Perhaps the most direct and obvious frame of reference for seeking a linkage between environmental and financial performance is to examine firm financial performance or position using familiar accounting-based measures. In doing so, we can see how these measures change as a function of environmental risks, liabilities, management practices, and/or performance. The studies described next are particularly noteworthy in that they address profitability (in either absolute terms or relative to assets or capital deployed) as a function of pollutant emissions or their reduction. The empirical results presented in each study document a positive correlation between emissions reductions and profitability.
• In their study of 127 manufacturing, mining, and other “production” firms that were members of the Standard & Poor’s (S&P) 500, Hart and Ahuja (1996) found that implementing pollution prevention strategies and, consequently, reducing pollutant emissions had a positive (and statistically significant) effect on the firms’ return on assets, return on sales, and return on equity. This effect was discernible within two years of implementing the firms’ environmental performance improvements. Interestingly, the effects were greatest for firms with higher initial pollutant emissions.
• Similarly, Russo and Fouts (1997) reported that among a collection of 243 firms studied over a two-year period, return on assets increased as a function of improved environmental performance. These firms were placed into quintiles based on their environmental performance characteristics (emissions, compliance record). Again, firms that made greater performance gains (moving up one quintile or more during the study period) exhibited a statistically greater gain in return on assets.
• Stanwick and Stanwick (1998) examined the issue from a somewhat different perspective. They studied approximately 100 firms listed on the Fortune Corporate Reputation Index that also had reported Toxics Release Inventory (TRI) data in one or more of the most recent five years. In other words, the companies examined had a positive reputation for social responsibility but also were subject to regulatory controls due to significant toxic chemical use. The study authors found a positive correlation between low emissions and high profitability (net margin) among these firms.
These results support and extend the commonly held view that well-chosen pollution prevention initiatives more than pay for themselves. The results demonstrate that the same type of impact occurs at the level of the firm, rather than simply at the project level. In that regard, they help overcome one of the self-imposed limitations of many published P2 studies. They describe results in a form and at an organizational level that is of direct interest to investors and other financial market actors.
Two other studies focus on the balance sheet by examining prospective environmental liabilities that, argue the authors, should be recorded on the balance sheets of affected companies under existing accounting conventions and rules:
• In their study of the financial impacts of Superfund (hazardous waste site cleanup) liability, Barth and McNichols (1994) found that the average unrecognized liability (information not reported in company financial statements) was equal to 28.6 percent of the affected firms’ market value.
• Similarly, Repetto and Austin (1999), in a detailed study of one industry (13 large pulp and paper companies), reported that despite the fact that many of the firms studied were projected to experience significant asset impairments and/or capital costs due to new requirements included in pending new regulations, none of these firms chose to report these prospective liabilities or costs.
These studies demonstrated that both actual and prospective environmental liabilities can be significant in magnitude, vary across firms in the same industry, and be quantified with a reasonable degree of precision. In other words, these data would probably be of interest to investors and other members of the financial community if they were made available on a widespread and consistent basis.3 As noted in Chapter 2, existing SEC regulations would appear to require more consistent and complete disclosure of such data, and the fact that regular reporting occurs so infrequently is a major gap in the existing regulatory framework. I discuss the issue of disclosure in more depth in Chapter 8.
Intangible Asset Value
It is increasingly recognized that traditional balance sheet-based measures no longer give investors a complete and accurate view of a firm’s strengths and weaknesses, future prospects, or worth in the marketplace. Instead, intangible assets, as discussed in Chapter 6, are now recognized as the principal competitive weapons and sources of future success and opportunity for most firms. Several particularly interesting studies examine the impact of environmental improvements (or lack thereof) on the value of the firm’s intangible assets. These studies document the impact on a widely employed measure of intangible asset value (Tobin’s Q) of more complete and far-reaching environmental management standards, pollutant emissions reductions, eco-efficiency, and improved human capital management, respectively:
• Dowell, Hart, and Yeung (2000) examined 89 S&P 500 companies with manufacturing or mining operations in developing countries. They found that firms with stringent, beyond-compliance environmental standards had significantly higher market values (10 percent, or $8.4 billion to $10.6 billion) than firms with U.S. standards only.4
• In their study of 321 S&P 500 manufacturing firms, Konar and Cohen (2001) found that the average “intangible asset liability” for inferior environmental performance among these companies was $380 million. This liability was greatest for firms in the chemical, primary metals, and paper industries (those with significant environmental aspects and extensive compliance obligations). In addition, the authors reported that during the study period, firms reducing emissions measurably increased their intangible asset value (hence, their value in the marketplace). On average, a 10 percent reduction in TRI emissions produced a $34 million increase in intangible asset value.
• Guenster, et al. (2006) performed an interesting analysis evaluating the financial effects of corporate eco-efficiency as reflected in both an accounting measure (return on assets) and a measure of intangible asset value (Tobin’s Q). They examined all publicly traded firms evaluated by Innovest Strategic Value Advisors5 from 1997 to 2004, using monthly returns data. Innovest produced eco-efficiency ratings using more than 60 indicators, with scores addressing five major areas: historical liabilities (such as hazardous waste sites), contemporaneous operating risk (from emissions), sustainability and eco-efficiency risk—weakening of a firm’s material sources of competitiveness (from products’ energy intensity, for example), managerial risk efficiency (capability/capacity), and business prospects resulting from eco-efficiency. Multiple regression analysis results showed the following:
• A positive and slightly asymmetric relationship between eco-efficiency and operating performance. Firms deemed “eco-efficient” had only a slightly better return on assets than the control group. The least eco-efficient firms, however, showed strong operational underperformance.
• A positive and time-varying relationship between eco-efficiency and firm valuation. Stronger environmental performers initially did not trade at a premium relative to weaker firms. Over time, however, the valuation differential widened substantially. The observed trend suggested that the shares of most eco-efficient firms relative to the least eco-efficient firms were initially undervalued but later experienced an upward price correction.
The authors concluded that their findings strongly disprove the notion expressed by SRI/CSR skeptics—that the benefits of adopting a strong environmental policy and practices are unlikely to outweigh the associated costs.
In all these examples, the authors found a strong positive correlation between improved, beyond-compliance, proactive environmental management practices and the firm’s value. In some cases, particularly the earlier studies, data limitations did not allow for the calculation of benefit-cost relationships associated with making these environmental management and performance improvements. Nevertheless, the results demonstrated that market-relevant financial benefits may be obtained through appropriate investments in improving a firm’s sustainability posture and performance. Results also suggest that such investments, which enhance the firm’s intangible assets, are translated over time into increased shareholder value. As suggested elsewhere in this chapter and in Chapter 6, there is reason to believe that this phenomenon may be gathering momentum, as more investor interest is placed on (and capital is deployed on the basis of) ES&G considerations.
ES&G Impacts on the Cost of Capital
Several other noteworthy studies have evaluated stock market behavior in response to environmental and other ES&G characteristics in a somewhat different way. The earlier works focused on the cost of equity capital as reflected in individual firm beta, which is an empirical measure of stock price volatility.6 One of these studies documented a positive impact on the beta (a lowering) as a function of enhanced environmental management or other ES&G practices and improved performance. The other showed a negative impact (higher beta) associated with being a large company in the same industry as several other firms with substantial Superfund liabilities. The more recent studies generally have employed a different dependent variable for expected rate of return, which has been expressed as a function of the company beta and several other variables.7 They also differ with earlier approaches and among themselves in terms of the specific regression model specification(s) used. Nonetheless, each of the studies profiled here reflects a common interest on the part of the researchers to understand the incremental impact, if any, of more-advanced environmental management practices, environmental/ES&G risks, or broader ES&G characteristics on a firm’s cost of equity capital.
• Feldman, Soyka, and Ameer (1997) examined 330 S&P 500 firms across two seven-year time periods. They carefully controlled for such confounding factors as capital structure, productivity, industry, and other important variables. Their results showed that improved environmental management practices (based on a 30-criterion scale) and performance (TRI emissions/fixed assets) decreased beta by several percent, suggesting a lower firm cost of capital and thus a higher stock price. In addition to being one of the first such studies to explicitly employ a management-based environmental rating methodology, it articulated a theory explaining how investors learn about and act on environmental management advances.
• Garber and Hammitt (1998) evaluated the cost of capital impacts for a set of more than 75 publicly traded chemical industry Superfund “potentially responsible parties” (PRPs) identified over a 12-year period. They included both large (23) and small (54) firms. Analytical results showed that a higher Superfund liability for an industry subset increased the cost of capital for other large industry firms. The magnitude of this impact for 23 affected firms was an increase in annual capital costs of 0.25 to 0.4 percent over a five-year period.
• More recently, Plumlee, Brown, and Marshall (2008) evaluated the effect of environmental disclosure quality on both the cost of equity capital and the other key component of enterprise value—cash flows. They examined firms in five industries. Two were considered “environmentally sensitive” (oil and gas, chemicals), two were considered “nonenvironmentally sensitive” (food/beverage, pharmaceutical), and one was considered separately because it has characteristics of both (electrical).8 Firms in the “environmentally sensitive” industries were presumed to have more to gain from voluntary environmental disclosure (VED) than the others. The study sample included 167 firms over a five-year period (2000–2004) to obtain a final sample of 629 firm-years. The authors developed and employed their own index for evaluating environmental disclosure quality. Their Brown Marshall Plumlee Index was based on the Global Reporting Initiative’s (GRI) framework (described further in a subsequent chapter). This index included 62 individual indicators, such as absolute or relative quantities of water use, descriptions of the implementation of environmental management systems, and specific identification of the person responsible for the firm’s environmental stewardship. Multiple regression analysis results showed that firm value for companies in the electrical and “sensitive” industries was primarily influenced through cost of capital associations with improved disclosures. Firm value for firms within “nonsensitive” industries was primarily influenced through expected cash flow associations with improved disclosures. In either case, firm value was enhanced, through either an equity capital cost reduction (in the former) or an increase in cash flows associated with higher-quality environmental disclosure (in the latter).
• Dhaliwal, et al. (2009) conducted a series of quantitative analyses to assess the relationships between corporate social responsibility (CSR) reporting and performance and the cost of equity capital. They assembled a sample of 196 firms representing more than 20 industries that collectively produced 679 CSR reports from 1993 to 2007. They then evaluated each firm’s relative CSR performance using CSR strength ranking scores provided by ES&G research/investing firm KLD.9 Results showed that firms with higher costs of equity capital were significantly more likely than others to release stand-alone CSR reports. Moreover, although for the overall sample the publication of a CSR report was not significantly associated with a lower future cost of equity capital, these costs did decline for firms with relatively superior social responsibility performance. This reduction in the cost of equity capital ranged from about 0.8 percent to 1.7 percent, depending on model specifications. The authors concluded that investors do not merely appreciate CSR disclosure per se but also evaluate firms’ actual CSR performance. Results also showed that reporting firms with relatively superior CSR performance attracted additional dedicated institutional investment and analyst coverage and had lower analyst forecast errors and dispersion.
• Finally, El Ghoul, et al. (2010) also examined the effect of CSR on equity cost of capital. They developed a sample of 12,915 U.S. firm-year observations representing 2,809 unique firms in 48 industries between 1992 and 2007. As in the study just described, they related firm financial data with CSR strength ratings developed by KLD. They conducted an extensive series of multiple regression and sensitivity analyses and developed a number of interesting findings. Overall, they found that firms with a better CSR score exhibited lower cost of equity capital after controlling for other firm-specific variables as well as industry and year fixed effects. The mean (median) cost of equity for firms with a high CSR score was 56 (39) basis points lower than that for firms with a low CSR score. These differences were significant at the 1 percent level.10 Using their model, you could predict that a 1 standard deviation increase in CSR score would lead a firm’s equity premium to decrease, on average, by 10 basis points.11 Moreover, the authors found that not all aspects of CSR were of equal importance. Quantitative analysis results showed that investments in improving responsible employee relations, environmental policy/performance, and product characteristics substantially contributed to reducing firms’ cost of equity. Investments in several other common CSR domains, including community relations, diversity, and human rights, did not. (Although they were desirable from other points of view, they had no significant impact on equity capital costs.) The authors also demonstrated that firms involved in two “sin” business sectors—tobacco and nuclear power—appeared to observe higher equity financing costs while others (alcohol, firearms, and military products) did not. Thus, they were not perceived to affect a firm’s risk profile by market participants. The authors concluded that their findings provide evidence that the cost of capital is an important channel through which the market prices CSR and support arguments in the literature that CSR enhances firm value.
The impact of ES&G management issues on the cost of debt capital (bonds and loans) has not been extensively reported on in the published literature. A small number of recent articles are the exceptions to this general rule. The most recent and comprehensive is described next:
• Bauer and Hann (2010) examined the impact on three distinct measures of credit risk to test the relevance of environmental management for bond investors: the cost of debt financing (expressed as the yield spread12), bond ratings, and long-term issuer ratings. They used environmental data from KLD’s STATS product. “Strength” indicators included measures of pollution prevention, recycling, beneficial products and services, and clean energy. “Concern” indicators included hazardous waste, regulatory problems, substantial emissions, climate change, agricultural chemicals, and other. The authors developed a sample of 2,242 bonds that were issued by 582 firms from 1995 to 2006. Regression modeling analysis of a number of hypotheses and scenarios showed the following:
• Corporate borrowers engaged in environmentally risky activities were charged a premium on their cost of debt financing, whereas firms with proactive environmental engagement enjoyed a lower cost of debt financing. A 1 standard deviation increase in the environmental strengths measure corresponded with a reduction in the yield spread of 6 basis points. A 1 standard deviation increase in the environmental concerns measure was associated with an increase in the yield spread of 5 basis points, equivalent to a 4.87 percent and 4.11 percent change in yield spread, respectively. The maximum impact of a combined change in the environmental performance measures on the annual cost of debt was estimated at 64 basis points, or 53 percent of the $3.6 million annual median interest expense payable in excess of the Treasury benchmark rate.
• Firms with better environmental management capabilities or activities were more likely to receive a higher bond rating, and firms with more environmental concerns were associated with lower bond ratings. Review of marginal effects showed that an increase in environmental strengths significantly decreased the probability of receiving a bond rating of BBB or lower and increased the probability of being rated A or higher. By contrast, an increase in environmental concerns significantly decreased the probability of being rated “A” or higher and increased the probability of receiving a rating of BBB or lower.
• Among the tested performance strengths, the categories Beneficial Products, Clean Energy, and Other Strength were statistically significant. For the performance concerns, the coefficients were significant for all categories. The categories most consistently associated with the different credit risk measures were Regulatory Problems, Substantial Emissions, and Climate Change. These results support the idea that climate change-related issues and regulatory concerns are linked to a higher expected default risk for firms.
• The better credit standing observed for firms with proactive environmental activities was linked not only to a reduction in environmental risk exposure, but also to an improvement in cash flows.
• Additional results suggested that the relevance of environmental management to credit risk has increased over time, particularly during the past decade, and that this increase is mainly attributable to the impact of environmental concerns.
• The authors found no evidence to support the view that the stated relations are consistently stronger for firms in high-risk industries.
The authors concluded that their findings extended earlier research by showing that the credit market not only responds to the potential misreporting of existing environmental liabilities, but also prices the environmental management characteristics of borrowing firms in anticipation of associated losses. Their results showed that the regulatory implications of climate change have sensitized lenders to the downside risk of poor environmental practices. Also, an assessment of past and ongoing corporate environmental activities enhances the accuracy of corporate bond pricing by enabling bond investors to evaluate the risk of environmental performance-related losses. The authors also believed that their findings contributed to a better understanding of how corporate environmental activities affect firms’ credit standing and give risk managers an improved understanding of where to focus their attention.
What these and many other published studies show is that ES&G investments pay off if they are made wisely. Applying an accounting perspective, (examining financial statement items that might be affected by improved ES&G performance), the published literature supports the idea that firm-scale reductions in costs (increases in profitability) can be realized through adroit capture of opportunities to prevent pollution and reduce the organization’s environmental footprint. Similarly, present balance sheet liabilities can be reduced or eliminated, and future liabilities and adverse earnings impacts prevented, through effective design and deployment of formal ES&G management systems and programs and appropriate due diligence of mergers and acquisitions. Some investigators also have found indicators of sophisticated environmental management practice to exhibit a statistically significant positive relationship to the firm’s market value, along with leadership, brand strength, innovation, and other intangible assets. Finally, empirical evidence supports the market theory that firms that have more ES&G risk pay more for the investment capital needed to support their operations. Studies have shown that firms offering evidence that they were effectively managing their ES&G issues are less volatile and hence confer lower investment risk than their peers. Accordingly, their costs of equity and debt capital also are lower. Given the increased volatility of and turmoil within global capital markets during the past three years, the ability to show that senior management understands the challenges and opportunities facing the firm, and is in a position to both manage risks and capture opportunities, is likely to become increasingly important. It seems to me that instituting a well-conceived program in pursuit of organizational sustainability offers an excellent opportunity to take advantage of this trend.
Stock Price Impacts of Environmental and ES&G Events
Having shown that well-considered investments in the firm’s ES&G capability can make a material difference to its balance sheet, intangible asset value, and financing costs, I shift from the internal to the external perspective. In this section, I discuss the evidence for market reactions to ES&G events and trends. As discussed at length in Chapter 6, most investors do not regularly seek, review, or consider environmental or ES&G information in making investment decisions. But it would be incorrect to assume that environmental and broader sustainability issues do not affect the stock market or individual company valuations. A number of studies have documented pronounced short- to medium-term stock price/market value impacts resulting from environmental or broader ES&G events, whether positive or negative. Both actual and prospective exposure to new environmental legislation have induced substantial share price declines in affected companies, as shown in the first two studies referenced here. Moreover, announcements by the U.S. EPA concerning enforcement priorities and negative news releases have been shown to induce similar effects. On the other hand, positive publicity concerning environmental performance (awards, recognition) conferred positive effects on share prices, some of which were quite substantial.
• Blacconiere and Patten (1994) examined a set of 47 publicly traded companies that obtained more than 10 percent of their revenue from the production and sale of chemicals. They reviewed the company financial disclosures (Form 10-Ks13) and placed the companies into one of five categories based on the extent of their environmental disclosure. The authors then evaluated stock price movements over a 200-day period to define a baseline and measured the price movements following the Bhopal tragedy in 1986.14 Results showed that firms that were heavily dependent on chemical-related business suffered significant declines in share price returns, but those deriving less than 18 percent of their revenues from chemicals experienced no such effect. In addition, companies with the best disclosure practices were unaffected, but companies with the worst disclosure practices suffered significant negative returns.
• Hamilton (1995) examined the short-term impacts of adverse coverage of environmental issues in the media. He examined 450 publicly traded firms that reported TRI emissions and found that 58 with significant negative news coverage on the TRI release date experienced significant stock price declines. He also identified 134 other companies that experienced adverse news coverage later in the same year and found that the average decline was even larger. Interestingly, these declines were smaller if Superfund liability information had previously been disclosed.
• Bosch, et al. (1998) collected news references from the Wall Street Journal over a 20-year period. They identified 171 cases involving 77 firms in which an announcement had been made by the EPA concerning companies targeted for enforcement action. They examined stock price movements during a 12-day window and documented abnormal stock returns in comparison with the behavior of the overall market during the same period. Furthermore, they showed that the firms involved experienced a significant negative return following the initial announcement of enforcement action and that challenges to these enforcement actions mounted by the affected companies, even successful ones, had little or no impact. On the other hand, unsuccessful challenges appeared to induce significant negative returns (more than 1 percent loss in total value). Settlements also produced a negative, but smaller, impact.
• In their study, Blacconiere and Northcut (1997) examined 72 chemical companies during an eight-month period around SARA reauthorization.15 They considered a three-day event window and compared the behavior of potentially affected firms to that of the overall market. They found that firms likely to be negatively affected by the new legislation suffered share price declines. These impacts were greater for firms with costs previously defined in Superfund Records of Decision and in response to actual legislative action.
• Klassen and McLaughlin (1996) began by performing a search of the Nexis database from 1985 to 1991. This search yielded 140 announcements of environmental awards to companies, as well as 22 stories about an environmental crisis caused by or involving a particular company. Firms with environmental awards increased in market value (by 0.63 percent overall), and firms with negative publicity declined in value (–0.82 percent). The authors then filtered out the effects of contemporaneous events by these firms. Revised results showed even more acute impacts (a 0.82 percent gain for positive news and –1.50 percent for stories of crisis), with an average annual gain of $80.5 million or loss in market value of $390.5 million, respectively.
• More recently, Griffin, Lont, and Sun (2010) examined the importance of greenhouse gas (GHG) emissions on shareholder returns. More specifically, they looked at whether stock market investors appear to react to news about corporate GHG emissions and, if so, in what way. They evaluated companies in both U.S. (S&P 500) and Canadian (Toronto Stock Exchange 200 (TSE)) markets. To do so, they used data on GHG emissions and disclosure quality from the Carbon Disclosure Project (CDP) for the S&P 500 for CDP reporting years 2006–2009 and large TSE companies for CDP years 2005–2009. They developed a sample of 1,083 company-year emissions observations, including 824 for the S&P 500. Their analysis indicated that the CDP response rate correlated positively with emissions and disclosure quality. Interestingly, the authors estimated missing GHG emissions data (for companies that did not report such data publicly) by estimating emissions as a linear function16 of economic sector, total revenue, capital expenditures, intangibles, gross margin, and long-term debt to total assets. They used the resulting parameter estimates to assign GHG emissions to nondiscloser S&P companies. They then assessed valuation relevance by regressing market price as a function of actual or estimated GHG emissions and several other variables. The authors also conducted an event methodology study by collecting company news items in SEC 8-K reports from January 1, 2005 to January 1, 2010 that related to climate change, because these would, by definition, be considered material to investors.17 This process yielded a final sample of 1,540 8-K filings, of which 1,395 contained a press release. The authors used these data to evaluate investor response as a function of emission intensity, GHG emissions, company size, disclosure quality and disclosure status, and country. They generated the following results:
• Discloser companies generally had higher average GHG emissions within each sector and country, but discloser and nondiscloser companies were, for the most part, equally profitable.
• In terms of market valuation, they found that higher emissions had a statistically significant and negative impact in each of 15 different regression scenarios. They concluded that GHG emissions explain market price as a negative valuation factor, along with several others. It is more negative in the case of U.S. companies (relative to Canadian firms) and for emission-intensive versus non-emission-intensive companies. Thus, investors price stocks as if higher intensities of GHG emissions will impose additional future costs.
• GHG emissions imposed significant negative valuation effects regardless of whether a company reported to the CDP. In other words, the market acts as if the CDP surveys are not the only source of information about carbon emissions (which, of course, is an accurate depiction of reality).
• In terms of short-term market reactions, 8-K news announcements showed a higher return response on the day of announcement than on other days, as well as significantly higher adjusted volume. Thus, when more attention is placed on the news via a press release, investors react more. In addition, the market response to 8-K filings with a company press release exceeded the response without a press release.
• Results showed a significant negative residual return for 8-K filings of emission-intensive companies and a significant positive residual return for 8-K filings of non-emission-intensive companies, increasing to an almost 2 percent spread after ten days. This result also held approximately equally for CDP disclosers and CDP nondisclosers. This again suggests that in an efficient market, investors rely on a broad set of information, not just disclosures made public through the CDP.
The authors concluded that their findings have implications for market reaction tests of materiality and loss causation in securities litigation. The findings showed a statistically significant stock price adjustment that is reliably attributable to a climate change disclosure not attenuated by other factors. However, the authors disclaim the idea that their results support increasing mandated disclosure, because they found the same empirical relations regardless of whether a company disclosed to the CDP.
Collectively, these studies show that stock and bond market participants do pay attention to news and events that they believe affect the present and future value of their investments in specific companies. These studies also show that the effects of both positive and negative news on company market value can be both measurable and significant. Finally, given the vintage of these studies (most date from the 1990s), it might be assumed that by now it would be well understood that a strong environmental/ES&G posture and improving performance have a real impact on company valuation in the marketplace, and that investors and other market observers should pay close attention to developments that pose environmental (or ES&G) risk or opportunity. As discussed in depth in the preceding chapter, however, this expectation would be incorrect, at least as it applies to most investors. This situation is exasperating for many in the EHS/sustainability field (myself included). But it does present value-creation opportunities both to companies that have not yet proceeded far down the sustainability path and to savvy investors who can (or who become able to) distinguish companies that can effectively manage ES&G issues from those that cannot.
Performance of Tailored Investment Portfolios
A number of published studies have appeared over the years examining the performance of investment portfolios constructed using different SRI, environmental, or sustainability criteria, or more formalized evaluation and rating methods. Generally, such studies have shown that SRI/ES&G portfolios either outperform comparable conventional investment portfolios and/or relevant market benchmarks, or they yield returns that are equivalent. This is particularly true if they are focused on EHS endpoints rather than based on exclusionary ethical criteria (such as involvement in alcohol, gambling, or armaments). Some caution is warranted in reviewing the published literature on this topic, particularly works that have been developed or sponsored by vendors of ES&G data, ratings, rankings, and/or related products. Although some of these published studies appear to be sound and quite sophisticated, we must recognize that their sponsors may have a substantial vested interest in their reported results.
Nevertheless, I have found several well-designed, independent studies that examined the performance of investment portfolios that were selected using “green,” SRI, or sustainability rating/ranking tools or indices. They document the absence of any “performance penalty” associated with applying an environmental screen or weighting in constructing a portfolio, particularly one that reflects to any substantial degree the value-oriented approach I advocate in this book:
• Cohen, Fenn, and Naimon (1995) constructed several sets of investment portfolios with similar industry composition and tracked overall performance for three different time periods. They found that the environmental leaders in an industry-balanced portfolio did as well as, and sometimes better than, otherwise similar environmental laggards.
• Statman (2005) conducted an evaluation of the contents and relative performance of four widely followed SRI indexes over a 15-year period (1990–2004). Specifically, he examined the Domini 400 Social Index, the Calvert Social Index, the Citizens Index, and the U.S. portion of the Dow Jones Sustainability Index. As a basis of comparison, he used the S&P 500 index. Several interesting findings emerged from his analysis. Although the composition of each index differs, with varying emphasis on different types of criteria, each had a higher overall “social” score than the benchmark (S&P 500). The SRI indexes exhibited higher returns than the S&P 500 Index during the boom of the late 1990s but lagged it during the bust of the early 2000s. Over the entire study period, returns of the SRI indexes were generally higher than those of the S&P 500 Index, but the differences were not statistically significant. Tracking errors were, however, substantial (several percent), meaning that the SRI indexes often did not track their benchmark index well, making comparisons (such as on quarterly returns data) problematic. The author notes that this error can be reduced by using best-in-class, rather than exclusionary, screening methods to construct the portfolio. These methods were described in the preceding chapter.
• Kempf and Osthoff (2007) examined the effects of SRI screening on investor returns using a variety of screening and trading strategies. To do so, they employed KLD qualitative and exclusionary criteria to establish positive and best-in-class screens and negative screens, respectively. The qualitative screens employed included community, diversity, employee relations, environment, human rights, and product attributes. Ratings were used only for firms included in the S&P 500 and Domini Social 400 to avoid a possible bias from the steep increase in SRI coverage of stocks in (more) recent years. The authors constructed portfolios comprising these stocks and examined their performance from 1992 to 2004. They then conducted a series of comparisons of two portfolios: one composed of firms with high KLD scores, and the other with low KLD scores. These comparisons separately evaluated several investing strategies, including negative screens, positive screens, and best-in-class stock selection, as well as strategies involving buying high-rated portfolios (“going long”) and selling (“shorting”) low-rated portfolios. Results indicated that using SRI evaluation techniques could produce high abnormal returns. The maximum abnormal returns were observed when the authors employed the best-in-class screening approach, used a combination of several socially responsible screens at the same time, and restricted themselves to stocks with extreme socially responsible ratings. Using the long-short strategy, abnormal returns peaked at nearly 9 percent per year when strict cutoffs (the top 5 percent) of firms were applied. They decreased to about 5 percent per year for the top 10 percent cutoff and to 4 percent for the 25 percent cutoff. For the 50 percent cutoff (investing in the top half), the long-short strategy no longer yielded a significantly positive alpha. The authors concluded that investors should concentrate on the best stocks with respect to SRI screens. The positive abnormal returns obtained through using positive screens and best-in-class approaches remained statistically significant even after typical transaction costs were taken into account. Across the different approaches and significance tests conducted by the authors, in no case did negative screening (categorically excluding certain stocks) produce a statistically significant, positive investment return.
• Statman and Glushkov (2008) also compared returns of the companies in the DS 400 and S&P 500 over an extended period, from 1992 to 2007. Their focus, however, was on disaggregating the impacts of negative screens and positive attributes. For each year, they assembled a portfolio of stocks of firms that had one or more perceived strengths and/or weaknesses and ranked them within industry sectors to obtain the best-in-class firms within each. They then distributed them into three more-or-less equal groups and assembled a portfolio that was long on the top third companies and short on the bottom third. Returns were measured for each year according to several alternative model specifications, with the portfolio being reconstituted each year. The authors found statistically significant excess returns for the community, employee relations, and environment characteristics but not for the diversity and products characteristics. Excess returns for the human rights and governance characteristics were negative but statistically insignificant. These differences were magnified when the authors compared the “top overall” (in the top third on at least two characteristics and not in the bottom third on any) with the “bottom overall” (in the bottom third by two or more social responsibility characteristics and not in the top third on any). Excess annualized returns with a high degree of statistical significance (greater than 99 percent) of 5.54 and 6.12 percent were obtained, depending on the model specification. This same type of analysis was performed with “sin” versus other firms. The “sin-free”-tilted portfolio underperformed its counterpart by 2.27 to 3.34 percent per year, although the significance levels for the relationship were weaker than in the previous comparisons. The offsetting effects of the positive and negative screening steps were then observed in a portfolio that was long in the socially responsible DS 400 Index and short in the S&P 500 Index. That portfolio had a positive excess return by each of the three benchmarks. This indicated that the tilt toward stocks of companies with higher scores on social responsibility characteristics increased the relative return of the DS 400 Index relative to the S&P 500 Index by more than the exclusion of “shunned” companies from the DS 400 Index decreased it. But the excess returns of the DS400-S&P 500 long-short portfolio were smaller (on the order of 1 percent per year) and, again, not highly significant. Overall, the authors concluded, socially responsible investors can do both well and good by adopting the best-in-class method when constructing their portfolios. That method calls for tilts toward stocks of companies with high scores on social responsibility characteristics but refrains from calls to shun the stock of any company, even one that produces tobacco.
• In a recent article, Edmans (2011) evaluated the returns of a value-weighted portfolio of the Fortune “100 Best Companies to Work for in America” relative to a basket of otherwise similar companies. He conducted a series of multiple regression analyses, controlling for industry, factor risk, the timing of the announcements of which companies were on the list, and a broad set of other observable characteristics that might influence shareholder returns over time. He found that the 100 best firms posted excess returns (alpha) of 3.5 percent from 1984 to 2009 and posted returns that were 2.1 percent above industry-matched benchmarks. The best companies also exhibited significantly more positive earnings surprises and announcement returns. The author concluded that firms with high levels of employee satisfaction generate superior long-horizon returns. He stated that his quantitative findings have three main implications. First, employee satisfaction is positively correlated with shareholder returns and does not necessarily represent managerial slack or inefficiency. Second, the stock market does not fully value intangibles, even when independently verified by a highly public survey on large firms. Finally, certain SRI screens, such as employee welfare, may improve investment returns.
• Finally, Hoepner, Yu, and Ferguson (2010) attempted to disaggregate the key factors producing the apparent outperformance of SRI portfolios that has been reported in recent years. To do so, they compared the performance of the “Global 100 Most Sustainable Companies in the World” published by the Canadian CSR-focused media company Corporate Knights with a reasonable benchmark index, the MSCI World Index. Companies are selected for the Corporate Knights list based on sustainability ratings produced by Innovest Strategic Value Advisors. An unusual feature of these ratings is that they are both in the form of bond-style ratings (AAA, CCC–) and are industry-specific (so companies from different industries are not compared against one another). The authors assembled the ratings data from January 2005 to May 2008 and compiled a sample of 196 companies from 16 countries (38 from the U.S.) and ten economic sectors. In the aggregate, the sample contained 478 data points that were subjected to multiple regression analysis to evaluate the effects of SRI rating, industry, and country on investment returns. Results indicated that the overall portfolio (companies appearing at least once on the Global 100 Most Sustainable list) outperformed the overall market (alpha of 0.26 percent per month, significant at the 5 percent level). Further analysis showed, however, that at the sector level, most (seven or eight, depending on specification) of the ten CSR leader portfolios did not outperform their industry benchmarks. The authors interpreted this discrepancy as a strong sign of the heterogeneity of the CSR-corporate financial performance relationship across industries. The two industries with a significantly positive CSR effect on investment returns were consumer discretionary and health care, both of which are consumer-facing. The authors concluded that no general relationship between CSR and corporate financial performance exists and that the relationships are far more nuanced than has generally been recognized. They suggested that the value of CSR activities should be assessed in the context of the industrial business processes that exist in particular sectors and industries.
These findings do not categorically demonstrate that more environmentally advanced firms or companies that exhibit common SRI attributes (using particular index-specific criteria) necessarily outperform otherwise similar firms. But they do suggest that ES&G-oriented investment approaches that are focused on value creation tend to outperform other commonly used, comparable investment strategies. At the very least, these studies provide empirical support for overcoming what has been a significant barrier to SRI/ES&G investing: the fiduciary duty to the investor.18 In other words, one investment theory holds that a portfolio of stocks selected on the basis of ES&G criteria must perform at a level inferior to that of a broader portfolio not constrained in this manner. But this theory appears to have been disproven by the available empirical evidence.
Surveys of Corporate and Investor Attitudes and Beliefs
Opinion surveys do not have any direct bearing on the issue of whether well-considered ES&G investments create value for the firm. Nonetheless, they can be useful in helping us understand the current state of affairs and identify potential barriers to the further integration of sustainability into core business practices that I advocate in this book. Moreover, surveys directed at investors and their service providers can provide meaningful insights into whether and to what extent they perceive the ES&G value-creation message and/or are taking steps to implement these concepts into their ongoing activities. A number of surveys and studies have been conducted about the beliefs, attitudes, and actions of the various players involved with sustainability and investing. The number of organizations that have seen fit to weigh in on this topic appears to be growing every year. The following two sections review some of the more relevant and interesting studies.
Investor Attitudes and Beliefs
A review of the more relevant findings from surveys of investors about the importance (or lack thereof) of ES&G issues to investment analysis and decision making provides some interesting insights. An early survey (1998) that a colleague and I conducted confirmed the generally held view that most investors, whether or not they use or represent environmentally screened investment products, did not routinely request information on environmental policies, management systems, performance, or other related issues. More recent studies, however, have suggested that awareness of environmental (along with other corporate social responsibility) issues has been growing and that these issues were beginning to receive more attention within the investor community. In fact, some recent survey results suggest that this interest is both growing and spreading to segments of the U.S. capital markets that historically have been indifferent to ES&G issues and their potential effects on investment returns and risks. A few of the more prominent and interesting studies are profiled here:
• In their study, Soyka and Feldman (1998) developed and administered a written survey to 45 U.S. bond and equity portfolio managers, representing both environmentally screened and “mainstream” (nonscreened) investment styles. The vast majority of portfolio managers in both groups stated that they would pay more for strong environmental performance if (and only if) they were provided with a convincing demonstration of value creation. Furthermore, although virtually no investors routinely asked for EHS program cash flow contribution, almost all expected company management to offer information on EHS value creation without prompting. In other words, investors believed it was incumbent upon company senior managers to articulate and support the value-creation message in their communications with investors, irrespective of the source of this value and whether or not the investor solicited such information.
• In its study, UNEP-FI (2004) reported on the results of its survey of 11 major international brokerage firms. Among the findings were unanimity that environmental, social, and corporate governance issues affect long-term shareholder value, and a widespread recognition that some of these impacts can be profound. Nonetheless, the authors stated that comparative analysis was difficult due to the wide range of reporting practices in use within and between countries and industries. In this regard, more clear government positions (regulations or guidance) would greatly aid financial research by establishing norms for reporting practices. The report also contained several recommendations, including that ES&G issues be addressed in corporate annual reports and financial statements, that pension funds should invest in a manner that reflects the strong links among the three areas, and that governments and regulatory bodies should update fiduciary responsibility regulations and require specific disclosure of ES&G criteria by both companies and stock exchanges. As you saw in Chapter 6, some of these steps are now being implemented in a number of different international jurisdictions and capital markets.
• Mercer Investment Consulting (2006) examined evolving interest in environmental issues based on a survey of investment managers in 157 firms that work in important markets or globally. Selected survey results are summarized in Table 7-1. These data show that, as of five years ago, many or most managers in global investment firms tended to view the issues listed as relevant to their evaluations. Within specific capital markets, however, there were some significant differences between the views held in U.S. firms and those of their counterparts in the United Kingdom (UK) and continental Europe. Similar (and large) percentages believed that issues such as globalization, corporate governance, and terrorism were relevant to investment analysis. But the percentages who believed that environmental issues such as climate change, environmental management, and water (as well as human rights) were relevant were generally two to five times lower in the U.S. than in the UK and the rest of Europe. Percentages of U.S. investment managers who believed certain other ES&G issues were relevant were intermediate between the UK and other European investors. This finding applied to health issues in emerging markets and, interestingly, sustainability.
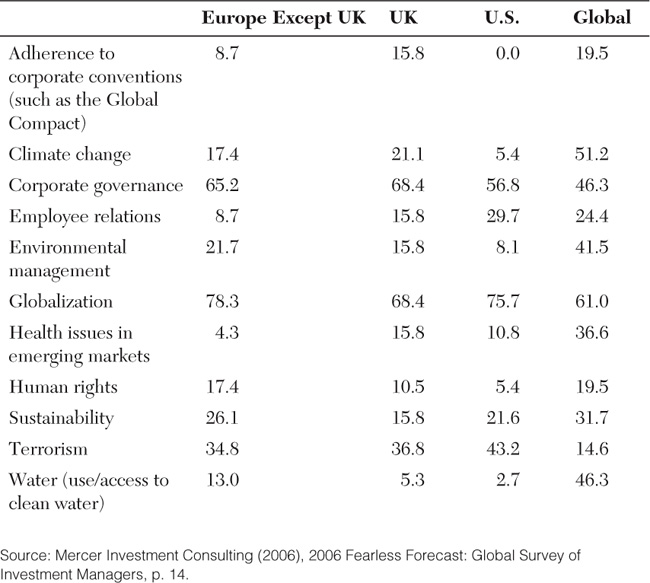
Table 7-1. Perceived Influence of ES&G Issues on Asset Performance
This “lag” in appreciating the importance of environmental issues by mainstream investors in the U.S. has been validated by primary research I have conducted in recent years and in other published work. As described further in Chapter 6, general awareness of environmental/ES&G issues is growing. But belief in the importance of these issues has not yet manifested itself in new patterns of detailed investment inquiry, analysis, and decision making that one might reasonably expect in most U.S. money management firms.
With that said, a recent study by Ioannou and Serafeim (2010) appears to break new ground. It examines the behavior of one influential component of the capital markets—sell-side analysts—that historically has been skeptical of the value of SRI and sustainability investing more generally:
• The authors reviewed analyst ratings and CSR and financial data on a large number of U.S. firms over an extended period (1992–2008). This provided both an extensive database and results that have historical depth and are relatively contemporary. The study focused on the overall impact of CSR strengths and concerns on sell-side analysts’ recommendations. It also looked at how CSR information has been processed along with other types of data to affect analysts’ perceptions of value creation and, therefore, their projections and recommendations. The authors set out to characterize conditions at the firm and at the analyst level that could potentially affect the perception of CSR value creation (or destruction). CSR performance data were obtained from KLD and aggregated across all areas of interest to produce one rating each for every firm’s CSR strengths and concerns by year. Each strength and concern was weighted equally. The sample included 20,715 observations with available data for all variables from 1993 to 2008 and from 546 (1993) to 2,698 (2008) U.S. companies. Over the years, 4,109 unique U.S. companies were included in the sample. The authors then performed a series of multiple regression analyses using the consensus analyst recommendation as the dependent variable. Findings showed the following:
• In the earlier years (1993–1997), firms’ CSR strengths had a significant negative impact on analysts’ recommendations, but the trend reversed, and subsequently, the impact became significantly positive. The authors stated that these results suggest a change in analysts’ perceptions. As time passed, CSR strategies were perceived to be more legitimate, capable of creating value, and less likely to produce uncertainty about future cash flows and profitability.
• Results did not show that the reverse was true for CSR concerns. In other words, analyst ratings did not become increasingly negative over time because of growing acceptance of CSR concerns. Empirical results showed an interesting asymmetrical effect. Analysts perceived CSR strengths as value-creating and, as such, rewarded them with more favorable recommendations. CSR concerns were not perceived as value-destroying and, as such, were not penalized with less favorable recommendations.
• Results provided strong evidence that analysts of higher ability were more likely to appreciate CSR strengths and incorporate them favorably in their recommendations, suggesting that CSR strengths are perceived to be value-creating. Interestingly, the reverse was not true for CSR concerns and, therefore, CSR-weak firms. Moreover, because higher-ability analysts tend to produce more accurate evaluations and exert more influence on capital markets, the authors believe that they have documented a mechanism through which CSR strategies are perceived as value-creating and, through analyst recommendations, are translated into economic value in the capital markets.
• Analysts perceived CSR strategies implemented by larger firms more favorably. CSR concerns were perceived to be relatively more value-destroying for higher-visibility firms.
The authors concluded that corporate executives and managers interested in implementing CSR strategies in their organizations should be aware that negative analysts’ reactions, and subsequent value destruction in capital markets, is a real possibility when they initially attempt to implement such strategies. Accordingly, they suggested that managers focus on communicating the value of their CSR strategies to the investment community. In particular, highlighting short-term costs but also long-term benefits could mitigate difficulties that investors may face in understanding the value generated through such activities. It also might expedite the adjustment of analyst valuation methods to these new CSR-augmented business models.
Corporate Executive Attitudes and Beliefs
Despite some lingering skepticism and a notable gap between aspirations and reality in terms of corporate sustainability practices (discussed in depth in Chapter 8), attitudes and beliefs within the executive suite about the business value of sustainability are evolving rapidly. Several published studies presenting the results of extensive surveys of corporate senior executives over the past several years illustrate this phenomenon:
• The Economist Intelligence Unit and Oracle Corporation (2005) conducted an online survey in 2004 of corporate executives worldwide, as well as a separate survey of institutional investors. The study and its findings are somewhat noteworthy in part because the editors of The Economist had historically been highly and publicly skeptical of the business value and relevance of sustainability and corporate social responsibility. The authors received completed responses from 136 executives and 65 investors. Within this combined group, 85 percent said that CSR was central or important in making investment decisions. This was almost double the percentage responding in a similar way on another survey conducted five years previously. Among the corporate executives, the three most important aspects of CSR were ethical behavior of staff (named by 67 percent), good corporate governance (58 percent), and transparency (51 percent). The investors named the same aspects as most important, but in reverse order: transparency (68 percent), good corporate governance (63 percent), and ethical behavior of staff (46 percent). Interestingly, 84 percent responded that they believed that CSR practices could help improve a company’s bottom line. The most important benefits of CSR in this regard were perceived as brand enhancement (61 percent) and better morale (67 percent). The most important obstacles were perceived as the cost implications of implementing CSR (42 percent) and its unproven benefits (40 percent). Respondents also indicated the strong belief that an internal focus was much more important than an external one in addressing CSR.
• More recently, consultants at the Boston Consulting Group published the results of a major survey effort in the MIT Sloan Management Review. In this study, Berns et al. (2009) received more than 2,000 responses to a 20-question electronic survey they developed based on interviews with about 50 “thought leaders” in the sustainability field. About 75 percent (1,560) of these responses were from senior executives and managers in for-profit enterprises. The remaining 462 responses were received from nonprofit executives, academics, government officials, and others. Responses from North American organizations comprised 28 percent of the total in this global survey. Survey results provided a number of interesting findings:
• More than 92 percent of survey respondents said that their company was addressing sustainability in some way. Less than 25 percent of survey respondents said that their company had decreased its commitment to sustainability during the economic downturn.
• There was considerable variation in how respondents defined “sustainability.” About 25 percent of respondents each applied the Brundtland Commission definition, “climate change, environmental, social, and economic issues,” and “maintaining the viability of our business.” Only 5 percent of respondents defined sustainability as “social responsibility issues.”
• Responsibility for addressing sustainability appears to be diffuse in many companies. Thirty-six percent of respondents said “all employees” were responsible, 13 percent said it was unclear, and 7 percent said that they do not address sustainability. In contrast, 22 percent responded that a corporate or cross-functional group had the lead, and 15 percent said responsibility rested with a senior executive.
• The “business case” for sustainability remains elusive, with only 31 percent of respondents indicating that they had developed the business case or a proven value proposition. Very large companies (more than 100,000 employees) were most likely to have developed the business case.
• Interestingly, “outmoded mental models and perspectives on sustainability” was cited as the leading internal challenge (by 21 percent of respondents), followed by competing priorities and unclear business case/value proposition. More than 30 percent of those who considered their knowledge of sustainability “expert” reported that outdated models and perspectives were the most important barrier—twice as many as for any other response. Only 5 percent of respondents said that the leading challenge was lack of knowledge of the most effective ways to take action. Among North American respondents, by a wide margin, the lack of a business case was the most important factor cited.
• The leading external challenge (cited by 26 percent) was insufficient customer demand, followed by lack of clear regulatory policy for externalities (at 20 percent). This pattern was especially strong among North American respondents.
• In terms of the most important benefits of sustainability, improved company/brand image was by a wide margin the most frequently cited (at 35 percent of respondents), followed by cost savings, competitive advantage, and several others, at 10 percent or less.
• Most respondents expect sustainability to pay off. Fifty-five percent believe they will obtain either incremental or material, differentiated financial returns. Only 11 percent believe that the financial impacts will be negative. Twenty-one percent stated that financial logic is not part of their decision making on sustainability.
• In terms of the most important stakeholders driving sustainability in companies, senior leadership (at 40 percent) is by far the most significant across the respondent population, followed by consumers (18 percent), employees (12 percent), and government regulators (12 percent). Investors and other capital providers were selected as most important by only 8 percent. Environmental NGOs and community activists were each viewed as most important by 3 percent of respondents or less.
• Finally, the most important organizational capabilities for companies cited by respondents included vision and leadership commitment (62 percent); product, service, and market innovation (43 percent); and business model or process innovation (39 percent).
The authors also reported a high correlation between the depth of a business leader’s experience with sustainability and its perceived benefits. They concluded that the more people know about sustainability, the more thoughtfully they evaluate it, and the more they think it matters to how companies manage themselves and compete in the marketplace. They also concluded that sustainability will become increasingly important to business strategy and management over time, and that the risks of failing to act accordingly and decisively are growing.
• Deloitte (Park and Pavlovsky, 2010) conducted a qualitative study in which they interviewed designated sustainability leaders at the U.S. headquarters of 48 large companies from late 2009 to early 2010. Participants represented companies from five major industry sectors: automotive, consumer products, process and industrial, technology, and telecommunications. Out of 48 respondents, all but three reported that their sustainability priorities were at least partially aligned with their organizations’ business priorities. In general, respondent firms emphasized the environmental component of sustainability over social and governance issues. In fact, some respondents reportedly omitted the social side of sustainability from their definitions. Those who did report social sustainability initiatives commonly focused on improving working conditions for their own employees, although some also mentioned broader community- or region-based efforts. Sixty-five percent also discussed priorities related to improving the environmental sustainability of their products. The areas perceived as offering the greatest opportunities for becoming more sustainable included manufacturing process and operations (46 percent), brand enhancements and perception (31 percent), and supply chain (21 percent). Generally, respondents believed that a wide range of internal constituents are affected by sustainability efforts, suggesting a growing recognition of sustainability’s enterprise-wide scope and impact. In addition, 66 percent of respondents reported that sustainability had or likely would have some type of impact(s) on their fundamental business model. Finally, the majority of respondents (73 percent) did not believe that sustainability would lead to the creation of a new “green collar” workforce. Instead, they believed their existing employees would need to develop new knowledge and skills, as required to meet future sustainability challenges.
• Also in 2010, The Economist Intelligence Unit published the results of a new and substantial survey of sustainability beliefs and behaviors within the international business community (Watts, 2010). The author of the study surveyed more than 200 senior executives in the areas of sustainability, corporate social responsibility, and finance. He also conducted ten in-depth interviews with corporate executives, academics, and industry experts. He stated that the survey findings documented that leading companies were making progress toward sustainability goals. The great majority of respondents (86 percent) agreed that sustainability will become more important over the next three years. Of these, 46 percent strongly agreed. In terms of underlying motivations, the most important reason cited for promoting sustainability policies was that it is the right thing to do ethically (56 percent), followed by complying with laws and regulations (45 percent) and improving the company’s image (43 percent). On the other hand, only 24 percent of respondents agreed that a strong link exists between financial performance and commitment to sustainability in the short term. But that percentage nearly tripled (to 69 percent) when the time frame in question was the long term. In terms of emphasis, survey respondents tended to favor areas such as creating a code of ethics (51 percent) and promoting environmental protection (50 percent). This behavior appeared to be motivated by a desire to develop new corporate strategies (such as selling green products) and improving public image. The responding executives also reported efforts to embed sustainability into a variety of corporate functions, including supply chain relationships (29 percent), improving energy efficiency (38 percent), educating employees on sustainability (32 percent), and engaging employees in sustainability-related activities (30 percent). More than half (54 percent) reported that their sustainability efforts had been led by senior management. In terms of providing incentives for greater sustainability-oriented behavior, the most widely used was employee recognition programs (38 percent); only about one in five (18 percent) linked compensation to sustainability indicators. But the author reported that anecdotal evidence suggests that this practice is growing. Finally, only about half (49 percent) of the leading companies participating in the survey reported progress in meeting their environmental sustainability goals. Slightly more (53 percent) reported progress on meeting social sustainability goals. Despite this lack of complete success to this point, the respondents broadly agreed that stating goals and reporting progress toward those goals are essential components in pursuing sustainability.
Summary and Implications
In summary, the literature findings briefly reviewed here demonstrate that ES&G issues can have a meaningful impact on the firm’s financial success. Comprehensive, systematic, and business-driven approaches such as those described in Chapter 5 should, accordingly, be of interest both to executives managing companies and to financially oriented external audiences, including investors. Despite the substantial and steadily mounting evidence of the ES&G-financial value connection, however, much remains to be done. Areas that deserve emphasis include the following:
• Consistently finding the sources of value in corporate ES&G management activities
• Effectively communicating these value sources and, importantly, the internal corporate conditions required to find and capture financial value to financial market audiences
• Translating the relevant measures of corporate ES&G posture and performance into financial valuation metrics
• Integrating these measures into financial valuation models
The literature reviewed in this chapter has revealed the following overall findings and insights:
• Well-chosen pollution prevention, eco-efficiency, and similar initiatives more than pay for themselves, both at the project level and, if practiced consistently and on a sufficiently broad scale, at the firm level.
• Both actual and prospective ES&G liabilities may be quite significant in magnitude, vary across firms in the same industry, and be quantified with a reasonable degree of precision. Information on these liabilities, and their magnitude and probability of occurrence, are of abiding interest to investors, bond rating agencies, and other financial market audiences. The fact that these issues have been chronically underestimated and unreported is a serious barrier to full and correct valuation of company securities. It suggests a need for more rigorous enforcement of existing disclosure rules.
• There is a strong positive correlation between improved, beyond-compliance, proactive environmental and ES&G management practices and the firm’s value. Market-relevant financial benefits may be obtained through appropriate investments in improving a firm’s sustainability posture and performance. Results also suggest that such investments, which enhance the firm’s intangible assets, are translated over time into increased shareholder value.
• The evidence suggests that the cost of equity capital is lower for firms with relatively advanced environmental management practices or, more generally, superior sustainability performance. At the same time, however, investors do not appear to value sustainability disclosure per se but instead are interested in firms’ actual performance. Moreover, some evidence exists that companies that report better sustainability performance also attract additional dedicated institutional investor and analyst coverage as well as lower analyst forecast errors (such as of future earnings).
• With that said, not all ES&G aspects appear to offer the same financial value creation potential. Empirical evidence suggests that investing in improved employee welfare/relations, environmental policy/performance, and product characteristics substantially contributes to reducing firms’ cost of equity and potentially offers other financial benefits. Investments in several other common CSR domains, including community relations, diversity, and human rights, do not. In addition, firms involved in some businesses posing high ES&G risks, such as tobacco and nuclear power, appear to have higher equity financing costs, whereas others (alcohol, firearms, military products) do not.
• Such effects also can be discerned in individual company valuations. Several studies have shown that a tailored and sophisticated approach to ES&G portfolio construction can enable an investor to outperform the relevant market benchmarks. Again, the focus must be on the corporate endpoints and activities that have the most clear relationships to enhancing revenues, cash flows, and earnings and/or reducing risk. Empirical findings suggest that a focus on the best companies within a given sector offers the most favorable return prospects. They also suggest that positive screening and best-in-class approaches are far more effective than other commonly used ES&G/SRI stock selection methods. At the same time, however, the evidence is equally strong that rigid negative screening and other more crude approaches to ES&G investing do not outperform. Indeed, they may induce returns that lag the market as a whole.
• The literature on ES&G issues and the credit markets is much more limited than it is for equity markets, but it is increasingly clear that credit markets are sensitive to environmental liabilities. In particular, the key issues of climate change and regulatory concerns have been linked to firms’ higher expected default risk. This leads to higher interest rates and costs for companies that have not demonstrated adequate management control over these issues.
• More generally, climate change is emerging as an issue that is being carefully evaluated by investors and other capital market participants. Robust evidence has been published showing that higher GHG emissions are viewed as a negative valuation factor, particularly in emission-intensive industries. In recent years, even in the absence of explicit carbon emission limits in the U.S., investors have begun pricing stocks as though GHG emission intensities will impose additional future costs, thereby limiting earnings and return potential.
• Several investigators have concluded that the relationships between sustainability and financial performance are heterogeneous across industries. Some have suggested that the investor or analyst should assess firms in the context of the industrial business processes extant in their industries. This implies taking a more sophisticated and nuanced approach to ES&G analysis and evaluation than is typical today.
• On a related point, as in other fields of endeavor, some research suggests that ES&G analysts who are more knowledgeable and experienced, and/or have more resources available to them, can outperform their less-experienced or -advantaged peers. This implies that for many participants in the capital markets, additional personal investment to broaden their knowledge base and competencies will be required to perform ES&G investing successfully.
• Corporate senior managers, particularly those who interact with investors and analysts, also need to more consistently and fully communicate the financial value of the investments they are making in sustainability-related activities. Empirical research has shown that participants in the capital markets uniformly believe that it is the responsibility of company senior managers to articulate and support the value-creation message in their communications with investors. This is true irrespective of the source of this value and whether or not the investor solicits such information. This is particularly important for ES&G issues, given the substantial knowledge gaps that exist in many segments of the U.S. capital markets. In this regard, explaining that ES&G policies, programs, and activities are investments (not expenses) that impose short-term costs in pursuit of long-term benefits could mitigate some of the remaining skepticism that exists within the mainstream investor community. In the process, helping investors understand exactly how financial value is being generated through such activities will help expedite the adjustment of analyst valuation models to new formulations that explicitly consider sustainability endpoints and provide more accurate and useful predictive power.
• For their part, corporate senior executives as a group are beginning to respond to the business imperatives posed by sustainability issues. Recent surveys of executive beliefs and behaviors indicate that the greater the depth of a business leader’s knowledge of and experience with sustainability, the more likely it is that he or she will understand and value its perceived benefits. They also are increasingly coming around to the view that sustainability is or will become important to business strategy and management during the next few years, and that the risks of failing to act accordingly (and decisively) are growing.
• In terms of the specifics, it is clear that there is still no widely accepted, commonly applied definition of sustainability. Many companies are still grappling with how to address ES&G considerations at an organizational level. Among those with a more sophisticated understanding of the sustainability issue, it appears that there is a growing recognition that new ways of thinking about value creation and how best to operate the business in response to ES&G imperatives will be required. Perhaps some of the ideas offered in this book will be of value to those struggling with how best to overcome the outmoded mental models and perspectives by which they are currently constrained. Even with the many uncertainties that exist, a large and growing percentage of companies in the U.S. and around the world are embarking on new initiatives to pursue corporate sustainability. Most executives responding to recent surveys appear to believe that these efforts will produce financial benefits (will have negative costs and/or produce revenue gains). Many also recognize, as suggested in Chapter 5, that, as senior leaders, providing both vision and their personal, ongoing involvement and support will be vital if their firms are to be successful in creating new sustainability-driven value.
From the foregoing, it is clear to me that the business and financial value of well-designed and -implemented ES&G strategies, policies, and practices are no longer in doubt. Increasingly, capital market participants are aware of the ways in which industry and firm-level sustainability posture and performance affect the return potential and risk of company securities. They are beginning to factor these considerations into their valuation models and decisions. This suggests significant opportunity for companies that have not yet expanded their worldview, business strategy, and/or operations to include ES&G considerations. Although not all investments in EHS, social, governance, or community activities can be expected to yield financial benefits, it is clear that many do. Accordingly, the key task is to develop and implement the means to make rational judgments about how best to deploy the firm’s financial, material, and human capital in pursuit of ES&G improvements. The evidence suggests that companies that take these steps and that can execute effectively can reap significant financial rewards.
In contrast, firms that continue to operate as they have in the past, treating EHS&G obligations and other activities solely as costs to be avoided or reduced, run the risk of being left behind and having their competitive position eroded. The published literature convincingly demonstrates that unmanaged environmental risks and liabilities can depress profitability, increase volatility, and corrode the firm’s asset value (both tangible and intangible). Having worked in the environmental field for an extended period, I can accept the idea that at one time a passive, minimalist strategy toward EHS compliance and management of other sustainability issues could be justified. However, I am far less convinced that such a strategy is tenable in a world with an increasingly demanding and informed set of stakeholders and a set of well-established, proven management practices that are available for use by, essentially, anyone.19 So the conventional excuses are becoming less convincing with each passing year.
This applies as surely to firms that may have been regarded as environmental or EHS leaders at one time but that in recent years have scaled back their commitment, management attention, and investments in EHS excellence as it does to others that could be considered laggards.20 As I stated somewhat forcefully in Chapter 1, such companies need to address their “deferred maintenance” before they take on any new sustainability initiatives or proclaim their “greenness” or sustainability virtue to internal or external stakeholders.
This chapter and the preceding one have presented some important foundational concepts and evidence for the financial value-creation potential (and reality) of well-crafted corporate sustainability strategies, policies, and practices. The next chapter turns to a key component of both internal sustainability efforts and the evaluation of these efforts and their results by investors and other external stakeholders: performance measurement and ES&G data, knowledge, and insight.
Endnotes
1. Additional details on many of the studies profiled here and their specific findings can be found in several of my previous works, including Soyka, 2010, and USEPA, 2006.
2. Interestingly, some European institutional investors (such as the Swiss investment bank Sarasin & Co.) explicitly evaluate the environmental risks (and opportunities) associated with both corporate bonds and debt securities issued by sovereign governments.
3. As noted in Chapter 6, capital investment costs required to comply with the technology implications of new standards can be significant. Interestingly, the firms profiled in the latter study (pulp and paper mills) were faced with differential requirements from a tightening of existing standards to protect water quality-impaired streams. These requirements were established many years after the initial leap to control “end of pipe” water pollutant emissions had been made.
4. As discussed in Chapter 5, I advocate the use of such global sustainability policies, objectives, and systems to promote internal clarity, consistency, and credibility, as well as efficiency.
5. Innovest was acquired by RiskMetrics in 2009, which was in turn acquired by MSCI, Inc. the following year.
6. As discussed in Chapter 6, beta is a measure of a given company’s stock price volatility over time. Higher betas imply a higher cost of equity capital (return required by the investor). A higher required return implies a lower stock price, all else being equal.
7. These variables include company size, intangible asset value, leverage, and/or stock price momentum.
8. Whether this categorization scheme is sensible and reflects the reality on the ground is a question that could be vigorously debated. Based on my past work, I believe that EHS professionals employed in the food and beverage processing and pharmaceuticals industries would point out that their production facilities are extensively regulated and that maintaining continuous regulatory compliance, much less ongoing performance improvement, requires significant vigilance, effort, and resources.
9. As discussed in Chapter 6, KLD is now a unit of MSCI, Inc.
10. This means that there is only a 1 percent chance that the null hypothesis was true. In this case the hypothesis was that the cost of equity capital of firms with low CSR strength ratings was the same as that of firms with high CSR strength ratings. In other words, there was a 99 percent chance that the two groups were different, with the distinguishing feature between them being high and low CSR rating.
11. Basis points are commonly used in financial calculations, data, and communications. One hundred basis points equals 1 percent, so ten basis points equals one-tenth of 1 percent.
12. Yield spread is the difference between a bond’s offered yield and that of a U.S. treasury-issued bond of comparable size and time to maturity.
13. As discussed in Chapter 6, form 10-K is a standard disclosure required of publicly traded companies on an annual basis by the U.S. Securities and Exchange Commission (SEC).
14. A chemical plant explosion in Bhopal, India killed hundreds and seriously injured thousands of workers and people in the surrounding community. Among the other consequences of this tragedy were the crippling and ultimate dismantling of the U.S. chemical company that owned the plant (Union Carbide) and the enactment of the Emergency Planning and Community Right to Know Act (EPCRA). The Act established mandatory reporting of releases of toxic chemicals to the environment, regardless of industry, as well as several other far-reaching provisions.
15. The Superfund Amendments and Reauthorization Act, enacted in 1986, reinforced and added several new provisions that expanded the reach of this revolutionary piece of environmental protection legislation.
16. Note that for some independent variables, the relationship was assumed to be linear in logarithmic form.
17. Under present SEC rules (adopted in 2004), an 8-K report must be filed within four days of the date of the actual event or company news release. The list of items subject to an 8-K report is extensive and covers all material items relating to financial statements not disclosed elsewhere. See the SEC’s final rule at www.sec.gov/rules/final/33-8400.htm for further details.
18. Recall that in the U.S., fiduciary duty has historically been interpreted to mean that only the goal of maximizing financial return (subject to a given level of risk) may be considered by an investment trustee (such as a pension fund). All other factors, such as environmental performance, are viewed as either irrelevant or detrimental to shareholder financial interests and may not be considered. Further discussion of this issue, and recent significant events, was presented in Chapter 6.
19. In this regard, I note with some interest that courses, tools, and guidance materials on EHS compliance, quality and environmental management systems, pollution prevention, lean manufacturing, and related topics are offered by a plethora of state and local governments, community colleges, industry and trade groups, and nonprofit organizations all over the U.S.
20. Laggards or, more charitably, very late adopters are present in every sector of the economy and in virtually every major industry. Chapter 8 offers some examples and a general sense of where American industry stands in this regard.