5. Transformation Methods and Green Sigma
5.1. Transformation Methods Facilitate Implementing Initiatives
New legislation, community pressure, or customer-safety concerns have historically spurred initiatives that benefited the environment. Section 1.1 in Chapter 1, “Driving Forces and Challenges That Organizations Face,” provides examples of such improvements, and all stakeholders of society—from government lawmakers to corporate executives and consumer advocates—deserve the credit. In recent years, many companies have developed their own green strategies specifically to foster environmental stewardship, methodically identify new opportunities, and prioritize investment decisions to meet internally driven objectives and respond to external driving forces (described in Chapter 1, Section 1.3).
Chapter 2, “Formulate Green Strategy to Complement Traditional Strategy,” and Chapter 3, “Green Strategy Supports Operational Improvements,” describe how these strategies can foster a common culture of awareness and action, complement and strengthen traditional business strategy, drive operational decisions and transformation initiatives that improve the environment, and often offer attractive and cost-effective value propositions. They also help determine where to focus investments and resources for the greatest environmental improvement. To implement these strategies, applying the appropriate transformation methods and tools is just as important in the area of environmental stewardship as for any other business area.
Whether an enterprise explicitly develops a comprehensive green strategy and clear action plan or relies on more decentralized or grassroots efforts to pursue opportunities in environmental stewardship, effective transformation methods are ultimately needed to launch and execute improvement initiatives. Not surprisingly, methodologies designed to reduce waste are well suited to help companies that are working toward environmental-improvement objectives, such as reducing their carbon footprint and conserving natural resources.
Because of their focus on efficiency and waste reduction, organizations can readily adapt Lean practices, Six Sigma, and other mature business-transformation methodologies, and directly apply them to initiatives that improve the environment. Recent advances in regulations, technology, and standards make applying these methodologies to improve the environment even more compelling. Public and private enterprises have developed and applied such methodologies to support transformation for environmental stewardship.
In one example, the Office of the Federal Environmental Executive (OFEE) promotes the use of environmental management systems for planning and implementation tools to help federal agencies become better environmental stewards.[1] In another example, the Environmental Protection Agency (EPA) is working to improve state agency processes and environmental protection by adapting Lean and Six Sigma methods.[2] The Federal Highway Administration (FHWA) utilizes methods and tools, ranging from simple checklists to sophisticated online databases, to ensure that environmental commitments are implemented and results are tracked.[3]
Spanning a broad range of sectors and company sizes, private industry also applies well-adapted methodologies to support environmental stewardship. PepsiCo, the Fortune 100 snack and beverage company, minimizes the impact of its business on the environment “with methods that are socially responsible, scientifically based, and economically sound.”[4] Burt’s Bees, a smaller company that creates natural, Earth-friendly personal care products, has “sophisticated and measurable methods” to minimize environmental impact.[5] Ricoh, a $17 billion Japanese-based company that offers digital office solutions, utilizes a “sustainable environmental management evaluation method” to gain an understanding of the impact caused by all its businesses, using eco-balance and integrated environmental-impact evaluations. This method includes selecting measures for environmental accounting and evaluation of activity results.[6]
In addition to cost- and efficiency-focused methods, companies can adapt methodologies and tools that more directly support revenue-growth objectives. Innovation management methodologies can readily include new sources for “green” input in ideation; research and development–stage gate processes can include environmental stewardship factors as new product and service offerings are reviewed and tested; and product portfolio priorities, analyses, and tools can include green elements in addition to traditional ones. Other methods, such as those for customer segmentation and forecasting, should now consider trends of the green movement and even anticipated legislation in environmental stewardship that will change market dynamics. Companies can also adapt approaches to product lifecycle management (PLM) and other methods for managing products and services throughout their lifecycles, to align with environmental stewardship objectives. For example, companies can opt for “planned upgrading” or “planned refurbishment” for customers instead of “planned obsolescence” and products with short life spans. Companies can also recast methods for gathering and responding to market intelligence, to include a focus on environmental factors and preferences, such as methods for conducting surveys and leading customer focus groups with early adopters, the early majority, the late majority, and laggards. Although the rest of this chapter focuses primarily on a methodology to reduce waste, improve efficiency, and better manage natural resources for environmental stewardship, remember that enterprises use a portfolio of methods to achieve their business objectives, and most of these can be adapted to include factors for environmental stewardship in some way.
Green Sigma, developed by IBM, is one methodology that applies a proven process and incorporates newly developed analytic and technology solutions. It leverages the traditional Lean and Six Sigma methodologies and includes the necessary tools to identify, implement, and sustain improvements. The Green Sigma methodology is described in detail in this chapter and applied to an actual case in the next chapter; although many approaches exist, this book illustrates only one approach in detail. The leading practices of using a proven and repeatable transformation process, applying rigor in using the process, and leveraging a prescribed set of tools across a broad range of initiatives are relevant to many other methods that can also help enterprises reach their environmental stewardship goals.
The Green Sigma methodology incorporates lessons learned and leading practices from a long history of energy conservation and environmental stewardship within IBM and with its clients, dating back to the early 1970s. IBM was the first semiconductor manufacturer to establish a numeric goal for reducing perfluorocarbon (PFC) emissions in 1998. Between 1990 and 2007, the corporation conserved 4.6 billion kilowatt-hours (kWh) of electricity consumption and saved more than $310 million from annual energy-conservation efforts. During the same time period, IBM also avoided 3.1 million metric tons of carbon dioxide emissions.
IBM is also experienced in the strategic procurement of renewable energy. In 2001, the company purchased 11 million kWh of renewable energy and renewable energy credits (RECs). By 2007, that amount had increased to 455 million kWh, accounting for 8.5 percent of its total global electricity purchases.[7] The company also led the industry in reducing PFC emissions from semiconductor manufacturing by 55 percent.[8] IBM has well-established telecommuting and work-at-home programs, to help employees both balance work and life better and lower their carbon-footprint contribution from less commuting. Nearly 40 percent of its workforce is mobile.[9] These are only a few samples of the experience that has helped shape the Green Sigma methodology.
In 2008, IBM’s plant in Poughkeepsie, New York, which develops and manufactures powerful and complex servers, mainframes, and supercomputers, was identified as one site for a Green Sigma initiative. In this example, the plant found it could reduce the environmental impact from end-to-end supply-chain operations, drive cost savings, and improve productivity through more efficient management of energy, materials, and natural resources while minimizing waste and emissions.[10] At facilities in Burlington, Vermont, and Fishkill, New York, techniques such as the ones in this methodology have reduced water consumption by 27 percent, with savings of $3 million.[11]
This chapter explains the Green Sigma methodology, and the next chapter applies it to a manufacturing and warehouse facility in an actual case study. By following Green Sigma’s five steps, applying analysis tools, and implementing a management dashboard system, IBM achieved energy savings of approximately 20 percent, as described in the case study.
Applying methodologies such as Green Sigma and implementing the associated technology tools represent an important milestone for an enterprise on the journey to intelligent information for environmental stewardship. Early activities focus on mining existing data and applying new analytics to capture “quick wins,” reducing costs, and increasing efficiency in products, services, and infrastructure. Then an organization can focus on standardizing regionally, installing new sensors and information sources, and working toward integrating systems, sharing knowledge, and deploying leading practices worldwide. In medium- to long-term activities, an organization can leverage an intelligent information base to optimize greenhouse gas emissions and manage natural resources. Figure 5.1 illustrates how initial investments focus on environmental improvement with cost-driven business benefits. With the information-management structure in place, new opportunities make themselves available that might not otherwise have been possible.

Figure 5.1 Focus evolves over time with the Green Sigma methodology
For context, it’s helpful to understand some fundamentals of the traditional Lean and Six Sigma methodologies before describing Green Sigma in detail. The Lean methodology focuses on efficiency, waste reduction, and concepts of pull versus push on customer demand. Examples of Lean methodologies are the well-known “just-in-time” (JIT) approach to inventory management and the Toyota Product System (TPS). The traditional Six Sigma methodology focuses on process capabilities as they relate to quality, defects, and variation, to better meet customer requirements. The methodology incorporates business process management as a foundation to manage processes with data, and identify and select improvements to implement. It also enables the design of new processes, or Design for Six Sigma (DFSS), which addresses the prevention of defects. These practices use statistically based tool sets and have been responsible for driving significant savings and quality improvements across all major industries. Many companies have institutionalized Six Sigma coaches and mentors (called master black belts), project leads (black belts), and project members (green belts) as a core organizational competency. Many existing references describe the traditional Lean[12] and Six Sigma[13] methodologies in further detail.
Figure 5.2 shows the five steps of the Green Sigma methodology that align with proven practices from traditional Lean and Six Sigma. The first two steps involve defining key performance indicators and establishing a measurement system. The next two steps involve deploying a management dashboard system and optimizing processes. The fifth step involves controlling performance and establishing an environment of sustainable quality and continuous improvement.
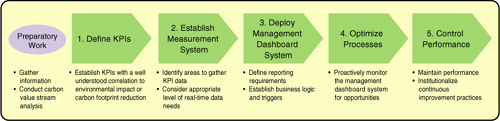
Figure 5.2 The Green Sigma methodology’s five steps
Preparatory work is expected at the start of this methodology. Available data is collected, including any reports from existing carbon diagnostics, carbon modeling, or energy assessment and audit reviews. This data includes gas and electricity invoice history, and other energy and utility payment history, such as water usage. Relevant operational data is also collected, such as operating schedules, timing for when different building areas are occupied and vacant, and sources of energy loss, such as doors, windows, ducts, roof vents, and chimney stacks. Detailed data from established metering inside a facility is also collected and analyzed. For major systems, such as boilers, water heaters, and chilled water production, thermal analysis is performed to quantify energy losses in pipes. Depending on the application, data for raw material inputs, finished product outputs, and waste produced from business processes might also be gathered.
An inventory of processes and equipment that consume energy or use water and other natural resources is also created as part of the preparatory work. Energy and usage ratings for each item in the inventory are gathered, operating schedules are documented, and maintenance condition is captured. If this kind of information is unavailable, actual measurements might be necessary to characterize the energy consumed by different equipment in the inventory.
Organizational roles, policies, and governance that affect energy and natural resource usage are also investigated. Ownership of usage performance and responsibility for continuous-improvement projects are documented, clarity of equipment operating schedules is evaluated, and policies that govern conformance to those schedules are gathered. Security and safety policies might also be evaluated for dependencies with energy consumption, such as requirements for lighting in dark areas or after the normal workday ends. Governance and processes that control schedule deviations for equipment usage, and ensure that operations return to normal when the need for a deviation has ended, are also evaluated. Sometimes organizations can make relatively simple and inexpensive changes in these areas, without significant capital expenditure for new equipment, to yield significant short-term savings and a positive environmental impact.
If facilities are leased, the division of responsibility among all stakeholders needs to be clearly understood because the tenant might not have full authority to make improvements without consent from the owner. Ultimately, some improvement initiatives could include cooperation, input, resources, and even investment from multiple stakeholders, yet others might not be initially feasible because of contractual constraints. For example, one owner might be very interested in replacing old, inefficient heating, ventilating, and air-conditioning systems in a building, but another might not.
The organization can use the data and operational information from the preparatory work to create a voice of the environment (VOE) value-stream map (VSM), described in Section 5.5.1 and illustrated later by Figure 6.4 in the case study in Chapter 6, “Applying Green Sigma to Optimize Carbon Emissions.” The VOE VSM is one tool that an organization can use to identify opportunities and define improvement initiatives. When the preparatory work is complete, the company has sufficient information on the use of energy and other natural resources to begin the first step of the Green Sigma methodology. The five steps of the methodology are each described next.
5.2. Step 1 Defines Key Performance Indicators
Establishing key performance indicators (KPIs) is an essential part of most business transformation initiatives. A business’s capability to effectively manage and improve its processes for environmental stewardship often directly correlates to its capability to measure and analyze performance using tools such as trend analysis, root-cause analysis, and variation analysis. An organization should establish appropriate KPIs for three critical purposes.
First, KPIs are important for measuring the success of transformation initiatives and demonstrating that predicted benefits are actually realized. This is especially important for environmental-impact improvements because the concept of carbon credits is developing and maturing, along with emissions-trading scenarios, to mitigate global warming and associated climate change. An enterprise’s capability to demonstrate future improvements in its carbon footprint could contribute to meeting financial, regulatory, and environmental goals and commitments. One survey by the Gartner Group[14] showed that the inability to determine benefits and the lack of a repeatable benefits-realization approach were companies’ top two obstacles to justifying their investments. The same survey showed that companies can effectively use business process metrics as change agents to help secure the success of transformation initiatives.
Second, KPIs are important in monitoring process performance, assessing ongoing operations, and identifying new improvement opportunities. Without the appropriate measures for emissions and waste production in place, many companies have difficulty establishing their baseline performance. This makes it very difficult to set realistic improvement targets, and nearly impossible to know whether predicted benefits are ever achieved.
Third, KPIs are important for demonstrating adherence to standards or limits, such as regulatory standards, and managing breaches outside permissible limits. Automated triggers and alarm management is one growth area that is increasing operational efficiency across a broad range of applications in all industries, from oil refineries to pulp- and paper-manufacturing plants. These kinds of advancements, which require clearly defined performance measures, are helping companies reduce their risk of operating outside permissible limits.
With the trading market for carbon reaching $118 billion in 2008[15], after growing to $60 billion in 2007 (twice the market size of 2006)[16], it’s clear that organizations must master the capability to establish relevant KPIs that correlate traditional operations performance with improved environmental stewardship. In addition to carbon management, areas that are growing in importance, with different KPIs, include the monitoring and management of water, other atmospheric emissions, liquid waste, solid waste, ground emissions, noise levels, air quality, and virtually any other raw material or natural resource.
Some companies have had KPI measurements in place for years. Examples include measurements related to recycled materials, water consumption, electricity consumption, fuel consumption, and raw-materials waste. However, most performance measures have traditionally been established at a relatively high level or are very specific in nature and intended to target a narrow area of waste. Enterprises are only now beginning to holistically characterize their operations based on environmental impact.
In the past, many companies measured and tracked gross energy use or even electric-bill charges, especially those with high energy-consuming manufacturing facilities. In the future, more appropriate measurements could be based on real-time fluid temperatures, along with algorithms that automatically correlate different elements of a manufacturing process with waste. For example, chilled water and steam systems for air cooling and heating often measure and report temperature and flow rate at building entry and exit points, but they don’t as often report data at points inside a building for insight into the highest consumption and waste areas. In this scenario, leaders can apply improved visibility and business logic to potentially identify problems and make adjustments even before unnecessary waste is produced.
The amount of recycled material, such as paper, metals, plastics, liquids, and gases, represents another area that many companies have been measuring. However, measuring these wastes more holistically can lead to improved performance. For example, measuring the amount of material consumed as value-added input to a manufacturing process, along with measuring the amount recycled, provides insightful information on the amount of waste that remains to be captured.
Other KPIs that draw a more holistic picture of waste production are being measured to support environmental stewardship and set business performance-improvement targets. In some businesses, the time to clean contaminated soil, the number of toxic spills on a global basis, or the number of injuries (both human and animal) from an accident or adverse event can all be part of a holistic picture.
To characterize an enterprise with respect to its environmental impact, one emerging and increasingly foundational practice is to correlate KPIs with their carbon-footprint impact. In many cases, organizations can correlate a positive environmental impact to a reduced carbon footprint. For example, automobile and factory emissions, forest products consumed and not renewed, and electricity use can all be correlated with a carbon footprint.
However, the realities of an imperfect world cannot be ignored. Global standards are not yet established for carbon footprint KPIs, although they are developing. The Carbon Trust offers one framework[17] in which KPIs can be grouped into six emission-type categories:
• Direct (such as on-site combustion of fuels)
• Indirect (such as off-site combustion of fuels for use on-site)
• Process (such as on-site emissions caused by processes)
• Energy export (such as on-site combustion of fuels for off-site use in electricity generation)
• Upstream (such as emissions caused by suppliers)
• Downstream (such as emissions caused by products during their lifecycle)
The Greenhouse Gas (GHG) Protocol[18] has developed another framework in which KPIs are grouped into three scopes. The first scope includes emissions that are directly produced from operating buildings, equipment, and vehicles. The second scope includes indirect emissions from purchased electricity, steam, or heat. The third scope includes indirect emissions from outsourced activities and business travel. The Green Sigma methodology establishes a set of measures and then maps them to these three scopes. Other efforts for standardization, beyond carbon emissions, are also developing. For example, the International Organization for Standardization (ISO) has developed requirements and guidance for use of ISO 14001:2004 that address environmental-management systems.[19] Companies such as Emerald Group Publishing[20] are getting certified for this standard to improve and demonstrate their competence in, and commitment to, environmental stewardship.
The initial challenge for most organizations is establishing the boundary conditions used for carbon-footprint reporting. When the boundary conditions are set, organizations can determine the appropriate KPIs and establish the measurement system. Although this chapter emphasizes carbon-footprint KPIs, it’s easy to see how organizations can define KPIs for virtually any area that has an impact on the environment.
5.3. Step 2 Establishes a Measurement System
An organization must overcome unique challenges when establishing a measurement system that supports environmental stewardship. One challenge is that the processes for metering and monitoring KPIs are at various levels of maturity. For example, even the standards for carbon measurement and reporting are still in the early stages of development.
For most industries, especially the pharmaceutical, chemical, and other manufacturing-intensive industries, much of the metering and monitoring today is associated with air and ground emissions, such as waste water, organic and inorganic waste, and hazardous waste. These measures have been tightly controlled due to regulatory and legislative requirements across most geographic regions. Yet monitoring to meet regulatory compliance doesn’t necessarily meet the monitoring needs for other purposes, such as waste reduction.
To illustrate this point, consider an industrial-manufacturing operation in which hazardous waste is measured for regulatory compliance purposes by counting the number of barrels or measuring the net liquid volume as an output of the facility. Using this measurement as an indicator of waste production provides little information on where, when, and how the waste is created. To improve the processes that generate hazardous waste, more detailed information is often needed about where in the process the waste comes from, what machinery is used and how it’s maintained, chemical reactions involved, operating schedules, and other process-specific parameters. Inevitably, some measurements will be easier to take than others, technical challenges must be overcome, and legacy measurement infrastructure must be considered.
For some businesses, the most substantial challenge to metering deployment in their legacy environments relates to networking and communications. This challenge often involves solving the problem of how to effectively create networks for the existing metered infrastructure, especially when dispersed site locations are involved. Where meters are already deployed, processes are sometimes in place to take relatively infrequent, manual measurements that aren’t very helpful in analyzing and reducing waste, and identifying problems early. In the example of metering to accurately capture water pollution, the dispersion can be spread along many miles of a river.
Although using wires for the installed metering network is perhaps the most reliable approach, it’s also a costly and time-consuming solution. Using wireless technology is an alternative to consider for such challenges. Although standards have been developed for GSM/GPRS (Global System for Mobile Communications/General Packet Radio Service), Bluetooth, Zigbee, Wi-Fi, and WLAN (wireless local area network, IEEE 802.11 standard) technologies, not all are suitable for the challenges associated with difficult industrial environments, such as manufacturing facilities.
Solutions to the wireless challenge already exist in the marketplace, and the Green Sigma methodology offers a wireless metering solution that enables interface capability with most of the meters in the marketplace today. Other solutions have also been developed. “Smart wireless” from Emerson Process Management is one example that uses a self-organizing, smart-mesh network to reliably overcome harsh electric and magnetic field conditions.[21]
The steps in establishing a measurement system that supports environmental stewardship are similar to other metering solutions, in which multiple devices must be deployed and data must be relayed to a central data warehouse or to any number of synchronized databases. A spectrum of technology is available for metering that ranges from manual observation to fully wireless remote sensing, which can all fit into a straightforward conceptual technology architecture that companies can build. Existing legacy metering can also have a place in this architecture. Figure 5.3 illustrates such a conceptual architecture for a measurement system in which organizations can report information manually and initially capture it on spreadsheets, or fully automate it with wireless sensors.

Figure 5.3 Conceptual technology architecture for the measurement system
In building such a measurement system, or extending the purpose of an existing one, an organization must consider a number of variables. First, the data sources themselves must meet certain levels of reliability, durability, accuracy, and maintainability. The data must adhere to standards that enable it to be aggregated and analyzed. Unreliable or nonstandard data will ultimately not be very useful; similarly, a network of sensing devices that is constantly under repair will not be beneficial. Fortunately, for the purpose of energy-use reporting, water use and consumption, and many other areas of environmental impact, sensing devices that have proven accurate and reliable are frequently available. An organization must consider the time interval for taking measurements (continuous, hourly, daily, and so on) in an automated sensing system.
Connectivity from the data sources, sensors, and meters to a database must be efficient and reliable. The same is true for interfaces between the data itself and software applications that analyze and report information. For example, if the method used includes manual observation of water use from a meter installed on a pipe and uses disparate spreadsheets to capture the data, appropriate governance also must be in place to ensure that the data is updated often enough that it’s current and relevant when analyzed. The data should be collected into a central database or should be synchronized across databases so that an organization can easily aggregate and analyze it without errors.
The analytics and business logic should consider the business objectives of environmental stewardship and waste reduction. Business logic should have the capability to identify when parameters exceed certain limits so that alarms can be triggered and messages routed to someone who can initiate corrective action. Automated response might even be possible. For example, if building equipment continues to operate during evening hours when it should be shut off according to a standard schedule, alarm-management or automated-response functionality can be an effective way of correcting the situation before energy is wasted throughout the night. The management reporting and information visibility should be easily understood and interpreted, and should provide insight into problem areas and improvement opportunities. Figure 5.4 shows the management dashboard system, which is one solution that can provide such visibility and insight.

Figure 5.4 Active management dashboard system
Source: IBM Journal of Research and Development
Leading practices for establishing effective measurement systems are also important to evaluate and can considerably reduce the ongoing operational cost if incorporated early on. Connectivity and interfaces in which data is communicated from one place to another should be automated as much as possible, especially when data is exchanged between different systems or altered. As with any other business process, such as order management, less manual intervention and rekeying of data reduces the opportunity to introduce errors and increases the reliability and efficiency of the whole system. An organization should evaluate trade-offs between cost and real-time data visibility so that information is accurate and timely, but not at the expense of being too costly.
Drill-down capability should be possible so that an organization can perform analysis using data at an aggregated high level or using the lower-level source data, and at multiple levels between those two extremes. The measurement system should integrate with appropriate business logic and analytics, enable triggers to be set, and manage alarms based on the triggers and prescribed corrective action. Analytics and reporting should also be able to incorporate benchmarks, compare trends to baseline performance, and indicate progress toward improvement targets.
5.3.1. Direct Measurement of Carbon Emissions
Direct metering has traditionally been limited to site or building entry-level metering for many industries. Utility companies often use direct metering for billing purposes installed during building construction, and then rarely make changes after construction is complete. As a result, existing KPIs in this area of direct measurement have typically not changed for many years. Natural gas and electricity companies typically include kilowatt-hours (kWh) monitored on a daily and cumulative usage basis, which can be converted to tons of carbon dioxide equivalent (tCO2e) using established conversion criteria. The Carbon Trust[22] and a number of other sources discuss conversion criteria. Energy from more sustainable sources has correspondingly lower conversion factors.
Without measurement detail, many organizations lack a holistic understanding of their energy use and resultant carbon footprint. Four key reasons explain why this widespread lack of understanding has persisted. First, relatively inexpensive energy has been historically available without other drivers for improvement; therefore, most companies have not considered energy as a key cost driver. Projects that focused on energy conservation with long time horizons to achieve an attractive return on investment (ROI) were not viable, so companies didn’t continue to invest in this area.
A second reason involves a lack of metering infrastructure. During the past 20 years, organizations have made little investment in energy-management infrastructure during the design and build phases of construction, except when energy consumption is especially high. As a result, most organizations with legacy infrastructure are now challenged with establishing an accurate position for energy management.
Third, legislative and regulatory drivers have been lacking, although improvements are being made. Section 1.3.3.3 in Chapter 1 described attempts to regulate carbon emissions, but no real external regulatory pressure is forcing organizations to optimize their carbon footprints. The emergence of the U.K. Climate Change Act might change this situation in the future. This legislation aims to drive changes in the U.K., but other countries will likely adopt and enforce similar legislation in the future.
Fourth, the accountability for energy use hasn’t been well defined traditionally. Within most organizations, responsibility for energy management is often unclear or widely dispersed among many people, and often no single entity is incited, required, or empowered to make improvements.
Either implicitly or explicitly, many businesses have treated their planned “sustaining” and “transformation” roadmaps differently. The budget to support a transformation roadmap is often allocated and aligned to enable strategic imperatives with clear accountability for meeting key objectives as investments are made. However, the budget to support a sustaining roadmap is also needed for necessary maintenance and upkeep to “keep the lights on” for property, facilities, plants, equipment, and information-technology systems without any real connection to a strategic business imperative. With the strength of the green movement, businesses are now capturing opportunities to consider investments in their sustaining and transformation roadmaps in a more integrated way. Businesses can coordinate accountability for improvements and alignment with green strategic imperatives with necessary maintenance and “pay-the-bills” responsibility, to further improve environmental stewardship. Investment in measurement systems is one such area of opportunity.
Some industries have a significant opportunity to advance their state-of-the-art measurement systems in new ways. For example, companies in the transportation and logistics industry have the capability to collect direct mileage–metering data from their fleets using on-board truck and aircraft telemetry, and satellite-tracking technology.
Given the current legacy-metering infrastructure deficit that exists across most business sectors, the challenge now is for organizations to begin measuring, managing, and optimizing their energy use and to conserve other natural resources. To implement this quickly, companies need to design and implement nondisruptive metering solutions that they can integrate with the existing infrastructure.
5.3.1.1. Direct Measurement of Electrical Power
By deploying smarter metering technology, power utility companies around the world are helping raise awareness of electricity usage at the billing-meter level. However, a large gap remains between such top-level measurements and the need to understand the usage profiles for equipment that consumes significant energy inside facilities.
A few companies provide several well-established power-management solutions, such as monitoring and management capability for electrical power. Some example companies include Mitsubishi, Siemens, Ely, Schneider Electric, Omron, and Elutions. However, the challenges of deploying even these established solutions within a legacy environment can be quite substantial.
Particular problems arise in the deployment of power metering in a high-voltage (HV) or medium-voltage (MV) environment. To deploy a more granular level of sensing within MV distribution-board switch panels, planned power outages are invariably required for health and safety reasons. Arranging suitable times to carry out this work can be a lengthy process that is difficult to coordinate. To overcome this, companies are developing several innovative and minimally disruptive metering solutions at the MV level that reduce such delays in implementing new metering technology.
For companies and organizations whose operations require high availability both day and night, such as hospitals and manufacturing plants with multishift work schedules, arranging suitable change windows can be especially challenging. In one particular deployment at an industrial company in Europe, establishing power metering over a four-building site took nearly nine months, with only one outage per building allowed in each quarter.
Companies are more frequently changing their electrical energy mix supplied on-site or from utility companies by paying for electrical power generated from renewable energy sources. This is leading to a higher level of awareness and sophistication in carbon management. Not only is the price different for electrical power from renewable energy sources compared to traditional ones, but the conversion factors are also different in translating electricity consumption to equivalent carbon emissions. For example, the typical electricity power-conversion factor for carbon dioxide/kWh is 500–600g/kWh[23], but with the use of renewable energy or nuclear power averaged-in, this figure can fall to 400g/kWh or less. For electricity generated on-site with renewable energy sources, the conversion factor can drop to zero.[24] Some aspirations, such as the FIJI Water company, are actually aiming to achieve negative carbon-footprint commitments.[25] Chalet 1802, a family-run online skiing company based in the French Alps, has achieved a negative carbon footprint, partly from “purchasing all its electricity from renewable sources.”[26] This practice can contribute to a company’s objective of reducing the level of carbon dioxide it generates, even though universal standards for conversion-factor calculations are still being discussed. Perhaps when all the electricity is someday generated from renewable and sustainable sources, electrical power won’t contribute to greenhouse gas emissions.
5.3.1.2. Direct Measurement of Natural Gas
Measurement of natural gas for most organizations involves building-level metering for utility-billing purposes. However, given the mechanical and often unsophisticated nature of these meters, most companies don’t have automated-reporting capability. The exception is facilities with high gas usage, where automated uploads to the utility company through a General Packet Radio Service (GPRS) network link are often in place.
Except for the most basic gas meters, most offer some kind of output capability in the form of electrical pulses proportional to the actual gas flow. Organizations can convert and upload these pulses, often to a building management system (BMS). Buildings that consume natural gas, including offices, warehouses, stores, and manufacturing facilities, frequently use such meters.
Unlike electricity, which feeds a variety of machines, the gas supply is often a dedicated feed into a gas-boiler arrangement. As a result, building-level metering can be sufficient and the need to deploy additional submetering is low. However, several unique challenges exist for metering deployment with natural gas.
If the existing meters don’t have information-uploading capability, a planned system outage might be required to deploy an appropriate inline gas-flow meter. However, several unobtrusive clamp-on ultrasonic gas-flow meters are available in the marketplace if no existing measurement system is available.
Because gas boilers are primarily used to generate hot water, another solution deploys unobtrusive secondary heat meters within high- or low-pressure hot-water systems. This deployment approach applies to situations in which an organization can use the heat energy measured within the hot water loops to determine the amount of gas consumed during the measurement period. This scenario eliminates the need for disruptive inline-meter deployment, and more rapid implementation and data reporting is possible.
5.3.2. Indirect Measurement of Carbon Emissions
Even less understood than direct measurement—and, therefore, potentially more challenging—is the capability to capture the relevant data for indirect measurement of carbon emissions. A few typical areas that require measurement to establish an organization’s footprint include business travel, employee commuting, and inbound and outbound logistics associated with shipments of materials.
5.3.2.1. Indirect Measurement of Business Travel
For business travel, business leaders can obtain relevant KPI data from mining existing databases that already exist in most organizations. Information gained might include in-house business-expense claims data or travel requests. One relevant KPI is the combined tons of carbon dioxide equivalent (tCO2e) emitted for the various modes of employee transport. Categorizing business travel by mode of transport and converting to tCO2e based on known conversion factors can help an organization determine its carbon-footprint contribution. An illustration of this approach is provided later in Chapter 6, Section 6.2, with the case study.
5.3.2.2. Indirect Measurement of Employee Commuting
As in the approach for business travel, an organization can establish KPIs for emissions from employee commuting, and tons of carbon dioxide emissions saved by remote working in lieu of commuting, by querying telephony call-management systems and remote dial-in connection–reporting systems. Increased numbers of remote workers translate to lower emissions because of a decrease in employee commuting. An illustration of this approach is provided later in Chapter 6, Section 6.2, with the case study.
5.3.2.3. Indirect Measurement of Business Logistics
Organizations also need to measure and quantify carbon emissions associated with inbound and outbound logistics operations to establish a total carbon footprint. When attempting to assess the carbon-emissions equivalent from individual inbound and outbound shipments, each tracked through multiple carriers and multiple modes of transport, organizations realize the scale and complexity of the task. Dynamic reporting on a weekly, biweekly, or monthly basis increases the workload and adds complexity in the absence of automated technology tools. The KPIs established for tracking and reporting carbon emissions from logistics include equivalent tons of carbon per shipped ton (tCO2e per shipped ton).
Solutions are available that enable organizations to model their carbon emissions produced by business logistics. For both inbound and outbound logistics, these solutions help a company understand its carbon footprint in a cost-effective way. In the future, modeling tools will enable organizations to test routing scenarios for carbon optimization. It will also be possible to adjust input variables (such as delivery times, shipment consolidation, and modes of transport) to estimate the smallest possible carbon footprint while still meeting customer requirements. The difference between optimal routes and actual routes represents an opportunity to reduce carbon emissions.
Tracking the ongoing difference between optimized routing and actual routing would be the ideal dashboard-level KPI to assess an organization’s progress toward minimizing its carbon footprint from logistics operations. In the future, measurement of carbon emissions from logistics could be possible by using the technology of onboard telemetry with satellite tracking of delivery vehicles.
5.3.3. Direct and Indirect Measurement of Water and Other Natural Resources
Using many of the same techniques for measuring carbon, organizations can measure the use of water, air, metals, plastics, chemicals and gases, paper, and other natural resources at different points in a business process. In some cases, organizations can correlate known data with resource consumption indirectly; other times, direct measurements are necessary. For example, in an automobile-washing business, water use might easily be correlated with the number and type of vehicles serviced. Continuous, real-time measurement is often practical for liquid and gas usage or where continuous-flow processes are involved, such as with coal traveling along a conveyor belt. Discrete or batch-flow processes might measure weight or volume of materials at important points in the process. Although correlations to carbon emissions are established for energy, organizations can connect measurements of other natural resources to other environmental influences. For example, organizations can correlate water use to volume and availability, quality and pollution level, sanitation and health, and so forth.
An emerging leading practice in environmental stewardship is to deploy a portal-based management dashboard system that displays KPIs, metering data, and other critical information for making optimal business decisions.
5.4. Step 3 Deploys a Management Dashboard System
Displaying current KPI data on a single dashboard not only facilitates business reporting and accounting requirements: The dashboard can also serve as an active carbon-management and waste-monitoring tool. Organizations can use such a tool to monitor daily operations, optimization, and compliance with regulatory obligations.
Organizations make significant efforts to generate data to support the sustainability-performance section of many annual business reports. Such data-gathering efforts are often manual or static in nature and require significant costs to keep the data current.
Although many of the existing tools and carbon-footprint calculators are used to report some of the required footprint data, most aren’t sufficiently accurate or adequate for revealing a full carbon position in three key areas. The first area involves defining clear boundary conditions for reporting. Second, the reported data is generally static and not comprehensive, primarily because of the significant effort involved in gathering such data. Finally, a high complexity and cost is associated with collecting even the baseline data, especially for the carbon position of inbound and outbound logistics.
As one of its core components, Green Sigma uses a portal-based dashboard to actively manage an environmental stewardship position. An organization can configure the dashboard to report on measures in any area of the business, including carbon, water, atmospheric emissions, liquid waste, solid waste, ground emissions, noise levels, and air quality. Figure 5.4 shows a sample dashboard. Note the flexible-reporting approach, which includes dials, graphs, and other chart formats that can display information from a variety of data sources, ranging from basic manual entry to real-time automated feeds. The figure also illustrates sample reports for several operational performance indicators that are related to areas such as electricity usage, gas usage (for three different buildings), logistics (inbound and outbound), and business mileage. It also illustrates weather-monitoring capability, alert-status reporting with current state and threshold limits, and summary-level carbon dioxide run-rates for normal, near-limit, and over-limit operating zones. Drop-down option menus enable a user to view these reports for different facilities, geographies, time horizons, formats, and units of measure.
Although it’s sensible to focus on automating data feeds into such a dashboard, a well-designed system also offers the flexibility of manual data entry. This manual feed, with disparate spreadsheets and database report queries providing the data, is a possible short-term solution for many organizations. For carbon monitoring, companies should not overlook having manual-entry capability with the dashboard; it enables companies new to the carbon management space to quickly ascertain their carbon position without needing to immediately overcome all the measurement and networking challenges.
Green Sigma initially uses this portal-based tool as a solution for establishing an organization’s baseline carbon footprint. That information is then applied to optimize carbon emissions. As organizations develop an understanding of their carbon position, the tool develops into more of a strategic-management system and provides active control capability.
Organizations achieve active carbon management by statistically modeling the business environment and linking the associated KPIs to actual process activities that contribute to different carbon sources. This approach is especially useful when KPI measurements come from gas, electricity, and water use because organizations can potentially take those measurements continuously and in real time. Having this level of visibility into process activities and corresponding resource consumption enables a company to actively manage and optimize its environmental impact through real-time alerts, alarm management, and automated responses.
Beyond the dashboard solution, enterprisewide environmental-management consoles can deliver complete enterprise-level reporting. Although it’s useful for any company, enterprises with high carbon emissions, such as electrical power–generating utilities, might use this level of reporting. Organizations of this kind require greenhouse gas emissions to be measured at the chimney stack exit level, and the data must be aggregated and reported for the corporation to meet compliance requirements. At such an enterprise level, more real-time reporting capability can be used as a platform for revenue generating opportunities in the developing carbon credit–trading markets.
5.5. Step 4 Improves and Optimizes Processes
Green Sigma applies modified traditional manufacturing-type statistical- and waste-reduction techniques from Lean and Six Sigma, focused on environmental impact areas and more typical ones. The traditional “voice of the customer” (VOC) process that captures customer requirements is replaced by the “voice of the environment” (VOE). VOE addresses sustainability factors and the impact of processes on the environment.
By adapting the traditional VOC process to now identify VOE requirements, environmental impact areas are made more visible in analyses where they might have been ignored in the past. Some of the requirements from VOE might contradict those from VOC, to achieve a balance between the customer requirements and environmental requirements. As an illustration from the automotive industry, one VOC requirement might be rapid acceleration, but analogous VOE requirements might be fuel efficiency and engine noise level. In another illustration, a customer requirement for more powerful vehicle air-conditioning can be contrasted with environmental requirements for fuel efficiency and end-of-life refrigerant disposal.
By establishing KPIs and using the standard Lean methodology for data diagnostics, a company can identify, qualify, and capture target opportunities for process-focus areas. After the company fully develops the management dashboard system, analyzes the processes, and completes the necessary transformation actions with a continuous-improvement methodology, the final step is to standardize and replicate opportunities and process improvements across the enterprise. This further leverages the benefits of a Green Sigma or similar investment.
Two statistically based analysis techniques have been adapted for Green Sigma. The first is voice of the environment (VOE) value-stream mapping (VSM). The second is voice of the environment characterization and optimization through the application of statistical process control (SPC) and use of targeted design of experiments (DOE).
5.5.1. Voice of the Environment (VOE) Value Stream Mapping (VSM)
Starting with the traditional value stream mapping concept as a basis for identifying waste and implementing leaner process designs, it’s possible to adapt the technique to improve environmental effects. This approach effectively defines the VOE factors for optimization within a targeted focus area.
Organizations can add information to the value-stream map for carbon emissions, managed water use, raw-materials consumption, and other environmental wastes. This not only improves the end-to-end view of a process, but it also enables companies to analyze high environmental-impact areas and identify opportunities for continuous improvement. Through various statistical techniques, organizations can optimize energy performance and waste production to simultaneously yield carbon-emission and waste reductions, cost reductions, and process improvements. For example, wasted natural gas energy and excessive carbon emissions from heating a building might introduce VOE factors, such as burning nonrenewable energy resources and the resulting carbon emissions.
In another example, the levels of waste from producing a jar of coffee might introduce VOE factors such as excessive water use, carbon emissions from manufacturing and transportation in the supply chain, and amounts of different wastes in landfills and hazardous waste dumps associated with the manufacturing process and discarded packaging.
VOE factors for selling a new refrigerator might include carbon emissions from transportation, ongoing in-use energy consumption measured by the energy rating of the product as a design feature, the excessive landfill requirement for packaging waste, and the eventual disposal needs for hazardous refrigerant.
5.5.2. Statistical Process Control (SPC) and Design of Experiments (DOE)
Applying standard SPC techniques using VOE KPIs is an effective method for optimizing and improving processes for environmental stewardship. The SPC technique establishes upper and lower control limits for parameters such as temperature or fuel consumption so that normal operation remains between these two limits. When normal operation is at risk of being outside these limits, organizations can take corrective action to prevent problems before they occur. Typical statistical tools include process-control charts, histograms, regression analysis, and DOE to model the chosen environment and select appropriate limits. Green Sigma can modify the traditional design for manufacture (DFM) and Design for Six Sigma (DFSS) principles and apply them to target design for the environment (DFE).
Organizations can realize substantial benefits by using these tools. As the case study in the next chapter demonstrates, applying these techniques can yield an energy savings of approximately 20 percent even before full-process optimization is complete.
5.6. Step 5 Controls Ongoing Performance
Institutionalizing behavioral changes in an organization and establishing effective continuous-improvement practices are essential elements in the overall effort to improve environmental impact on an ongoing basis. For most organizations, establishing performance measures, installing a measurement system, and providing effective reporting is just the beginning of the transformation journey.
The management dashboard system can report carbon emissions, environmental waste, water-management parameters, raw-materials consumption, and other areas critical to environmental impact. With such a sophisticated measurement and reporting system in place, organizations have the tools to better manage and improve performance on a sustained basis. Although this chapter is not intended to fully describe Lean and Six Sigma tools and techniques that support ongoing control and continuous improvement, you can read more about the key elements of waste elimination and process variability reduction in Step 5 of the case study in the next chapter (see Section 6.5).