
6. Applying Green Sigma to Optimize Carbon Emissions
The Green Sigma approach has already demonstrated and quantified significant energy savings and corresponding greenhouse gas emission reductions. Organizations have also achieved improvements in water management and other key areas of environmental stewardship. This case study describes how an organization used the five-step Green Sigma methodology to improve carbon emissions by managing gas usage for environmental control inside a 200,000-square-foot electronics manufacturing and assembly facility in Europe. The case focuses on the warehouse portion of the facility, although actual data is also provided from the broader site to illustrate carbon measurement for business travel and employee commuting.
Readers can apply the findings and observations discussed in this chapter to virtually any reasonably large operation with a complex network of processes and equipment that consume energy or natural resources. This includes warehouses, manufacturing facilities, office buildings, retail sites, hotels and conference centers, theme parks, entertainment locations, and casinos.
6.1. Step 1 Defines Key Performance Indicators
The initial focus for a VOE (voice of the environment) key performance indicator (KPI) was daily cumulative kilograms of equivalent carbon dioxide emissions from warehouse operations. This was a straightforward calculation because it directly correlated to the measured kilowatt-hours (kWh) of gas use inside the building. However, analysis showed that this KPI was not sensitive enough to environmental factors, such as temperature, to provide a timely response to alarm triggers and for adequate investigation into out-of-control situations. One reason was the large scale and complex interactive nature of the energy-consuming equipment inside the building. An analysis yielded more than 100 pieces of energy-consuming equipment in the building.
Ultimately, analysts determined that an hourly reporting of peak gas flow in cubic meters per hour gave the optimum measurement to enable proactive business-process control. The analysts then correlated this flow rate to equipment operating schedules instead of environmental temperature, which fluctuated widely and was not a reliable predictor of alarm-triggering situations.
Analysts also identified and reported indirect measures for business travel and employee commuting associated with the broader site of multiple buildings. These were more straightforward to establish because they leveraged information in existing databases. For example, business-travel measures included air miles, company car miles, and car hire (taxi) miles. Employee commuting measures included data such as remote login information.
6.2. Step 2 Establishes a Measurement System
The onsite building management system (BMS) provided automated data feeds for gas use in the warehouse using the existing metering solutions described earlier.
Other measurements were done manually. The BMS was capable of controlling energy-consuming equipment with automated scheduling. However, when deviations to standard schedules were required, the system could not automatically return to normal at a prescribed point in time. Analysts tracked these deviations on paper and spreadsheets. For example, if the business required a temporary change in the BMS to accommodate a second shift of warehouse personnel for two days, the standard schedule would need to be manually changed in the system on the first day. Another manual system change was required later in the week to reestablish normal operating conditions.
Although not part of the initial focus on warehouse operations, analysts also measured and reported carbon emissions for the broader site from business travel and employee commuting. The following data and analyses are provided to illustrate a few possible findings.
6.2.1. Measurement System for Business Travel
Figure 6.1 provides one sample of actual data from the IBM facility in Europe. Analysts estimated air miles, company car miles, hired car (taxi) miles, and other travel miles from existing information, such as when employees report the necessary data for expense-reimbursement purposes. With the travel miles known, analysts used established conversion factors to calculate the equivalent carbon emissions. Such analyses are useful not only to better understand a company’s carbon footprint, but also to identify high carbon-producing business activity that a company can target for improvement. In this illustration, air travel is one area in which a relatively small percentage improvement could have a significant positive impact, compared to the other transportation modes.
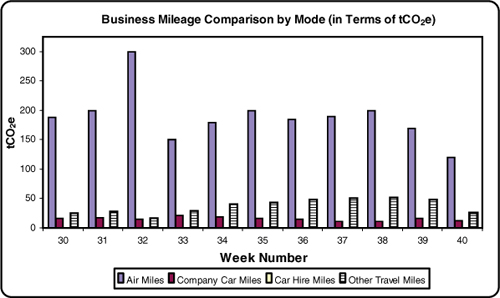
Figure 6.1 Indirect measurement of business travel
6.2.2. Measurement System for Employee Commuting
Figure 6.2 summarizes remote-login data from the same IBM facility in Europe. Analysts can also review videoconferencing and teleconferencing data. Analyses such as these are immediately useful in spotting trends and, with appropriate root-cause analysis, identifying opportunities to continue favorable trends and reverse unfavorable ones. Although the data is from actual operations, the following root-cause assessment is hypothetical, to highlight key benefits of the analysis.
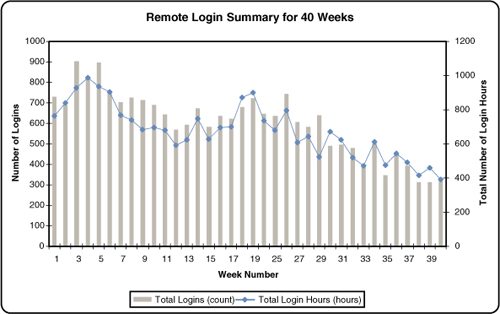
Figure 6.2 Indirect measurement of employee commuting
Figure 6.2 suggests an unfavorable trend for environmental sustainability, in which fewer logins and a lower number of login hours are occurring over time. The simplest explanation could be that employees are commuting to the office more often, resulting in higher greenhouse gas emissions from commuting. After being validated, such a finding can lead to expanded training and new governance for telecommuting policies and procedures.
However, without the appropriate root-cause analysis and validation, data-driven hypotheses can be misleading. For example, if the number of logins in Figure 6.2 is decreasing because the company is improving the reliability of remote network access and users are experiencing fewer disconnects, the environmental impact would be essentially neutral. The company might also be enforcing auto-logoff software settings more rigorously during this time period by automatically logging off employees when they leave a computer unattended (such as overnight), thereby reducing the total number of login hours. In cases such as this, the conclusions are actually counterintuitive. Because network reliability is increasing, workforce efficiency will be higher even though the number of logins is decreasing. And because the total number of login hours is decreasing for hours that are not productive work hours, the environmental impact is favorable—since less computer power is used. A sensible next step in this scenario could be to train or communicate to employees that they should turn off their remote-office computers during nonworking hours, in addition to disconnecting from the network.
Without analyses such as these, the insights for environmental impact are difficult to hypothesize. More important, without visibility to data such as this, fully developing and testing hypotheses that lead to improvement ideas is even more difficult.
6.3. Step 3 Deploys the Management Dashboard System
The company automatically uploaded real-time reporting of cumulative gas-usage data to the management dashboard system shown in the last chapter in Figure 5.4. Analysts created an hourly control chart based on hourly gas flow in cubic meters per hour, similar to the one shown in Figure 6.5. Section 6.4.1 discusses this figure in greater detail.
6.4. Step 4 Improves and Optimizes Processes
With a data-gathering system in place and information automatically presented through the dashboard, the company could analyze and study hourly gas usage.
Analysis revealed a large number of factors that contributed to total gas use and its hourly variation. Using the building heating system equipment inventory, which included nearly 100 assets, analysts created a Sankey diagram to understand the significant energy users (SEUs) within the building. SEUs are pieces of equipment that consume a relatively large amount of energy. Sankey diagrams are drawn so that the width of the arrows is proportional to a particular KPI measurement, such as flow rate or energy use. To illustrate the level of complexity involved in this case, the system inventory included 3 domestic hot-water cylinders, 2 gas boilers, 7 air-handling units (AHUs), 40 small fan coil units (FCUs), and more than 40 space-heating radiators.
Figure 6.3 shows a Sankey diagram that’s based on proportional estimates of gas consumption, using data from hot water flow rates for nearly 100 energy-consuming components. The diagram clearly identifies the SEUs because the width of each arrow is roughly proportional to the energy used by each component or group of components. Therefore, the SEUs are represented by the widest arrows. In analyzing the diagram, it is apparent that AHUs 4, 5, 6, and 7 consume 80 percent of the gas.

Figure 6.3 Gas-usage Sankey diagram
Source: IBM Journal of Research and Development
The next step involved developing an appropriate voice of the environment (VOE) value stream map (VSM) for the building to identify sources of waste and opportunity areas for improvement. For the heating-management process, carbon emissions related to lost heat generated from burning gas were the sources of waste, as shown in Figure 6.4. As in any building, some heat was lost through the building fabric, which includes the walls and ceiling; this is represented as a separate heat-loss arrow on the right side of the figure.

Figure 6.4 Voice of the environment (VOE) value stream map (VSM)
Source: IBM Journal of Research and Development
The VOE VSM in Figure 6.4 identified several waste-reduction opportunities for follow-up work, in addition to the largest ones that are indicated in the lower-right corner. In one example, the operating temperature and range of operation had been set arbitrarily without consideration for optimization. The follow-up approach utilized Lean “Kaizen” activities, or rapid-improvement projects. Kaizen activities are extremely effective in identifying and implementing improvements with rapid payoff, using a variety of Lean tools and templates. These improvement projects are tracked for both status and results, and are linked to the larger overall-improvement effort. This approach is consistent with Lean and Six Sigma principles that facilitate ongoing, iterative improvements by exploring and expanding waste-reduction opportunities over an extended period of time.
Ultimately, the company identified two key opportunity areas from the VOE VSM: utilizing AHU-schedule control to minimize out-of-control situations, and adopting AHU scheduling and environmental-control best practices for better alignment with the actual production schedule.
6.4.1. Control of AHU Scheduling
Managers usually set up and manage the AHU schedules from the building management system (BMS), based on environmental-control needs inside a building. Normally, these schedules should relate directly to production-timing requirements. However, facilities management might struggle to maintain schedule control when requests for deviation are received. The requests sometimes result in improvised changes to existing AHU schedules to accommodate temporary needs relating to maintenance, testing, or production shift changes. For example, when evening maintenance is required for production equipment repairs (to avoid daytime disruptions), managers can change the AHU schedules in the BMS to maintain a comfortable environment for work crews. However, failing to realign the schedules to their original settings can lead to significant energy waste because AHU equipment will continue to operate unnecessarily. This is a common problem in facilities that need to control hundreds of assets.
Figure 6.5 represents actual data that illustrates how poor AHU schedule control creates significant waste. The normal schedule shown in Figure 6.4 prescribes for AHUs 1, 4, 5, 6, and 7 to shut off during the weekend. However, they remained on during that time, consuming an estimated energy waste of 14,000kWh. Analysts made this estimate by calculating the difference between the gas volume consumed during the weekend with the AHUs turned on (the thick black line in Figure 6.5) and the volume consumed during a similar weekend time period when the AHUs operated with a more appropriate upper control limit (UCL) of 22 (the thin black line). Finally, the analysts converted the gas volume used to kWh of energy consumption.

Figure 6.5 Energy consumption at beginning-of-weekend schedule
Source: IBM Journal of Research and Development
Analysts established the control limits using the statistical process control (SPC) toolset introduced in Chapter 5, “Transformation Methods and Green Sigma,” Section 5.5.2. By assessing process operations requirements and overlaying the standard AHU schedules in the management dashboard system, it was possible to statistically generate warning limits with respect to hourly gas usage. This enabled weekday operation to use an upper control limit (UCL) of 162, shown in Figure 6.5 by the upper dashed line; weekend operation used a significantly lower UCL of 22, shown by the lower dashed line.
Managers can use these limits to generate warnings and enable detection and correction of any significant AHU schedule out-of-profile event. This leads to significant ongoing energy and carbon emissions savings.
Assuming a conservative estimate of four to six detected events a year that would otherwise not be noticed, the expected savings would be nearly 2 percent annually. In energy terms, this corresponds to an annual reduction of more than 90mWh, with an equivalent carbon dioxide savings of nearly 20 tons for this building alone. By implementing real-time controls through the management dashboard system, the company could save more than 100 tons of carbon dioxide emissions across the entire five-building site.
To trigger an alarm, managers established settings that required two nonconforming measurements, to reduce the likelihood of false alarms from anomalous or erratic data. But if a high level of reliability could be proven from just one nonconforming measurement, managers could save additional energy by triggering and responding to an alarm even more quickly. Further incremental environmental benefits might be possible by taking more frequent measurements.
Businesses must modify facilities-management procedures and work practices to ensure adequate responses to alarms, to improve schedule compliance checking, and to sustain improvements indefinitely.
6.4.2. Adoption of Environmental Control Best Practices
Optimizing energy use by adopting environmental control best practices was a major energy-saving opportunity, with a much higher environmental benefit than the 2 percent improvement described in the previous section. Within the same building, analyses such as Figure 6.6 showed that simply adopting AHU evening-hours shutdown procedures during the week would yield significant energy savings. The potential energy savings from this improvement is roughly 7,000kWh per day, achieved by shutting down the AHUs from 7 PM to 7 AM in the warehouse portion of the building (using the SEUs already identified in the Sankey diagram). This single schedule change yields up to an estimated 20 percent savings in annual gas usage, corresponding to an annual carbon dioxide emission reduction of nearly 260 tons per year. Considering that the entire site includes five similar buildings, applying this approach across the entire campus yields a much larger reduction in greenhouse gas emissions.
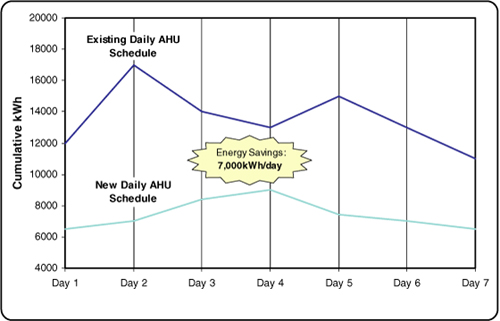
Figure 6.6 Energy consumption during off-hours
By facilitating the additional VOE Kaizens (rapid improvements) shown in Figure 6.4, the organization could challenge existing work practices and adopt more energy-efficient behavior without a negative effect on the work environment. The management dashboard system’s capability to communicate real-time KPI information represents a powerful tool to help analyze and realize such benefits.
6.4.3. Use of Design of Experiments (DOE)
The organization can achieve further improvement by adopting Six Sigma design of experiments (DOE) principles to characterize the environmental control heating process. The objective of such an exercise is to realize efficiency gains from the SEU assets, identified in the Sankey diagram in Figure 6.3 as AHU 4, 5, 6, and 7, and the duty standby gas boilers 1 and 2.
Using DOE, which can include factors for different AHUs, boiler types, and key hardware settings, the organization can identify hardware-optimization opportunities that yield further gains of 10–15 percent of total energy use. This corresponds to a further annual carbon dioxide reduction of 100–150 tons.
6.5. Step 5 Controls Ongoing Performance
By applying DOE principles and having an enhanced understanding of the sources of variation and waste, organizations can sustain and improve their ongoing control of energy consumption. Predictive-modeling capability from real-time visibility to gas usage enables organizations to accurately forecast expected carbon-emission levels, which could form the basis for a powerful decision engine and carbon-trading platform in the future.
By controlling ongoing performance and enabling continuous improvement for the warehouse operation, business travel, employee commuting, and all other business areas, organizations can follow a standard approach to further eliminate waste and reduce variability. Eliminating waste and reducing variability are two foundational principles from Lean practices and Six Sigma methods; next we describe frameworks that adapt them to environmental stewardship.
6.5.1. Eliminating Waste
Lean practices help eliminate waste, increase efficiency, and reduce lead time for process execution. Organizations can adapt Lean practices to target specific types of waste, sometimes referred to as “muda,” that have a direct impact on the environment and the organization’s carbon footprint. Eight typical areas of process-driven waste adversely impact the environment.
Overproduction clearly leads to increased carbon emissions from unnecessary manufacturing processes, larger requirements for warehousing facilities, and increased scrap from obsolescence that ultimately increases disposal and landfill needs. Similarly, waiting takes on many forms, from underutilized human resources to machinery that waits for work in process before adding value. In all cases, waiting leads to underutilized capacity and added facility requirements. This increases heating, lighting, water, and other utility consumption. Inventory that is either excessive or not stored at the optimal location also leads to added facility requirements, along with increased heating, lighting, water, and other utility consumption.
Reducing motion and transportation also reduces greenhouse gas emissions. Less motion and shorter transportation distances result in less energy usage and decreased total emissions. Motion refers to the movement that typically takes place within a facility, and transportation refers to distances traveled to move product or people between locations.
Rework refers to activities undertaken to revise a product or implement a fix, which clearly contributes to emissions and waste that adversely impact the environment. Similarly, overprocessing represents processing that doesn’t add value and could be eliminated from a process with the appropriate configuration changes. Eliminating overprocessing decreases energy and materials consumption, producing a positive impact on the environment.
Improper utilization of intellect is another form of waste that indirectly has an adverse impact on the environment. Not matching the right skills and tools to perform operations can clearly slow processes, cause rework, increase energy consumption, and waste natural resources.
The management dashboard system and the capability to assess the underlying data with statistical analyses are tools to help identify waste in all these areas. Identifying the root cause of waste enables organizations to take corrective action quickly and to define and launch longer-term improvement initiatives. When standardized data becomes available from multiple processes, companies, and entire industries, benchmarking becomes another valuable tool to determine whether current performance, defined by various KPIs, is adequate and where opportunities for improvement might exist.
6.5.2. Reducing Variability
Six Sigma practices help reduce process variability, making the valued outcomes more predictable and consistent. With process baseline performance known and understood, organizations can apply root-cause analysis when unwanted deviations occur. Two analytical tools adapted from Six Sigma can help organizations accomplish this for environmental sustainability.
First, statistical process control (SPC) with control limits (introduced in Chapter 5, Section 5.5.2) can help reduce variability. This analytical tool is also leveraged in the earlier optimization step, with upper and lower control limits statistically derived based on process-performance information. Organizations can use control limits in the management dashboard system for ongoing monitoring and control. As control factors deviate from their normal operating values toward the upper or lower limits, organizations can identify and take corrective action before problems occur. Process improvements or environmental changes might prompt organizations to change control limits and adjust alerts. For example, wide temperature variations from annual season changes can lead to required control-limit adjustments, especially when heating, ventilating, and air-conditioning (HVAC) systems are involved.
Second, design of experiments (DOE) uses controlled experiments to identify causes of variation within a process and to improve ongoing control. By designing and running a series of controlled experiments on a target process, DOE helps develop a greater understanding of the critical controllable input factors and their interactions. This understanding can reveal opportunities to reduce process variation. Because the “control ongoing performance” step is iterative, it’s normal for organizations to statistically adjust process control limits after conducting and learning from experiments.
6.6. Case Study Summary
Decreasing the level of facility or process operations reduces energy consumption. However, for large facilities, such as the one in this case study, organizations initially do not know the amount of energy they can save. Organizations must manage hundreds of components simultaneously without knowing which ones are the significant energy users (SEUs), and without clear responsibility for energy waste reduction. In this kind of complex environment, methodologies such as Green Sigma can help clearly identify the highest-priority opportunities to pursue, supply the information to quantify benefits, and provide the analysis and reporting tools to optimize operations, sustain benefits, and institutionalize continuous process improvement.
Establishing KPIs and associated measurement systems plays an important role in enabling enterprises to better manage and improve operations, reduce waste, reduce emissions, and better manage natural resources. The management dashboard system is one tool that has been shown to help companies achieve and sustain their environmental-stewardship aspirations. More broadly, the fully developed and proven practices from Lean and Six Sigma are well suited to support transformation and continuous-improvement programs whose objectives are to foster environmental conservation while reducing cost and waste.
It’s important to recognize that the same tools supporting data analysis and information visibility from Green Sigma, such as the management dashboard system, can also be effective drivers of behavioral and cultural change in an organization. Communicating environmental impact success stories through quantified operational improvements, and granting individuals access to process performance information that they can personally affect, enables companies to dramatically increase employee interest in and responsibility for improving the environment.
Organizations sometimes leave energy-consuming equipment operating during times of nonoperation, such as weekends, evenings, and nights, simply because the waste is perceived to be small, although it might actually be quite large. This is especially true for heating, ventilating, and air-conditioning (HVAC) systems that are often centrally managed, as well as desktop computers and supporting devices, lighting, and a myriad of other daily-use equipment and machinery that is typically managed in a decentralized way. For example, many companies today don’t have specific policies and awareness training for turning off computers or using “sleep mode” during off-business hours because business leaders themselves are unaware of the quantified opportunity that exists. For one employee, the effect is small; for a facility with thousands of employees, the impact can be significant. Even fewer companies communicate guidance on home office energy-conserving policies in which little or no visibility to conformance exists, even though the trend toward telecommuting is steadily growing.
Many businesses have already benefited from initiatives that align with their strategy to improve environmental stewardship. Carbon strategy is fast becoming a competitive issue among corporate boardrooms.[1] As a greater number of businesses adopt more holistic approaches to improving the environment, effectively applying methodologies such as Green Sigma will become increasingly important.