
Chapter 21 Using Reports Explorer for Ad Hoc Web Reporting and Microsoft Integration
Introducing Ad Hoc Reporting Conceptually 512
The Crystal Reports Explorer Application 513
BusinessObjects Live Office Add-In 527
Introducing Ad Hoc Reporting Conceptually
Too many competing definitions of Ad Hoc reporting exist to dispense with any introduction. This chapter does not pretend to address the larger question of defining Ad Hoc as a concept, but rather seeks to place the Crystal Reports Explorer tool into context as an Ad Hoc reporting tool. Simply put, Ad Hoc reporting or queries are impromptu questions you put to the data to extract answers. Although many permutations exist, from systems that enable the end user to directly query source data in raw form to accessing OLAP cubes, from tools for very SQL-savvy users to point-and-click tools, from preformatted or unformatted query tools to tools that enable pixel-level formatting, many tools and definitions exist in the marketplace.
Crystal Reports Explorer facilitates end-user Crystal Reports development and modification through a web browser. Whether the data source is a database or Business View, or another Crystal Report, the result is always a Crystal Report. Although OLAP Intelligence provides end users great interactivity, its exclusive connectivity to an OLAP data source helps you categorize it as an Analytic rather than Ad Hoc tool.
Most organizations debate the amount and type of deployment of various types of Business Intelligence, from reporting to ad hoc reporting, to query and analysis, to analytic workbooks, to purpose-built applications. Briefly, a typical organization, after reaching a mature stage of Business Intelligence deployment, finds that roughly 80%–90% of information distribution takes place with preformatted reports. Roughly 10%–15% might be ad hoc queries and another 5% analytics. Every organization varies, but a balance between the time and training necessary for end users to interact with data and the value they derive in the process should be fundamental.
Many organizations actually adopt ad hoc reporting as a method to reduce IT workload/spending and to provide increased end-user access to data. The Ad Hoc tool facilitates this approach by enabling end users to develop a Crystal Report themselves. This Crystal Report can then be saved into the BusinessObjects Enterprise system and viewed at any time, or even passed to IT for special features to be added. This concept that end users can do more themselves provides significant cost savings, but recognition that IT will always play a role in Business Intelligence marks a mature approach to the problem at large.
The remainder of this chapter focuses on how to use the Crystal Reports Explorer application as well as the Live Office add-in for Microsoft Office.
In previous versions, the Crystal Reports Explorer was known as the Crystal Enterprise Ad-Hoc tool.
Introducing the Crystal Reports Explorer Application
The Crystal Reports Explorer application uses the capabilities of BusinessObjects Enterprise to present report modification and creation capabilities via a web browser. HTML and CSP or JSP pages make up the application itself in the .NET or Java environment, respectively. These pages interact with the appropriate SDK and interact heavily with the Report Application Server (RAS), which provides the server-side report modification capabilities. Through heavy use of JavaScript in the browser, Crystal Reports Explorer interacts with the end user more in the fashion of an application rather than a static web page.
Because of the heavy level of interaction expected with usage of the Ad Hoc application, administrators should carefully project and monitor usage at the web server, BusinessObjects Enterprise, and database levels.
Crystal Reports Explorer consumes Business Views, Crystal Reports, or ODBC data sources, so database credentials, BusinessObjects Enterprise credentials, and a data access policy should be in place to maximize effective use of the application. For organizations that have determined to use Business Views for all data access, appropriate Business Views should be in place to enable end users to create reports with the Crystal Reports Explorer application, and appropriate permissions on those Business Views granted. For organizations that choose to enable direct access to the databases, again permissions should be granted.
Installing Crystal Reports Explorer
Installation of BusinessObjects Enterprise, along with either the XI Premium bundle or BusinessObjects Enterprise Professional with the appropriate “report modification and creation” key-code, are required before installing Crystal Reports Explorer.
Note that Crystal Reports Explorer supports the same platforms as BusinessObjects Enterprise XI with the exception of Netscape/Mozilla browser support—the heavy use of JavaScript precluded the compatibility between Internet Explorer and Netscape/Mozilla.
Two versions of Crystal Reports Explorer exist and require different installation methods: a CSP version and a JSP version, and a variant of the CSP installation where a UNIX Web server works with a Windows BusinessObjects Enterprise server. Depending on your environment and preferences, the proper version should be selected. The install.pdf file on your distribution of Crystal Reports Explorer contains detailed instructions on the various installations.
Configuration of Crystal Reports Explorer
Several areas must be configured before deploying Crystal Reports Explorer. Because the application heavily uses the RAS service/daemon, the settings for the RAS server should be specified for optimal performance. Also, because Crystal Reports Explorer enables you to create and modify reports and save them back to the BusinessObjects Enterprise system, you must modify or write appropriate rights to grant to the user or group on the particular folders affected.
![]() For more information on optimizing the RAS server performance, see “Sizing the Report Application Server,” p. 651 and “Servers and Processing Options,” p. 683. You also must have the Input and Output FRS servers running and configured for saving and scheduling reports to Enterprise. Of course, your CMS must also be running, and checked for load configuration if there will be heavy usage of simultaneous requests with CR Explorer.
For more information on optimizing the RAS server performance, see “Sizing the Report Application Server,” p. 651 and “Servers and Processing Options,” p. 683. You also must have the Input and Output FRS servers running and configured for saving and scheduling reports to Enterprise. Of course, your CMS must also be running, and checked for load configuration if there will be heavy usage of simultaneous requests with CR Explorer.
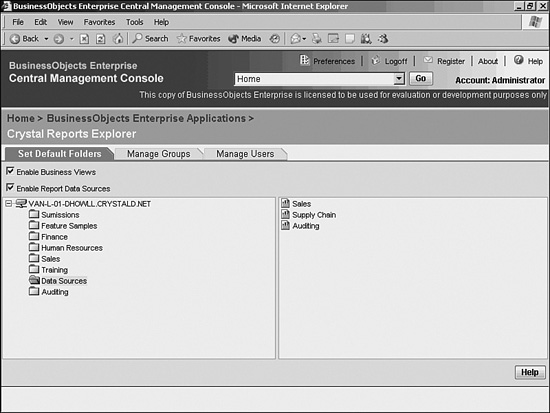
Further settings inside the Central Management Console, under Home, BusinessObjects Enterprise Applications, Crystal Reports Explorer determine which folders should be used for the default report templates and data sources. The actual contents of those folders display on the right side. In the displayed tree on the left, which shows BusinessObjects Enterprise’s folder structure, right-clicking a particular folder opens a menu to manage the folders (see Figure 21.1). At the bottom of the context menu the two options particular to Crystal Reports Explorer let you designate the default folders to be used in the application for Data Sources (which displays the folder icon in red) and Templates (in blue). These folders, respectively, contain reports whose data definition provides a starting point for ad hoc reporting and which you can use to reformat reports by using the template functionality. Often, for simplicity’s sake, administrators create a root folder labeled Ad Hoc and subfolders labeled DataSources and Templates, and then designate them accordingly using the right-click functionality.
Figure 21.1. The Central Management Console’s Crystal Reports Explorer application management display.
Checking the boxes to enable/disable Business Views or Reports as data sources determines what types of data sources the end users have access to. Business Views provide an easy way to define data in business terms, enabling end users to create reports in Crystal Reports Explorer and provide self-service end-user scenarios.
The Manage Groups and Users tabs are identical and manage permissions for Crystal Reports Explorer at the group and user level, respectively (see Figure 21.2). Using the group-level permissions enables more efficient management because fewer groups exist than users. You can then set individual user permissions by changing group permissions. If current groups do not map cleanly to the rights appropriate for this particular application, new groups can be created that map existing users or user groups to groups specifically created to manage Ad Hoc application permissions. The permissions on the right part of the management screen manage which capabilities the end user can see in the toolbar that appears in the end-user application at the left side, the control buttons along the application’s top right, and the tabs in the center of the application. Each of these capabilities is considered in the following sections.
Figure 21.2. The Manage Groups/Manage Users area for Crystal Reports Explorer in the Central Management Console.

Report Source Setup
The Crystal Reports Explorer application enables an end user to create a report from a Business View, an ODBC data source or a Crystal Report over the Web without having Crystal Reports installed. Business View creators create and store the Business Views in the BusinessObjects Enterprise system (refer to Chapter 18, “Crystal Reports Semantic Layer—Business Views”). Creating an Ad Hoc report from an existing Crystal Report requires a Crystal Report be in the Data-Sources folder as defined previously. You can either design this report in Crystal Reports and save it into the appropriate folder in BusinessObjects Enterprise, move an existing report into that folder, or create it in an administrative area of the application itself. Exercise caution when moving an old report into the report definition folders because groupings and table names might confuse end users creating new reports from that definition. Testing in this situation is mandatory to ensure end user success.
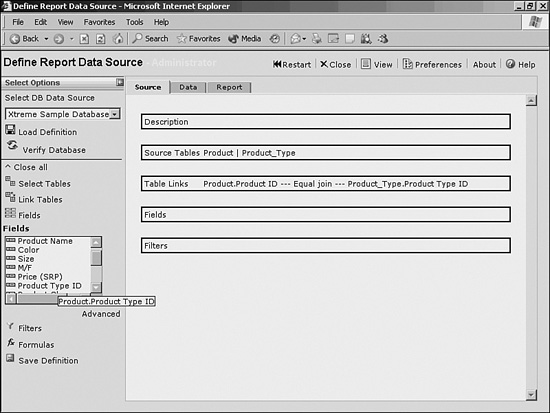
To set up this report definition, start the Crystal Reports Explorer interface. This interface is automatically integrated with the .NET InfoView interface during the installation of Crystal Reports Explorer. The installation guide also covers the steps for integrating Crystal Reports Explorer in the Java version of InfoView. In either case, Crystal Reports Explorer has two modes: an Administrator’s mode and an end user’s mode. Access the application by the application URL (by default, http:://<Machinename>/businessobjects/enterprise11/adhoc/) or directly from within InfoView. After you are logged in, choose the New, Crystal Report option, and this starts Crystal Reports Explorer. Logging on to this page with Administrator’s credentials provides two options: to Define Report Datasource or to Create Ad Hoc Report. The Create option refers to the end-user capability covered in the next section. The Define capability refers to the capability to create a report definition that can be used as a data source for an end user creating an Ad Hoc report at a later time.
Set the report data source definition by choosing to either select an ODBC connection via the Select DB Data Source drop-down on the left under the toolbar, or by clicking on the Load Definition option immediately below it. The Load Definition accesses Crystal Reports stored in the Default Datasources folder designated earlier. Choosing a report here enables you to modify the way that this report’s data definition is displayed to an end user creating an Ad Hoc report. The drop-down list displays the data sources you can connect to if you want to create a Crystal Report from scratch. Typically it contains only the ODBC option. Choosing that option opens a dialog box asking you to select an ODBC connection existing on the server machine that hosts the Report Application Server service/daemon of the BusinessObjects Enterprise system. By choosing the ODBC connection name (DSN), and then supplying the database credentials (username and password), and optionally any connection strings for the ODBC connection, you establish a connection to the database. Keep in mind that because this is a web application, the dialog to choose the ODBC connection often has an approximately five-second lag, so wait for default values to show in the top line before clicking.
After a data definition loads, commence moving down the rest of the toolbar—the application design concept has the user start at the top of the toolbar and proceed down by first choosing the definition, selecting tables, linking them, choosing fields, determining filters and then formulas, and then saving this definition. Each of these items on the left is first single-clicked initially, displaying either a dialog box or a simple modification section immediately below it.
Because the dialogs and modification sections in Crystal Reports Explorer behave very consistently, a short detour to discuss how you interact with them helps you move through the rest of the material smoothly—especially because this web application interacts with the end user so much and differs from many Windows conventions and Internet conventions for clicking and maneuvering. Note that the mere inclusion in this book of the following descriptions should trigger the thought that end users require training to successfully use this application. Although quite simple, the application does require some training even if this is only 15 minutes of introduction for the savvy user.
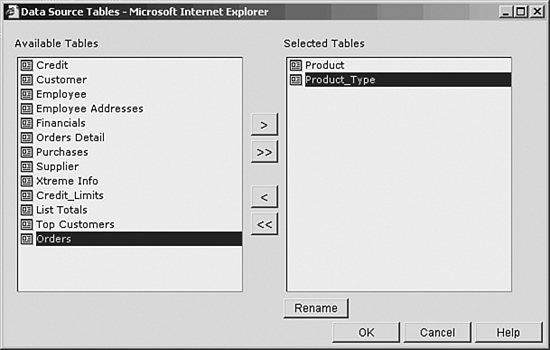
Each item in the Report Explorer toolbar on the left should be clicked once only to open it or its dialog box, and then clicked again to hide details that have displayed beneath it. Many users double-click on the toolbar items and wonder why they see nothing! Close dialog boxes by clicking OK or Cancel once. Most dialogs have a list on one side and another list on the other side (see Figure 21.3). In these cases, a single-click selects an item, Ctrl+click adds each clicked item to the current selection, and Shift+click selects everything between the item first selected and the item Shift+clicked. Moving items can be accomplished by double-clicking them, dragging a selection from one area to another, or by clicking the single chevron ( > ) to move a selection in that direction. Clicking the double-chevron ( >> ) moves all items in that direction, effectively clearing one area. Remember that response time is always slower in a web application and that clicking multiple times usually results in strange behavior because the application catches up with the user. Counsel end users to wait until they see the desired reaction visibly before going on to the next click or action so that they do not inadvertently cause strange behavior.
Figure 21.3. The Data Source Tables dialog.
This caution cannot be stressed enough as a crucial part of the education process because end users often click on an item to open a dialog box, and then click again somewhere else in the same window before the dialog box has opened, causing the dialog box to open behind the main window, effectively freezing the application. In cases like this, a savvy user simply minimizes the foreground window and finds the dialog waiting there. However, many times a frustrated user compounds the situation by clicking away in the vain hope that something will happen because he is clicking more, and eventually calls tech support with a frozen application. End users must be carefully instructed that although this application seems like a Windows application, it is still a series of web pages, and that web technology has these limitations. You gain by extending the capability to modify and create reports with nothing installed on the machine—you also must live with the resultant limitations. Users might notice a similarity between the items in the toolbar and the Report Creation Wizard in Crystal Reports itself. This similarity is purposeful and makes migration to the concepts in Crystal Reports Explorer simple for the user familiar with Crystal Reports. In addition, the underlying functionality of Crystal Reports Explorer mirrors that of Crystal Reports, now presented more simply and over the Internet. Thus in an effort not to repeat information here about actual feature behavior, the reader can refer to the appropriate chapter on Crystal Reports for a more detailed understanding of the underlying concepts such as table linking, filter and formula creation, and the like.
The toolbar itself, incidentally, can be moved by clicking and dragging the Toolbar label on the top left, and restored by clicking on the x on the right of the toolbar. The original position of the toolbar on the left side, described as docked, also enables the end user to close it by clicking on the x, and then restore it by clicking on the triangle icon at the top left.
Returning to the flow of designing a report source, you click once on the Select Tables item to open the Data Source Tables dialog box (refer to Figure 21.3). Moving tables to the right includes them in the definition. After you’ve moved them to the right, you can rename tables by selecting them and clicking once on the Rename button. When you’re finished choosing tables to include, choose OK. Again there is a pause after clicking OK as the page redraws after a round-trip to the server. End users have to be instructed not to click before the page loads again.
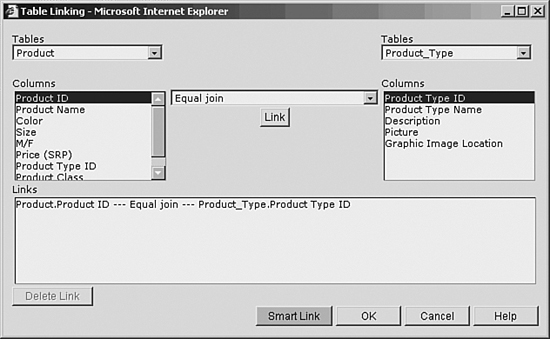
After selecting tables, you link them by clicking Link Tables in the toolbar, which opens the Table Linking dialog box (see Figure 21.4). To link tables, select a table on the left, another table on the right, and then the columns in the tables that will make up the link underneath the tables, respectively. Select the desired type of join from the drop-down list, and finally click the Link button once to create the link you have selected. This link now shows up in the Links area of the dialog box. Selecting a join and then clicking the Delete button deletes that join, and clicking the Smart Link button replaces all the current joins with joins that the server believes are the best based on column names, data types, and index and key positions in the database, if that information is available. Best practice recommends that if you want to use Smart Link functionality, attempt that first, and then examine the results. This way you save work if the joins are correct and can simply delete the incorrect links. When finished, click OK and move to the next item: field selection.
Figure 21.4. The Table Linking dialog box.
Clicking once on the Fields item in the toolbar opens a mini-dialog box underneath the Fields item. Clicking again on the Fields item hides the mini-dialog. Each time you click on a field in the mini-dialog, an asterisk appears next to that field, and it appears to the right in the Fields area of the Source tab (see Figure 21.5).
Figure 21.5. The Field Selection mini-dialog.
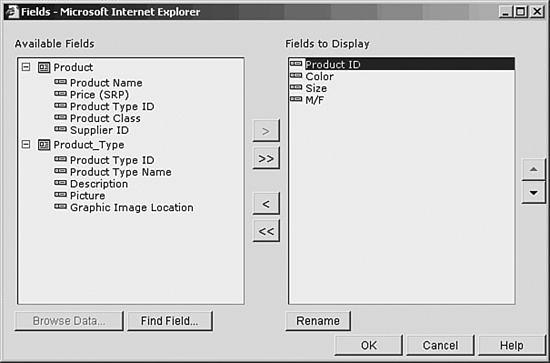
Clicking on the Advanced label underneath the Fields mini-dialog opens an advanced Field dialog box. This dialog enables you to bulk move items and arrange them left-to-right on the report by moving them up or down (up means to the left, and down to the right) in the Fields to Display area by selecting a field and then clicking the up or down arrows at the far right of the dialog box. This advanced dialog arranges available fields by table, but enables you to search for fields by clicking on the Find Fields button, as well as rename fields by selecting the field in the Fields to Display area, and then clicking on the Rename button (see Figure 21.6). Again click the OK button to finish this area and return to the main window.
Figure 21.6. The advanced Fields selection dialog.
Clicking on the Filters item opens the Filter mini-dialog, which can be hidden by single-clicking on the Filters item in the toolbar. The process of adding a filter mirrors that in Crystal Reports. Choose the field to filter on in the top drop-down list and choose the operator in the next drop-down list. Then enter the value, or click the Browse button (this is represented by an ellipses [...] on the button), which retrieves values from the database for that field, enabling you to select a particular value from the database if you do not remember the correct value. The Browse button might disappear if the field data type changes to a field type with limited values. For instance, a Boolean field type with only True and False values simply shows True and False in the Value drop-down list, and no longer includes a Browse button. Once you have specified the filter criteria, click Add and confirm the filter has been added in the Filters section of the Source tab.
The Advanced option in this mini-dialog launches the Filters dialog (shown in Figure 21.7), which provides the opportunity to create complex filter specifications using AND, OR, and parenthetic expressions. Elements that appear in the top area of the dialog can me moved by clicking and dragging them within the text window.
Figure 21.7. The Filters dialog box.
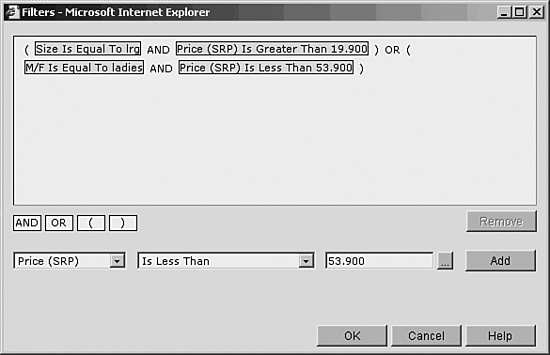
When in the advanced Filters dialog, remember to click the Add button on the right to add the filter to the top area of the dialog before clicking OK. Clicking OK before adding the filter is like clicking Cancel and results in no filter being applied. Once added, a filter can be modified or removed via the advanced Filters dialog by highlighting the filter specification and then clicking on the proper button at the bottom left of the dialog box.
The one case where the user is required to double-click instead of single-click is when adding an AND, OR, or parenthesis to the filter specification. You must double-click these to add them to the top area of the dialog.
After creating the appropriate filters, you can add a formula. The formulas appear to end users as fields, and they will not know that these are calculated items. Thus if a database or Business View does not contain a necessary field for a query, but the field can be created in a formula from existing data source values, the formula here can present the desired value. Clicking on the Formulas button opens a dialog (see Figure 21.8). After it opens, initiate the process by clicking on the New button on the bottom left, which enters a default formula name above at the top right; you can overwrite the default with the chosen field name for the formula you are about to create. By typing in a valid Crystal Reports formula in the Formula Text box, you create the desired expression. Double-clicking on either a field name or a Function name in the Fields or Functions boxes enters that value into the Formula Text dialog at the point where the cursor was last positioned in that box. For a more detailed discussion of formula syntax, refer to Chapter 4, “Understanding and Implementing Formulas,” because the formulas here are exactly the same as formulas in Crystal Reports. In fact, should the report definition require very complicated formulas, the designer should either use Crystal Reports to create the report definition and save it into the correct data sources folder in BusinessObjects Enterprise, or use the Business Views tool to create the formula in a Business View because both Crystal Reports and Business Views feature a full formula editor. At the bottom of the left side of the dialog box are buttons to check the formula syntax and give a status on whether the formula is valid, and a Remove button, which deletes the formulas highlighted above on the left side. When you’ve finished entering the desired formulas, choose OK.
Figure 21.8. The Formulas dialog box.

Next, save the formula definition that you have created into the BusinessObjects Enterprise system. The name you choose for the definition will be presented to end users who want to create reports based on that definition.
Although there are Query, Data, and Report tabs along the top of the screen, they are not important at this stage and are detailed in the next area. Additionally, at the top right, you have buttons to (from the left to right):
- Restart the process and clear any work you have just done
- Close the application window altogether
- View the report on which you are working
- Change preferences
- Give version information (About)
- Show the application help
The preferences enable you to do the following:
- Select default colors
- Determine which tab opens first
- Determine how the toolbar behaves in terms of whether it is docked at the left, floats in the window, or does not show up at all
- Choose whether to display mini-dialogs or the advanced dialogs initially
- Choose whether to display field names, descriptions or both
- Reset to default preferences
- Choose whether to use a report template to format the reports by default
- Choose how many rows to show initially in the data grid
- Choose which areas to show in the Design tab
- Choose whether to show and/or snap to grid on the Design tab
Alternatively, creating a Business View provides much of the same capability, and should be the first method used to create data definitions for Crystal Reports Explorer report design. However, in cases where the database administrator cannot access the Business Views tool, or where a Crystal Report has already been created and there is a need to quickly modify it into a data definition for Ad Hoc report creation, the Report Definition process can be extremely useful.
Report Creation and Modification
With the data definition or Business View in place, end users create reports by logging directly in to the Crystal Reports Explorer application or by selecting Crystal Report from the New menu within InfoView. In both cases, the user is presented with the Choose Data Source dialog where they can select from the available data sources (see Figure 21.9). An examination of the application screen shows that the top-right area is identical to the section detailed previously, and behaves in exactly the same way. Again, most of the items on the left are also exactly the same as the section just covered, except that they do not include the same starting point. The assumption that the end user does not have database skills or desire to optimize the database query precludes those items from this end-user oriented section.
Figure 21.9. Choosing a Business View as a data source.

After choosing a data source, you choose fields in exactly the same way that you chose them earlier. You then create groups by clicking on the Groups item on the toolbar, which behaves exactly as the Fields chooser, except the order of the groups might be more important because groups nest inside one another. Moving items up or down within the advanced Groups dialog enables you to change the grouping order.
Again, the Filters and Formulas items mirror the previous section.
The Summaries area enables you to create summaries of values for each group and behaves identically to the Filters dialog, except that the result is an aggregate calculation of fields rather than filtering of them (see Figure 21.10). You choose the field to be summarized, the type of summary desired (note that the options displayed depend on the field type, so string fields have different options than numeric and the like), and the level of the report (for example, the group name) at which the summary is desired. Again, make certain to click the Add button before clicking OK to add the summary to the report.
Figure 21.10. The Summaries dialog box.

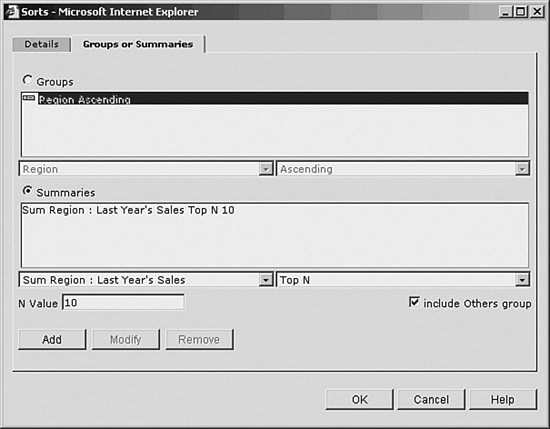
The Report Sorting item on the toolbar defines sort orders for the report details or groups. You can enter a simple definition by selecting the field to sort on and the order (for example, ascending) in the mini-dialog. The advanced item opens a dialog box allowing more advanced sorting on groups or summaries in addition to sorting on fields. Note that multiple sorts can be created here (see Figure 21.11).
Figure 21.11. The advanced Sorts dialog box.
![]() For more information on sorting options, including Top N and the like, see “Using Group Selection and Sorting,” p. 89
For more information on sorting options, including Top N and the like, see “Using Group Selection and Sorting,” p. 89
If you want a chart, click on the Report Chart item in the toolbar to open the Report Chart dialog box, which enables you to choose a chart type (Bar, Line, or Pie), provide a title for that chart, place it either in the report header or footer section, and if there are multiple groups or summary values, choose the appropriate values for the chart.
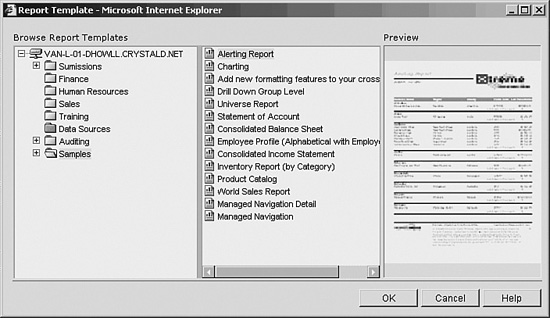
The Report Template item in the toolbar opens the door to one of the most useful features in Crystal Reports: the capability to format a report in one step. The Report Template dialog asks you to choose a template from several default templates, which will format the report accordingly. As you select any item in the template list in the dialog, a preview thumbnail image appears on the right giving you an indication of what the report might look like. Even more powerful is the capability to create your own templates, store them in your designated Report Templates folder (see the beginning of this chapter for more information), and then by clicking on the Templates button at the bottom left of the dialog (see Figure 21.12) apply the formatting in that report to the report you are designing, including fonts and other field formatting, headers and footers, and chart formatting.
Figure 21.12. Choosing a template to apply to the report.
![]() For a more complete discussion on templates, see “Understanding Report Templates,” p. 320
For a more complete discussion on templates, see “Understanding Report Templates,” p. 320
Again, as per the previous section, end users can save this report into the folder of their choice, assuming that they have write permissions on that folder. Often end users save into their Favorites folders.
At any stage in the process end users can move to a different tab than the Query tab that you have used so far to work through different views of the material. Now this chapter takes a closer look at the Data and Design tabs.
The Data Tab
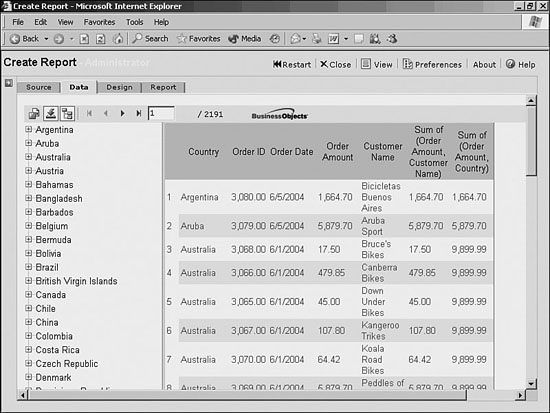
The Data tab shows you a data grid of the values selected in the report. Note that you can use this, or any other tab, while creating the report and see things develop as you add fields, filters, and the like to the report. When a report includes groups, a group tree shows on the left side of the view. This can be toggled on and off by clicking the group-tree icon at the top left of the report viewer toolbar (see Figure 21.13). Clicking on an item in the tree shows the values for that group in the display grid. The rest of the report viewer toolbar is a standard Crystal Reports toolbar with export and navigation capabilities, with two exceptions. Because the view includes row numbers, the white page with the red arrow icon (near the right side of the toolbar) enables you to navigate to a particular row number, and the Flat View icon (the second from the left) toggles between a grouped view, which enables drill-down by clicking blue-underlined values and a flat view, which has no grouping applied.
Figure 21.13. The Data tab of the Crystal Reports Explorer application showing a group tree with several countries.
In previous versions, you can select information right from the grid and copy and paste it into Excel and it falls into the right row-and-column structure, which saves time for simple data transfer. In the XI release of Crystal Reports Explorer, you must first select the export function, and choose Excel format. The Data tab view will change from a text format to a grid object that supports the mentioned functionality.
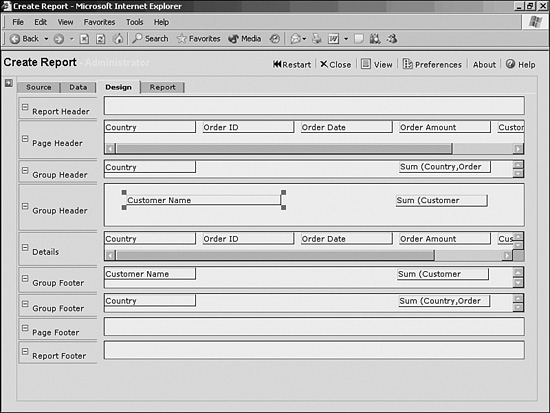
The Design Tab
Much like in Crystal Reports, Crystal Reports Explorer offers a Design tab for formatting the report in a detailed fashion. Many of the basic formatting options are available here. To move a field, click and drag it to the desired location. To select a field, click on it. You will know you have selected it when you see small gray blocks appear at the visible corners of the field. Be careful about what you do, however, because there is no Undo button as there is in Crystal Reports. You can then move your mouse over the blocks and resize the field, or right-click on the field to access a menu that gives you formatting and alignment options. The formatting options are a subset of those in Crystal Reports and behave in exactly the same way (see Figure 21.14).
Figure 21.14. The Format dialog in the Design tab.
![]() For more information on the options in the format dialog or the right-click menu, see “Exploring The Format Editor Dialog Common Options,” p. 168 and “Modifying Object Properties for Formatting Purposes,” p. 164
For more information on the options in the format dialog or the right-click menu, see “Exploring The Format Editor Dialog Common Options,” p. 168 and “Modifying Object Properties for Formatting Purposes,” p. 164
Right-clicking in a white space not occupied by a field, but still in the report sections, enables you to enter a text field or open the section expert. Like the section expert in Crystal Reports, you can determine here how sections should behave, and for instance, create a drill-down report section on the Web (see Figure 21.15). For a complete discussion of sections and section behavior, refer to Chapter 7, “Working with Report Sections.”
Figure 21.15. The Section Expert dialog in the Design tab.

Ad Hoc Report Design Summary
Crystal Reports Explorer provides powerful report creation and modification over the Web, with many of the core features of Crystal Reports exposed to an end user without any desktop installation. Coupled with the power of Business Views to simplify database interaction, most users can create or modify reports quite easily. Although out of scope in this chapter, Crystal Reports Explorer can easily be modified to open existing reports for modification as well as the report creation capability detailed previously. The end users of this application can then share the newly created value with their colleagues by publishing their newly created or modified reports back into BusinessObjects Enterprise directly from Crystal Reports Explorer.
With the overview of Crystal Reports Explorer completed, you now move to the second major Ad Hoc tool in BusinessObjects Enterprise, the BusinessObjects Live Office add-in for Microsoft Office.
BusinessObjects Live Office Add-in
Because so many information workers today use the Microsoft Office suite and, in particular, Microsoft Excel extensively for worksheet applications and data manipulation, it follows that enterprise report data should also be accessible in Microsoft Excel and other Microsoft Office applications. With the release of XI, the Crystal Reports plug-in for Excel has merged with the former Office add-in to become BusinessObjects Live Office.
Live Office provides a bridge between enterprise report data and the applications that are part of an information worker’s everyday tasks. Whether the data is needed in a simple table in PowerPoint, or extensive data manipulation is needed in Excel, Live Office provides the link back to a centralized Business Intelligence repository. In this section, we will cover the Live Office add-in in the Microsoft Excel, PowerPoint and Word applications.
Architecture and Deployment Scenarios
The Live Office plug-in requires installation on the local machine, and so requires administrative rights on the local machine.
The connection between the Live Office plug-in and BusinessObjects Enterprise uses TCP/IP over the local area network. Because of the direct connectivity between Microsoft Office and BusinessObjects Enterprise, an Internet connection does not easily support the plug-in; usually a LAN connection to the BusinessObjects Enterprise server is required.
A web services connection is required for Web Intelligence reports. This is configured from the Options menu and then the Web Services tab. Specify the server name of your Business Objects Enterprise Server.
Administration and Setup
The installation commences by executing the setup executable on the client machine. Because the plug-in opens Crystal Reports, the BusinessObjects Enterprise server should be configured to grant View, Edit, Refresh, and View instances permissions to the end users who would use this application.
The Live Office connector on the BusinessObjects Enterprise system is enabled with a Live Office keycode or a Premium keycode.
Connecting to a Report
The following steps connect to a report:
- From Excel, highlight a cell where you would like to display the report values, and then choose the Business Objects menu, and the New View item.
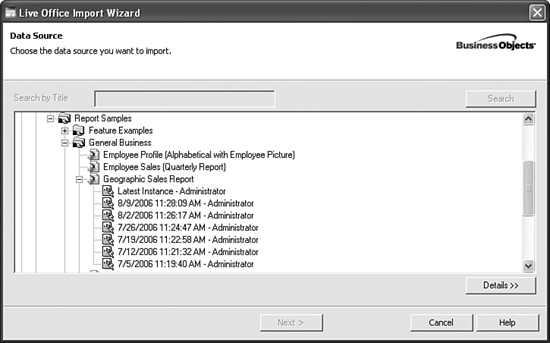
- Expand the Business Objects Enterprise folder in the Data Source dialog. If you have not already logged on to the system, provide credentials to log on to Business Objects Enterprise, and see the Business Objects Enterprise folders, from which you can choose either a Crystal or Web Intelligence report as a starting point for your query. If you select the report object, Live Office always runs the report on demand and pulls the latest data. If the report has instances associated with it, you can select an instance by clicking the expand icon associated with the report, and this expands to show all associated instances (see Figure 21.16). If you select an instance, it pulls the data from the historical instance stored on Business Objects Enterprise and does not rerun the report against its database. You can also select the latest instance, which is useful because doing so always provides you with the last time the report was scheduled so that you don’t have to reselect the instance.
Figure 21.16. Live Office displays the associated instances with the selected report.
This capability to connect to instances is particularly valuable for creating time-series analysis, as many different Crystal Report views can be created within one Excel worksheet, not to mention across many tabs. Of course, any Excel calculation can be applied to these values as well, facilitating the creation of summarized and formatted dashboard views that might refer to many worksheet tabs in a workbook. It is recommended practice to have only one Live Office View per Excel tab.
- If the report contains a parameter, Live Office prompts you to enter the parameter. If you are using Excel, you now have the option to bind this parameter to a designated cell inside your spreadsheet. This is useful because it enables the user to switch parameter values from within the Excel spreadsheet without having to open the Live Office dialog boxes, as shown in Figure 21.17.
Figure 21.17. User can switch the parameter values of a report without having to leave Excel.

- In the Data Selection dialog box, specify whether to use fields from the report or from parts of the report.
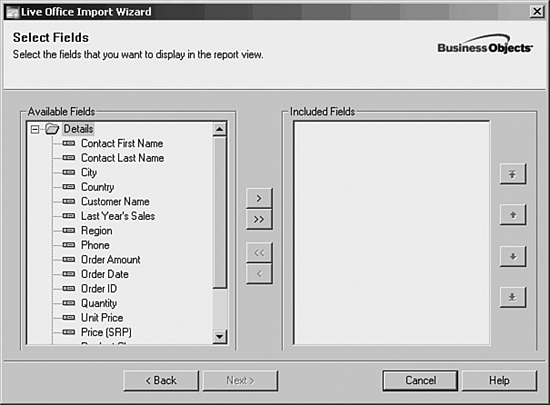
- This in turn opens the Report View Expert, which starts with the Select Fields item. As you do with the Crystal Reports Explorer application and the Crystal Reports Wizard, you simply move items to the right to include them in the view. (see Figure 21.18).
Figure 21.18. The Select Fields dialog of BusinessObjects Live Office add-in.
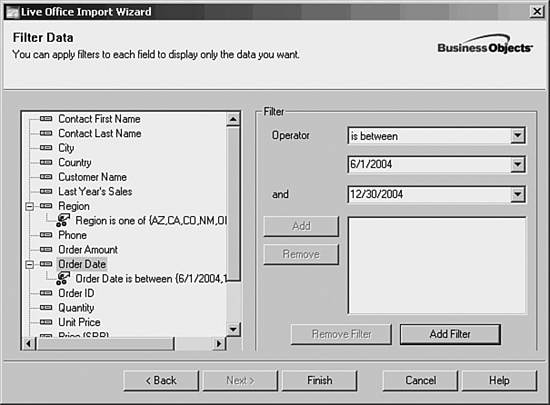
- By clicking the Next button you navigate to the Filters dialog. If you had no need to filter the content, you could simply click Finish to populate the data into Excel, starting from where the cursor was placed before you chose the menu item. The Filters dialog asks you to choose a field on the left, and then working from the top on the right, choose an operator (for example, is one of, equals) and appropriate values beneath to filter the returned data (see Figure 21.19).
Figure 21.19. The Filter Data dialog of the BusinessObjects Live Office add-in.
- When you are finished adding appropriate filters, you choose Finish and populate the data into Excel.
If you selected a Web Intelligence report and a context exists, the user is prompted to specify the context. For more on context, see Chapter 18, “Using a Semantic Layer—Business Views and Universes.”
Modifying the Report View
The data then displays in Excel. Should you then want to modify the report display, both right-click menus and the Business Objects menu enable you to manipulate the data view in real time. To activate the right-click menu, you have to right-click a cell that contains data populated by the Crystal Reports view (typically cells with a light yellow background).
The right-click menu has several choices. The Insert choice enables you to insert a blank row or column in the display. The Filter submenu enables you to see only data where the value includes the value you clicked on (the Focus On Value), everything other than the value you have right-clicked on (the Exclude Value option), and the Add/Modify option, which opens the Filters dialog. This enables you to simply right-click a value like USA for country, choose Filters and then Focus On, and see only values for the USA. Choosing the right-click option for Remove does exactly as advertised and clears any filters on the selected column.
When inserting or deleting rows and columns, notice that a full row or column is inserted within the report view only. Cells outside of the report view do not change.
The Field choice on the right-click menu enables you to remove the selected field or open the original Select Fields dialog box where the full list of available and selected fields are listed.
The View choice exposes the options available on that report view. The View Report Source choice opens the report in the report viewer where the user can select parts of a report and add them to the current view. The Refresh choice connects to the database and refreshed the data from the database at that moment. The Remove option removes the entire report view from the worksheet; a confirmation dialog is provided when this choice is selected. If the report allows for drilling, the Drill option becomes available, enabling a user to drill up and down the hierarchy of a report, as seen Figure 21.20.
Figure 21.20. The Drill option enables the user to drill up and down the hierarchy.

Drilling down the report hierarchy to display the details for the selected line item. The Properties choice opens a dialog with details on the report view like the Report Title, the BusinessObjects Enterprise system supplying the view, the connection ID (useful for troubleshooting), the view ID, the field name, the current value and the field data type. The Data Source choice displays the type of data source connected to (such as data source versus Report instance), whether the particular instance is the latest and when it was run, and if this data comes from an instance at all. The user can change the selected data source in this view, similar to the Set Origin choice from the Crystal Reports Excel Add-in in version 10. The Options choice allows the user to specify the Appearance, Instance, and Formatting options. When the Conceal Data When Saving option is selected, the data is concealed to prevent unauthorized access to the information. The Instance option provides a choice to use always the latest instance or the latest instance for a specified user. The formatting choices provide the option to preserve any end-user formatting when refreshing the report or whether or not to inherit formatting defined in the source report. Finally, the Parameters choice from the View menu opens a dialog to change the parameter values in the report.
Lastly, the BusinessObjects Live Office menu offers one option not available from the right-click menu: the Options dialog. This dialog exposes many of the default behaviors of the plug-in. The View tab enables you to specify default data values through the Data Defaults button, and also specify whether you want to conceal the data retrieved when saving the workbook. Additionally, specifying inherit report part or field formatting sets format inheritance on all data views in the workbook. This inheritance option can be overridden on an individual data view as explained earlier. The View tab also provides a choice to display filters and sorts as comments, and whether to display a field by name, description or both. Should you want to change the right-click behavior or how cell widths or cell protection occurs, you accomplish this from the General tab. The Enterprise tab enables you to set a default login for convenience. The Analysis tab is new in version XI and specific to the OLAP Intelligence component of the Live Office add-in. This tab allows you to specify drill-down options and dimension member display options when connecting to an OLAP data source.
The Excel plug-in, although simple in terms of usage, results in powerful interactivity. Users value this particular method of accessing report data very highly, as they are accustomed to doing data manipulation in Excel, and the value of having enterprise data from a variety of sources available in this format increases knowledge worker efficiency greatly.
Using Live Office with Direct OLAP Connections
In previous releases, the Crystal Analysis add-in for Excel provided users with the capability to connect to OLAP data sources. The Crystal Analysis add-in functionality is now available within the single BusinessObjects Live Office add-in. Instead of connecting to a report or report instance, the Direct OLAP Connection option in the Data Source dialog exposes the list of OLAP connections defined in the BusinessObjects Enterprise XI system. In this way, users can combine data from both Crystal Reports as well as OLAP data sources in a single worksheet. The Business Objects menu now lists Direct OLAP Connections along side of reports, universes, and Business Views.
Establishing a direct OLAP connection differs from the predecessor, the Crystal Analysis add-in for Excel, in that it does not report directly from existing OLAP Intelligence workbooks stored in BusinessObjects Enterprise—instead it connects to a cube and works from there. The BusinessObjects Enterprise ActiveX viewer for OLAP Intelligence reports and the thick client OLAP Intelligence designer also enable exported OLAP Intelligence views to the Live Office add-in and enable continued analysis from within Excel.
End users find that the direct OLAP connection offers very much the same interface that they are accustomed to within the OLAP Intelligence worksheet, and offers the capability to massage a view, or several views, at a time, and then tie them together using standard Excel formulas and functionality. This flexibility facilitates much more self-service. The user interface, although powerful, uses simple concepts that enable data manipulation that most users prefer to Excel’s own pivot tables, which require quite a bit of training to properly use.
Setting Up and Administering Direct OLAP Connections
Note from the previous paragraph that the add-in connects directly to the data source. The direct connection from Excel to the data cube uses either the appropriate drivers or Microsoft’s Pivot Table Services when connecting to a Microsoft SQL Server Analysis Services cube. Similar to using the OLAP Intelligence Rich Client, these drivers sit on the client machine and connect directly to the data source, compared to using the HTML viewer that directly connects to BusinessObjects Enterprise, which in turn connects to the data source. So direct connectivity to the data source—usually in the form of a LAN connection—must be available for Direct OLAP Connections to function properly.
The installation requires that an actual set of files be installed on the local machine, which again requires local administrative rights during the install process.
Connecting to a Workbook
This section presupposes that you have already read Chapter 19, “Creating OLAP Intelligence Reports,” and Chapter 20, “Introduction to Web Intelligence,” which cover OLAP Intelligence in depth. You should also be familiar with the concepts in OLAP and in OLAP Intelligence. Thus the following discussion of direct OLAP connections via the Live Office add-in focuses on how these are implemented, not on the actual functionality.
To begin with, you either export a view from the OLAP Intelligence viewer, rich client, or designer, or start a new connection from within Excel through the Business Objects menu. Then you open a new Cube View, connect to a cube using a dialog identical to the one in OLAP Intelligence, and then orient the view in a dialog screen identical to the Worksheet tool in OLAP Intelligence (see Figure 21.21).
Figure 21.21. Orienting a cube view using Live Office.
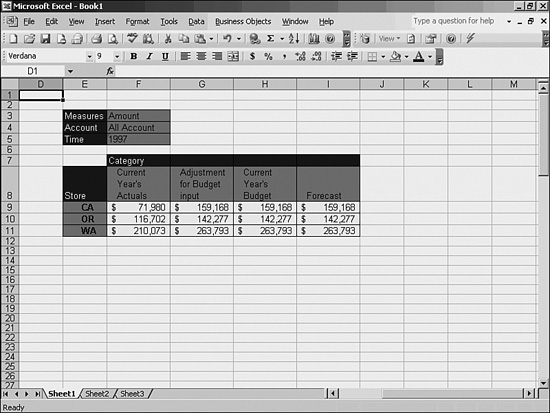
After orienting this view, you choose OK to return to the worksheet with your new view. Here you also have the option to save or open a viewpoint file (an XML file ending in *.cvp), which describes a particular orientation. This creates a cube view in Excel where your cursor was last positioned (see Figure 21.22).
Figure 21.22. The Direct OLAP Connection cube view within Excel.
Modifying the Workbook View
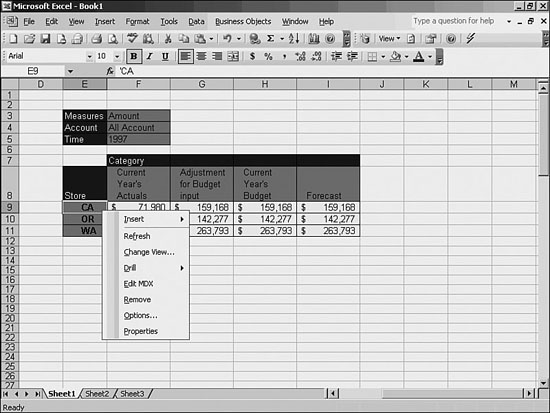
After the view has been established within Excel, you can manipulate it just as you did in OLAP Intelligence either by using the Business Objects menu commands or by right-clicking on a cell in the cube view as illustrated in Figure 21.23.
Figure 21.23. Right-clicking on a cell displays the Live Office menu.
The Live Office right-click menu appears slightly different when positioned on a direct OLAP connection. The menu for each item is discussed next.
The Insert item allows a user to insert rows or columns within the context of the view. Inserting a row or column in a view does not affect the cells outside the view.
The Refresh option refreshes the current view only. It does not refresh other views. If you want to refresh all views, the Business Objects menu provides the option to do this. If a connection to BusinessObjects Enterprise or the OLAP data source has not yet been established, a logon dialog will appear to confirm you have access to the data source.
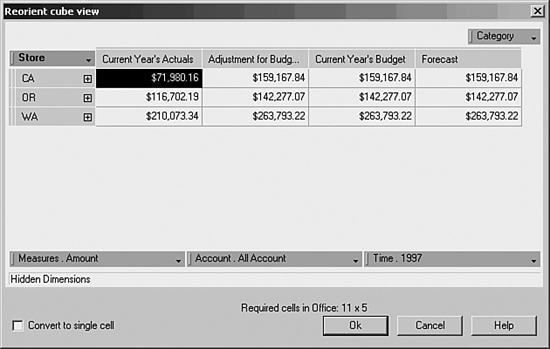
The Change View option is very similar to the interface provided in InfoView or the OLAP Intelligence designer. In the Reorient Cube View dialog, the user can specify the cube orientation and which dimensions are hidden. The number of required cells are calculated and displayed in the dialog.
The Edit MDX menu option is valuable to those skilled in MDX. This syntax, known as Multidimensional Expressions query language, is used for sending requests to Microsoft Analysis Services. A library of functions are exposed through the MDX query panel, as shown in Figure 21.24.
Figure 21.24. The MDX Editor invoked by the Edit MDX option.

The Remove option on the menu removes the view entirely from the workbook.
The Options menu item provides the user with a dialog for specifying View Layout and Formatting options. View Layout relates to displaying or concealing items in the view, such as slice panel and column and row dimension headings. The View Layout is also where Conceal Data When Saving is specified. This is an important feature to keep in mind when dealing with sensitive information. The formatting options are the same as when connecting to a report, Business View, or universe, and relate to retaining custom formatting applied to views.
The Properties option displays the Properties dialog. Depending on whether a data cell or dimension member cell is selected, the dialog will either display cell information or dimension information, respectively (see Figure 21.25).
Figure 21.25. The Properties Data tab.

Also unique to this OLAP view in Excel is the capability to drill up and down by double-clicking on the cells with a [+] or [-] cell. Double-clicking on a dimension label (which is blue by default) opens the Member Selector as well. Clicking and dragging an item, however, does not have the effect of swapping or pivoting dimensions within Excel—instead you will find an area of the worksheet selected. Use the right-click menus to choose Re-orient Cube, which opens the worksheet dialog that supports the click-and-drag operations you are accustomed to within OLAP Intelligence.
Using BusinessObjects Live Office in Microsoft PowerPoint
The use of enterprise report data in Excel is of great value to the information worker who needs extended analysis capabilities in a spreadsheet environment. However, the value of centrally located enterprise data does not stop at the analyst’s desk. Consider the PowerPoint presentations that are created based on the data contained in spreadsheets. Most often, the data in those presentations was placed there using classic cut and paste tactics. This is an enormously resource-intensive process that can be prone to error and is repeatable only at the same cost of resources.
BusinessObjects Live Office add-in addresses many of these issues by enabling the PowerPoint user to embed data directly from BusinessObjects Enterprise into a presentation, and in a single action refresh all the data based on the individual view settings. In a single presentation, multiple reports, report instances, Business Views, and OLAP data sources might be used as a basis for a single slide deck (see Figure 21.26). After the presentation has been established, it can be refreshed without repeating the process of rebuilding the entire presentation.
Figure 21.26. Live Office in PowerPoint connecting to multiple reports and OLAP data.
The process for placing data into a PowerPoint presentation uses the exact same menu and right-click functions used in Excel. Refer to the beginning of this section for details on the Insert, Filter, Field, View, Refresh, and Drill functions.
Keep in mind that there is a distinction between Live Office in Excel and Live Office in PowerPoint. This distinction reflects the nature of the two different applications as opposed to Live Office itself. It is more likely that higher-level information, report parts, and charts will have a more appropriate use in PowerPoint, the same way long lists of values are appropriate for Excel.
Using BusinessObjects Live Office in Microsoft Word
In the same way Live Office in PowerPoint uses the same menu and right-click functionality as Excel, Live Office in Microsoft Word also uses this standard menu. The use of BusinessObjects Live Office in Microsoft Word can provide enormous value as a productivity tool, but in a slightly different way than an Excel or PowerPoint user might leverage information from a BusinessObjects Enterprise system. Documents that combine highly formatted text, such as an annual report, require a top-of-the-line word processing tool. However, those documents often require a number of charts, tables, and other substantive information housed in an enterprise reporting system. Whether it is a financial document or a form letter, the BusinessObjects Live Office add-in simplifies repetitive tasks and provides extreme accuracy when generating documents.
The ability to place views into a Word document as illustrated in Figure 21.27 might seem to be of trivial value at first glance. In some cases, however, this could be the difference between meeting a deadline or not. Consider a smaller company with limited staff and no marketing department, per se. Each month the company needs to create and print out a hundred or so special flyers to be including in the monthly mailing to top customers. The flyers advertise special promotions for the upcoming month. Other than the promotions, the flyer stays relatively unchanged each month. Creating a Word document with Live Office views now changes a rather time-consuming task into a matter of opening a document and printing it. Over the course of one year, the time saved on this one monthly task could be as much as one full work week.
Figure 21.27. Live Office in Microsoft Word connecting to a report, a Business View, and a universe.

Summary
Business Intelligence systems are both centralized pillars of corporate information and a multitude of access methods to that information. In some cases, a browser displaying a report is sufficient. Other times, the users need to alter or create their own reports, but remain within a browser-based environment. And yet other times, that information needs to be taken on the road and shown at a conference, mailed to a partner, or analyzed in a powerful spreadsheet environment. With the combination of BusinessObjects Enterprise XI as a centralized source and Crystal Reports Explorer and BusinessObjects Live Office as interfaces to this common repository, a corporation can find countless ways to expand the scope of the usefulness of corporate information.