
Chapter 6 Fundamentals of Report Formatting
Positioning and Sizing Report Objects 158
Modifying Object Properties for Formatting Purposes 164
Exploring the Format Editor Dialog Common Options 168
Combining and Layering Report Objects 172
Configuring Report Page and Margin Properties 176
Crystal Reports in the Real World—Exporting Options 178
Crystal Reports in the Real World—Referencing External Resources 178
Introduction
To this point, the majority of material you’ve seen in this book focused on the various functions of the Crystal Reports design application. Equally important, however, is the form (or format) of the report—especially when a report is used as a corporate or industry-standard document that projects a company’s image externally (such as an income statement or balance sheet). This chapter focuses on form over function and discusses a myriad of formatting techniques.
You have already reviewed the Crystal Reports XI development environment and learned about creating a report from a blank canvas, as well as how to select, group, filter, sort, and summarize your report data. Now, you move on to the cosmetic aspects of report design. Working with report formatting and object properties to create professionally designed reports is very straightforward, but does require familiarity with various features of the design-application environment. This chapter reviews the most commonly used object formatting techniques—fonts, borders, page and margin properties, and object layering—and also provides a tutorial to apply these techniques to one of the sample reports created earlier in the book.
This chapter covers the following topics:
- Positioning and sizing report objects
- Modifying object properties for formatting purposes
- Combining and layering report objects
- Configuring report page and margin properties
Positioning and Sizing Report Objects
After you have completed your functional report design tasks—connecting to the data source, adding report objects, and structuring the report—the next step in the report design process is to format the various objects on a report. As demonstrated in Chapter 1, “Creating and Designing Basic Reports,” objects can be added to a report via a variety of methods—dragging and dropping objects from the design explorers, or selecting objects from toolbar and menu commands and placing them in the desired locations—for quick and intuitive report creation. Upon successfully adding objects to your report, each of the respective objects can be positioned, sized, and formatted for display purposes, as demonstrated in the following exercise.
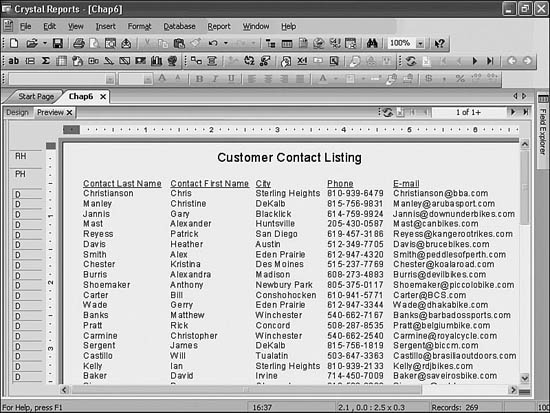
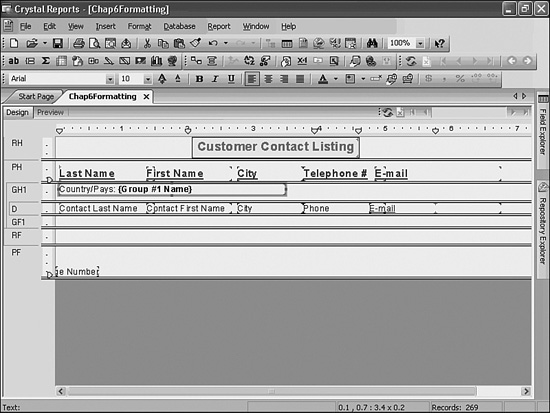
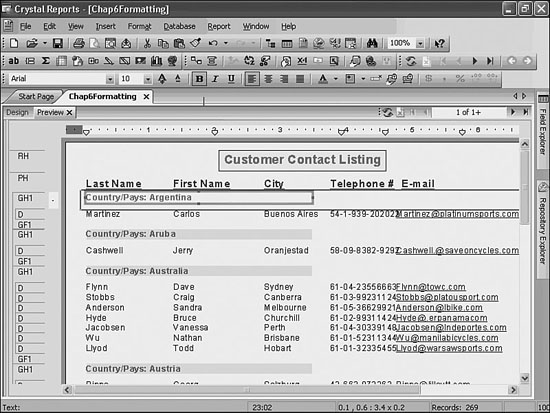
As a visual example of the difference that report formatting efforts can make, compare the presentation value of the report samples shown in Figures 6.1 and 6.2. These two reports accomplish the same functional tasks, but the report in Figure 6.2 is much more visually appealing.
Figure 6.1 A customer contact listing report with little to no formatting applied.

Figure 6.2 A customer contact listing report with a moderate amount of formatting applied.
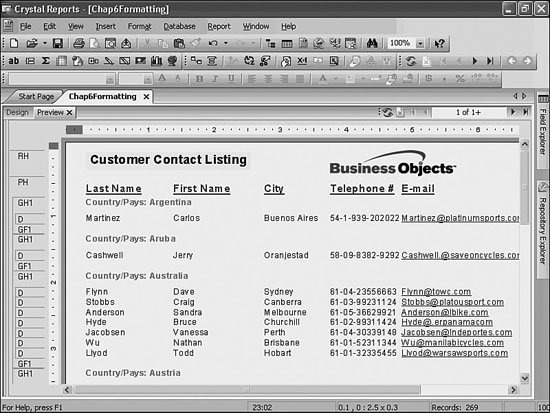
You will spend the remainder of this chapter reproducing many of the visual transformations from Figure 6.1 to Figure 6.2. By completing the following exercises, you create a Customer Contact Listing report using a variety of applied formatting techniques, such as adding a group definition to logically structure customers into their respective countries, and formatting the font styles of the report title, column titles, country description, and e-mail address fields to make for a more precise presentation of the report information. By combining the Country database field with a text field, you also provide for a bilingual display of the country description.
To begin designing your report, follow these steps to create your own nicely formatted Customer Contact Listing report:
- Open the Crystal Reports application and choose to Create a New Report Using the Blank Report Layout from the start page.
- From the Database Explorer dialog accessed from the main Database menu, expand the Create a New Connection list, and then expand the ODBC (RDO) node to present the ODBC dialog window that lists the available data sources. Select the Xtreme Sample Database 11 from the list of data sources and click Finish to continue to the Database Expert dialog.
- From the Database Expert dialog, use the arrow (>) button to add the Customer table to the Selected Tables list on the right. Click OK to continue.
- From the View menu, select the Field Explorer command to open the Field Explorer dialog.
- From the Field Explorer, click and drag the Contact Last Name field onto the report’s design view and place it to the far left of the Details section area, as shown in Figure 6.3.
Figure 6.3 Add the Contact Last Name field to the Details section of the report.
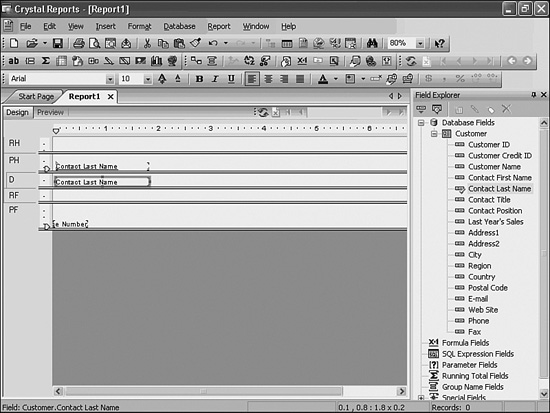
- Follow the previous step to add the Contact First Name, City, and E-mail fields to the Details section of the report, as shown in Figure 6.4.
Figure 6.4 The selected fields displayed within the respective sections of the report and a hidden Field Explorer dialog.
- From the Insert menu, select Text Object and drop the object into the middle of the Report Header section and type Customer Contact Listing in the text field. Click anywhere outside the text object to remove the cursor focus from the text object and now increase the size of this field to size 14 by changing the font size through the Formatting toolbar.
Now that the report includes the field and text objects identified previously, focus on positioning and resizing these fields for display purposes.
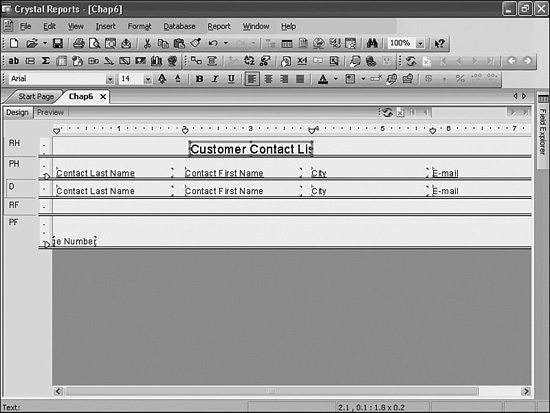
- As Figure 6.4 shows, now you might not be able to see the entire text entered into the report title text object because it is not wide enough to display the text entry by default. To resolve this, click once on the report title text object located in the Report Header section so that it becomes highlighted. Using the dark blue handles that encompass the object’s perimeter, float over the handle located on the right side of the text object with the mouse pointer; then click and hold the mouse button while dragging the handle farther to the right to widen the text object’s display area. Refer to Figure 6.5 to see the result of this action.
Figure 6.5 The sample report preview displays five database field objects in the Details section, five database field column header text fields in the Page Header, and one text object in the Report Header section.
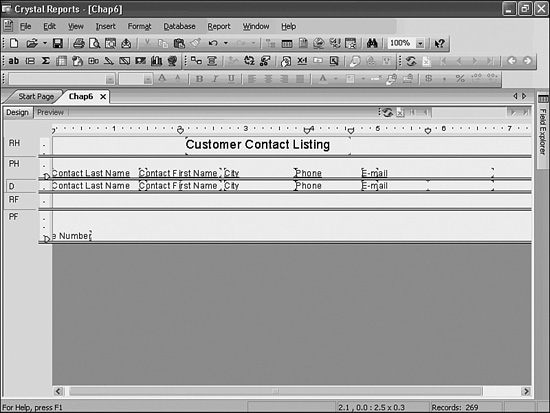
- Now that you have widened the display area of your report title object using the concept of object handles, repeat this same step to modify the width of the field objects within the Details report section so that you can insert one additional object into the Details section of your report between the City and E-mail fields. To facilitate this resizing, you can view the report through the Preview tab and dynamically see the effect of your resizing on the resultant data and the report’s appearance.
- Using the Field Explorer, insert the Phone database field from the Customer table into the Details section of your report. Based on the previous steps, practice positioning and sizing the objects in the Details section to accommodate for all the database fields, as shown in Figure 6.5.
Although many formatting activities can be exercised on field objects in both the design and preview tabs, some formatting facilities are only available within the Design tab. One useful feature to take note of is the capability to move a highlighted field (or even a set of fields) and its associated column title with the arrow keys on your keypad. This technique is a great help when you’re moving report fields around as you did in step 9.
As you might have noticed, the field sizes are often large enough to show the entire field name in the Design view of the report. But from the Preview tab view of the report, you see that fields (such as the E-mail or Phone fields here) are cut off from the display area. This is not unusual, and it might require you to resize the field objects to ensure that they are appropriate for the report display area. It is often useful to use the report’s Preview tab as the active window when finalizing the formatting and layout of your reports.
- Now click the Preview tab to see a preview display of what the report actually looks like, as shown in Figure 6.6.
Figure 6.6 To preview your report, either select the Preview tab or click the Refresh button.
If the Preview tab is not displayed in the application, you have not yet run the report against the database. To run the report, click the Refresh toolbar icon to execute the report to run—the Refresh toolbar icon is represented by the two blue arrows indicating a counter-clockwise rotation.
Although it’s important to understand the basics of report formatting, you will not necessarily have to go through the often arduous process of formatting reports every time. Report templates can be used to apply predefined and meaningful formatting characteristics in a very quick manner. Additionally, object formatting can be copied from existing objects to other unformatted objects through use of the Format Painter introduced in version 10. The Format Painter is accessed through the right-click menu of any object whose format you wish to copy.
![]() For more details on designing and using report templates, see “Creating Useful Report Templates,” p. 324
For more details on designing and using report templates, see “Creating Useful Report Templates,” p. 324
Modifying Object Properties for Formatting Purposes
Now that the foundation of our report is complete, it is time to focus on how to improve the form and aesthetic appearance of the report.
By modifying various object properties, the presentation value of the report can be greatly improved. In doing so, you will be using the Format Editor to access a variety of specific properties, such as fonts, borders, colors, and alignment. The Format Editor is a commonly used dialog to quickly and easily modify all report objects, and its contents are reflective of the specific object type being formatted (text, chart, database field, and so on). To explore these formatting capabilities, follow these steps:
- Continuing with the report from the chapter’s earlier exercise, return to the Design tab of your report and right-click on the report title text object (located in the Report Header section) and select the Format Text option from the list, as shown in Figure 6.7. This opens the Format Editor dialog.
Figure 6.7 The Format Editor dialog is accessed from the right-click pop-up menu on most Crystal Reports objects.

- The Format Editor dialog (displayed in Figure 6.8) enables you to set and adjust a variety of properties of the object. For this exercise, navigate to the Font tab of the Format Editor and select the Bold font style, a font size of 14, and a font color of Red. Also, select the Paragraph tab of the Format Editor and choose Centered from the Horizontal Alignment drop-down list.
Figure 6.8 The Format Editor dialog provides quick and easy access to a variety of report object properties.

- Now select the Border tab from within the Format Editor and then select Single from each of the four border Line Style drop-down lists (left, right, top, and bottom). Under Color, click the Background check box and select Yellow from the drop-down list as the background color. Based on all of your selected properties in the Format Editor, you should now see a representative example of the text object in the Sample area at the bottom of the dialog box. Click OK to save these settings and return to the Design tab on your report.
- To improve the effectiveness of your report, you can modify the database field column titles to provide more meaningful descriptions for the business users of your report. Working within the Design tab of your report, double-click on the Phone title object in the Page Header section of the report. When the cursor’s focus is on this object, you can delete, append, or update the text as you choose. Modify this text to read
Telephone #and then click anywhere outside the object to remove the cursor’s focus from the object.As an alternative to the Format Editor, you can also use the toolbars and menu commands to quickly apply common formatting techniques, such as font and alignment characteristics.
- From the View menu, select Toolbars to present the Toolbar dialog. Make sure that the Standard, Formatting, and Insert toolbar items are all selected and click OK.
- Click on the Preview tab to see a preview display of what the report will actually look like. Again, if the Preview tab is not displayed in the application, click the Refresh toolbar button to execute the report. From the Preview mode, hold down either the Shift or Ctrl key on your keyboard and click each of the five column titles so that they are all highlighted with a dashed perimeter. With all five columns title fields highlighted, click the Bold toolbar button, represented with a large bold letter B on the formatting toolbar. Refer to Figure 6.9 to see the results of this action.
Figure 6.9 Common formatting properties can be quickly specified via the formatting toolbar commands (such as font styles, font size, colors, borders, and so on).

- With the five column title fields still highlighted, click the downward arrow located on the Font Color toolbar button, represented with an underlined letter A on the formatting toolbar. Select the bright blue color from the available list, as shown in Figure 6.9. Lastly, remove the contact prefix for the name fields and increase the size of these column titles to font size 12 with either the font size drop-down box or the A+ increase font size button. The fields might need to be stretched vertically to fit the new font size but can eventually be made to look like Figure 6.9.
To make the E-mail field appear more meaningful to the business users of the report, let’s format the E-mail database field values to resemble and behave like standard hyperlink text.
- To remove the cursor focus from the five column titles fields, click anywhere outside these field areas or press the Esc (escape) key on your keyboard.
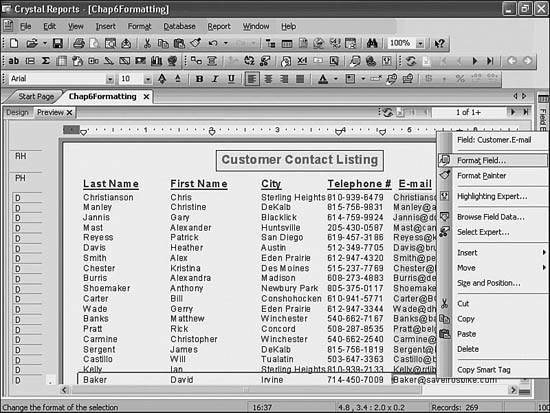
- In the Preview tab, click any of the actual E-mail field values to highlight the E-mail database field objects and right-click on the same object to present the pop-up menu. From the pop-up menu, shown in Figure 6.10, select the Format Field item.
Figure 6.10 Right-clicking on any field object presents you with a list of commands for that particular object.
- Select the Hyperlink tab after you have opened the Format Editor. From the available Hyperlink Types, select Current E-mail Field Value—this option automatically creates a hyperlink based on the values stored within this field in the data source assuming that these values are formatted as proper e-mail addresses in the data source, such as [email protected].
You can use the Hyperlink tab within the Format Editor to create hyperlinks to a website, e-mail address, file, or another Crystal Report. A hyperlink is saved with your report and is available to other users as a way of linking to additional external information from your report. Hyperlink definitions can also be defined by formulas thus enabling context-sensitive, data-driven hyperlinks—a very powerful feature of Crystal Reports.
- Now let’s make the E-mail field appear as a standard hyperlink value, commonly known to have a blue underlined font style. Select the Font tab within the Format Editor dialog to apply the blue font color and select the Underline check box. Click OK to return to the report preview, and then press Esc to remove the cursor focus from all report objects.
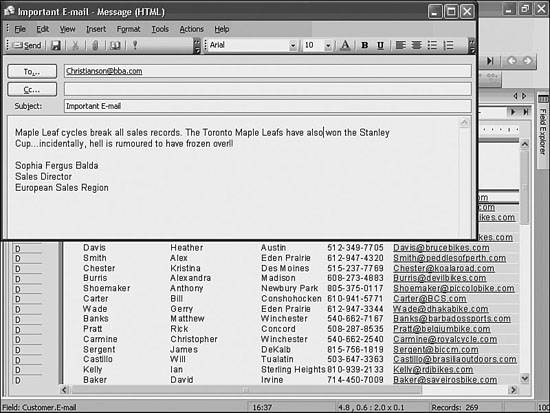
- Based on the completion of the previous step, your mouse pointer should now change into a hand icon as it floats over any of the E-mail field values on the report. This indicates that upon clicking on any of the E-mail values, you initiate an e-mail message to be sent to that address, as shown in Figure 6.11.
Figure 6.11 By applying an e-mail hyperlink, report end users can initiate a context-sensitive e-mail to any of the respective customer contacts.
By using the Format Editor, as well as the Toolbar commands, to modify report object properties, you have very quickly and easily enhanced your report’s presentation quality. Not only did you enhance this report example visually, but you also easily incorporated hyperlink functionality to add an additional level of interactivity to your report.
For more information on using hyperlink functionality in reports, see Chapter 9, “Custom Formatting Techniques.”
Exploring the Format Editor Dialog Common Options
The previous exercises introduced the Format Editor—the dialog where the appearance of report fields and other report objects can be manipulated. Different Crystal Reports objects present different tabs within the Format Editor and each provides specific editing functionality for the underlying object types (such as Date and Time, Boolean, Hyperlink, and so on). The next few sections introduce the most commonly used tabs and underlying formatting options.
The Common Tab of the Format Editor
The Common tab of the Format Editor provides basic functionality for the majority of Crystal Reports’ objects. The most commonly used formatting features accessed through this tab include the following:
- Object Name—Assigned by default, this name is referenced primarily for use with Report Part Viewing (that is, when specifying which report parts to view in a report parts viewer).
- ToolTip Text—Enables a text bubble to be displayed as the end user hovers over report fields. A common and powerful use of ToolTips is to provide the end users with a database-driven description of the involved field from an associated meta-data table. To see this functionality in Design and Preview tabs, the ToolTips option must be turned on under the Layout tab of the Options dialog, accessed under the File menu.
- Read Only—This option makes the selected report object read-only so that it can’t be formatted. When this option is selected, all other choices in the Format Editor except Repeat on Horizontal Pages and Lock Position and Size become inactive.
- Lock Position and Size—This option locks the position of the selected report object so that it can’t be moved or resized.
- Suppress—Enables the suppression of the selected object in the Preview tab and on any report printing. This option is often used with intermediary formula components that the end user is not intended to view or on fields that the user is meant to view only conditionally. The x+2 button is used to suppress (or display) the selected field based on certain data conditions being met (for example, show “ALERT” text object only if Shipping Date is five or more days after Order Date for a specified field).
- Suppress If Duplicated—This option enables the suppression of repeated field names in a report.
- Can Grow—Enables for variable length fields to grow vertically in the report and word wrap automatically. A maximum number of lines can be set with this option to control rogue or large data elements.
- Text Rotation—Enables the rotated display of the involved object by 90° or 270°. This feature is highlighted in Chapter 9.
- Horizontal Alignment—Provides the capability to align the data within an object either left, center, right, or both justified.
- Display String—This Custom String functionality enables the conditional formatting and display of field types (for example, number, currency, date, time, date and time, Boolean, string, running total, formulas, parameters, and so on) as a custom string (for example, displaying the number 1,500,000 as the custom string 1.5M). The following sample formula snippet highlights how this would work:

- CSS Class Name—Provides the capability for Crystal Reports to leverage existing CSS stylesheet classes when deployed in a web application or with BusinessObjects Enterprise.
- Repeat on Horizontal Pages—Introduced in version 10, this option enables the repetition of a report object that does not expand horizontally (such as text objects, field objects, OLE objects, charts, maps, lines, boxes, and so on) for each additional horizontal page that a cross-tab or OLAP grid might create as it expands horizontally.
- Keep Object Together—This option keeps an object on a single page. If there is enough room, the program prints the object on the current page. If there is not enough room, the program prints the object on the next page. This is clearly not possible with objects that span more than a single page.
- Close Border on Page Break—This functionality ensures that borders created on the object close at the bottom of any page and begin again as the object is continued on the next page. This provides for a much slicker-looking border format for your reports.
The Border Tab of the Format Editor
The Border tab of the Format Editor provides border, background, and drop-shadow formatting functionality for Crystal Report objects. The most commonly used formatting features accessed through this tab include the following:
- Line Style drop-down boxes—The Left, Right, Top, and Bottom drop-down boxes enable specification of the different types of supported borders (Single, Double, Dashed, or Dotted). For Basic borders, this functionality is more easily accessed through the Borders button on the Formatting toolbar.
- Tight Horizontal—This option specifies that a border tightly wraps around the involved object’s contents and not the entire field as placed on the report (that is, no spaces are included within the border).
- Drop Shadow—This format prints a drop shadow to the right and below the specified object.
- Border Color—The color of the border and drop shadow is specified here through the drop-down box.
- Background Color—The background check box enables you to specify that a background be displayed for the given field. An additional drop-down box enables you to select the color for the background after the check box has been selected.
The Font Tab of the Format Editor
The Font tab of the Format Editor provides the capability to change the fonts, font size, and font style for text and data fields in your Crystal Reports. The most commonly used formatting features accessed through this tab include the following:
- Font, Style, Size, and Color—Enable the designer to specify a variety of available formatting fonts (such as Arial, Courier, Verdana, Times Roman, and so on), styles (such as Bold and Italics), sizes including manually entered 1/2 sizes and colors.
- Strikeout and Underline—Enable you to specify the selected formatting on the current report object.
- Character Spacing Exactly—Use this option to specify the space that each character in the selected font occupies. The value is defined as the distance in number of points measured from the start of one character to the start of the next. When the character spacing is edited, only the spacing between adjacent characters is changed—not the actual font size of the characters. Using 0 enables the default font character spacing.
The Hyperlink Tab of the Format Editor
The Hyperlink tab is used to create hyperlinks to external websites, e-mail addresses, files, or other reports and report objects from report objects within the current report. These hyperlinks can be data-driven (that is, change on the data coming back from the database) and provide a rather intuitive method for integrating Crystal Reports into a business workflow. The helpful hint section of this tab provides in-place coaching for each type of hyperlink that is to be used. The most commonly used formatting features accessed through this tab include the following:
- Website on the Internet—Enables the specification of an external website with or without dynamic context-sensitive components of the URL driven from the database. An example of a context sensitive web address would be
http://www.google.com/search?q= + {Customer.Customer Name}where the link would take the end user to a Google search page full of results based on the current value of the customer name. - E-mail address—Enables you to add a link to an e-mail address that would need to be typed into the E-mail address text box or through the associated formula editor x+2 button.
- File—Enables the linked upon object to call a specified file and launch its associated application upon end-user activation of this link. Report designers can specify EXE files with command-line parameters through the Formula Editor accessed by the x+2 button.
- Current Website or E-mail Field Value—Creates a website or e-mail link to the underlying object on which the hyperlink is being created. The formatting of the data for the involved field must be correct (that is, a proper e-mail address or website URL).
- Report Part Drilldown—The Report Part Drilldown option lets you define a hyperlink so that the Report Part Viewer can emulate the drill-down functionality of Crystal Reports. The Report Part Viewer displays only destination objects; therefore, to make drill down work, you need to define a navigation path from a home object to one or more destination objects, all residing in the same report section. Initial Report Part specification for a given Crystal Report is set within the Report Options dialog accessed from the main File menu. The drill-down path is then set for each Report Part in the navigation path through this option. Not all Crystal Reports objects have this option available based on their report section location and their type of object.
- Another Report Object—This option enables the definition of a hyperlink to objects in the same or different reports. When defining a hyperlink path to a different report, that report must be managed in a BusinessObjects Enterprise environment. To specify report objects, they must be copied using the right-click Copy command from their source report and then pasted into the current object’s Hyperlink tab using the Paste Link button.
Other Format Editor Tabs
The remaining tabs found in the Format Editor are dependent on the type of object selected in the involved Crystal Report. The other tabs that you find and some of the most common formatting options provided in each are as follows:
- Paragraph tab—Enables you to specify formatting for string/text fields including spacing, reading order, and horizontal alignment.
- Numbers tab—Enables detailed formatting on numbers and currency objects including the handling of zeros, decimal point specification, negative number formatting, rounding, and thousands separator specification. The Customize button enables access to the majority of these formatting features.
- Date and Time tab—Provides detailed formatting on dates, times, and
datetimeobjects. Many default display options are available with a great deal of granularity provided through the Customize button. - Boolean tab—Enables the selection of the format for the return values of Boolean field objects.
- Box, Line, Rounding, Subreport, and Picture tabs—Provide for granular level formatting of each of the involved Crystal Reports objects.
Combining and Layering Report Objects
The concepts of combining and layering report objects becomes relevant when you need to precisely control the relationship between two or more objects occupying a common space on the report. For example, assume that rather than having your country field read USA, you would like to combine the Country database field with a text object so that it reads Country/Pays: USA—displaying the textual description for country in both English and French. To accomplish this, you can easily combine a text and a database field into one common report object.
The previous exercises can be enhanced by adding a more descriptive text object to your report as that described earlier. To complete this, start by adding a group definition to your report. The group definition enables you to logically present each customer within the country in which they are located. To add this grouping, perform the following steps:
- From the Insert menu, select Group to present the Insert Group dialog. Select the Country field (located under the Customer table) from the uppermost drop-down list. Leave the sort order as Ascending and click OK to return to the report.
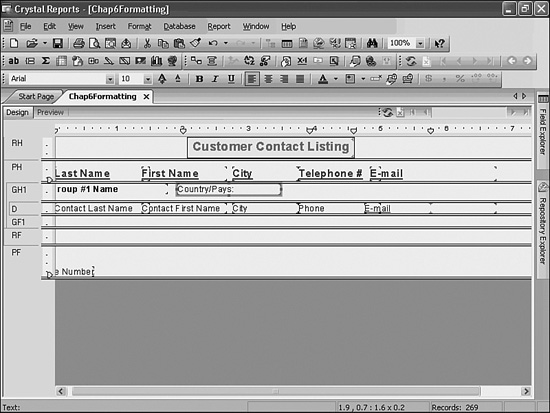
- Verify that you are working in the Design view of the report—click on the Design tab if necessary. You should now see two new sections listed in the left column area of the design environment—Group Header #1 and Group Footer #1. From the Insert menu, select Text Object and drop the object to the right of the Group #1 Name field in the Group Header section. Type Country/Pays: for the textual content of this new object (including a space after the colon), as shown in Figure 6.12.
Figure 6.12 The Insert menu enables you to quickly add a group and text object into your report. The resultant group and text object are shown here in the Report Designer.
- Highlight the Group #1 Name field object, click and drag it over the new text object field (you can drag the entire object after the mouse pointer has turned into a four-way cross icon), and drop it onto the text object when the flashing vertical cursor indicates that it falls precisely to the right of the textual description you have entered.
Dragging and dropping objects to combine them is a very precise maneuver and might require some practice. If you have dropped the Group Name field in the wrong place, click the Undo button (curved arrow pointing backward) and try again until you are comfortable and successful with this technique.
- After you have successfully combined these objects together, the design application still references the newly combined object as a Text object. You now need to widen the object’s display area. Click this object to highlight it and drag the left-side perimeter handle farther to the left until you reach the left margin of the design area, as shown in Figure 6.13.
Figure 6.13 You have now combined a database field object with a text object to form one common report object.
- With the combined text object highlighted, use the steps identified earlier in this chapter to modify the object’s properties to present the field values in a bold red font style, as shown in Figure 6.14. Click the Preview tab to see how the report results are displayed. (Use the Refresh toolbar button if the Preview tab is not visible.)
Figure 6.14 After combining two or more objects, you can specify formatting properties for the newly combined report object.
- Now add a corporate logo to your report and use this to discuss object layering. You need to have a picture file saved in either bitmap, TIFF, JPEG, or PNG format available for use. Use the Business Objects logo downloaded from its website for this example. Select the Picture menu option from the Insert menu. Navigate to and select the Business Objects Logo image and drag it into the Report Header section. Drop the image into the Report Header section so that its left perimeter is aligned directly above the left perimeter of the Telephone Number column, as shown in Figure 6.15.
Figure 6.15 Drag and drop the Business Objects Logo image object into place in the Report Header section.
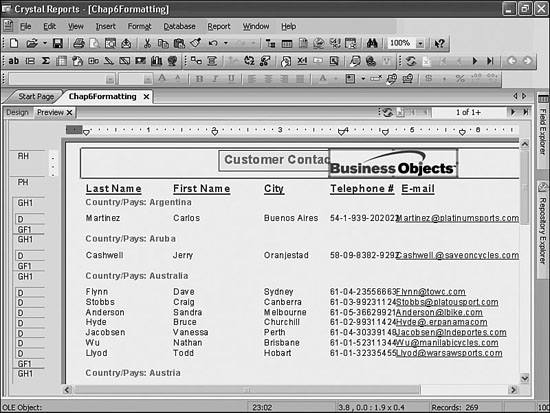
Notice, as illustrated in Figure 6.15, that you have partially covered the report title object with the new logo image. This could have certainly been avoided by placing the image object farther to the right, but for demonstration purposes, use the Move property of the report title field to once again make it visible.
- Right-click the report title text object, select Move, and then select To Front from the additional pop-up options. This positions the report title object on top of the logo image, as you can see in the report preview.
- To resolve the issue of overlapping objects in the Report Header section, adjust the two objects so that the report title is displayed farther to the left of the logo image, as shown in Figure 6.16. Save your report sample if you want.
Figure 6.16 By adjusting the objects located in the Report Header, you have resolved the need to layer these objects; however, layering does provide flexible display options.

- As a final step to re-create the report in Figure 6.2, use the Format Expert dialog to modify the report title text so that it appears in a bold, navy blue, underlined, size 20 Verdana font with no displayed borders.
As a result of these exercises, you now have a very useful report that displays each customer contact record distinctively grouped within the country in which they are located. The formatting that has been applied introduces the capabilities that make Crystal Reports the undisputed champion of professionally formatted reports.
Configuring Report Page and Margin Properties
With Crystal Reports, page margins can either be set to use specific manually set margin definitions or can be selected to automatically adjust to the report margins. To set your report margins to meet exact specifications, follow these steps:
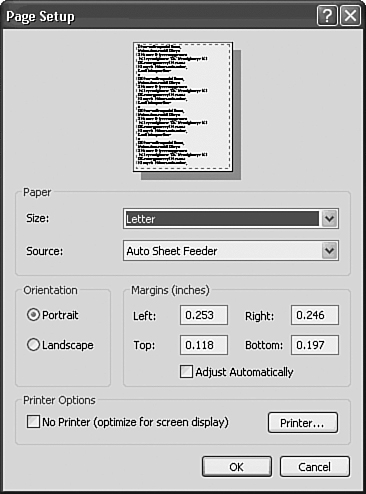
- From the File menu, click Page Setup, and the Page Setup dialog appears as shown in Figure 6.17.
Figure 6.17 The Page Setup dialog is used to specify report margin settings.
- Modify the default page margins for your exact requirements.
- Click OK to save your changes.
Each of the margin settings is calculated from the paper edge. Consequently, a left margin of .25 inches causes the printing of the report page to start exactly one quarter of an inch in from the left edge of the paper.
As an alternative to specifying exact report margins, you can select the Adjust Automatically check box if you want Crystal Reports to adjust the report’s margins automatically when the paper size changes. This option maintains the ratio of the margins to the printable area of the report by enlarging or reducing the left/right and top/bottom margins by the same factor. For example, this setting could ensure that a report designed for a printer that can only print within .5 inches of the paper’s edge would maintain the same overall margin ratio when printed on a printer that could print to within .25 inches of the paper’s edge.
The Page Setup dialog also enables you to select a printer for your report or specify no printer at all for optimized web viewing. Based on the printer selection, you are able to set different page sizes and either portrait or landscape orientation. New to XI, a preview of the selected paper size is shown at the top of the Page Setup dialog.
If you decide to select the Adjust Automatically check box margins options for your reports, there are two common issues to be aware of when printing reports (also described in the Crystal Reports Help files):
- When printing a report in another environment in which the printer’s default margins are greater than the report’s setting, the report objects on the right side of the report print off the page.
- When printing a report in another environment in which the printer’s default margins are smaller (enabling a larger printing area), the entire report moves to the left side of the page.
As a result, it is recommended that you specify your own report margins. It is encouraged that you do not select the Adjust Automatically check box margins option in the Page Setup dialog to avoid these common problems. It is advisable to set your report margins manually using the Page Setup dialog, even if the margins you want to specify are the same as the default margin settings. This issue becomes especially important when you distribute your reports over the Web and have no idea what type of printer the business user will be using.

Troubleshooting
Formatting Phone Numbers
I need phone numbers that are stored in the underlying database as 5554161010 to display as (555)416-1010. Is this easily accomplished?
Yes. The simplest method to accomplish this is through the Display String functionality accessed under the Common tab of the Format Editor. You can access this dialog by right-clicking on the Telephone_Number field in your report and selecting the Format Field option. Once here, click on the x+2 button beside the Display String title (way down near the bottom of the dialog) and enter something like the following to accomplish your goal:
![]()
Or use:
Picture (CurrentFieldValue, "(XXX) XXX-XXXX")
Crystal Reports in the Real World—Exporting Options
To eliminate the need to set and reset commonly used exporting options, the XI version of Crystal Reports now enables the saving of report export configuration information with the report itself. You can preset your preferred export options (examples include exporting Page Headers and Footers only once per report in Excel, or creating page breaks in Excel for each page in the report), and have end users automatically use those options when exporting through their report viewers. This new feature results in rapid report deployment and fewer end-user requirements in the setting of export options.
A new RTF Export format is now available in version XI. This format has been optimized to facilitate easy editing of the generated files. This new feature complements the existing RTF export that is optimized for accuracy and forms processing. The result is that you can now choose from two different RTF export formats, depending on your need for either accuracy or the ability to edit.
Crystal Reports in the Real World—Referencing External Resources
A very powerful use of hyperlinks is to be able to take advantage of the many resources on the Internet. Many Internet sites make use of what is called a query string. By knowing the URL and query string that drive a particular site, a report hyperlink can be customized to open a website and perform some functionality. In the next example, the address of the sample customers can be opened in MapQuest.com by using a hyperlink:
- Start with opening the report
Chap6Formatted.rptor the report you have created in these last exercises. From the Insert menu, choose Text Object. Add the text Map to the report between the customer name and city, as shown in Figure 6.18.Figure 6.18. A new Map field added to the report provides a dynamic hyperlink directly to maps of the client’s locales.

- Right-click the newly added text object and choose Format Text. Click the Hyperlink tab, select the Website on the Internet hyperlink option, and click the x+2 button beside the Website Address input box. Figure 6.19 highlights the formula you will enter to provide a dynamic data-driven link to MapQuest maps showing location maps of the client locales. Enter the following code into the Formula Editor:
StringVar URL;

Figure 6.19 Code that builds a dynamic data-driven URL that will enable hyperlinks to the MapQuest website from a Crystal Report.

- Click Save and Close to close the code window. Click OK to close the Format Editor window. Format the hyperlink using the same method used to format the e-mail address to show the user it is an actionable item.
The sample data does not necessarily use valid addresses but you should find that many of the city, region, and country combinations will in fact be successfully received and processed by MapQuest, as shown in Figure 6.20 for a Toronto-based customer. MapQuest.com might open with only partial information, but the concept remains valid.
Figure 6.20 A MapQuest website that has received a dynamic data-driven request directly from your Crystal Report.
