
Chapter 7 Working with Report Sections
Formatting Report Sections 182
Modifying Report Section Properties 186
Using Multiple Report Sections 195
Crystal Reports in the Real World—Advanced Formatting 201
Introduction
You should now be familiar with some of the most common formatting features within the Crystal Reports XI designer. Building on the concepts and techniques covered in Chapter 6, “Fundamentals of Report Formatting,” for report object formatting, this chapter explains how you can format entire sections within your reports. Just as any report object has specific modifiable properties available for formatting, report sections also have unique properties.
![]() For more information on report formatting, see “Exploring the Format Editor Dialog Common Options,” p. 168.
For more information on report formatting, see “Exploring the Format Editor Dialog Common Options,” p. 168.
In this chapter, these properties are examined and their use in creating effective professionally styled reports is explored.
This chapter covers the following topics:
- Formatting report sections
- Modifying report section properties
- Using multiple report sections
Formatting Report Sections
The earlier chapters introduced the concept of report sections such as the detail section and the group header and footer sections. Report sections segment reports into logical areas that facilitate logical report design. Report sections are identified by name on the left side of the design environment, and, by default, each report includes a Report Header and Footer, Page Header and Footer, and Details section. If you have inserted any groups into your report, you also have a Group Header and Footer for each defined group item. As reports have been created in the previous chapters, objects such as database fields, text fields, and corporate logo images have been placed into the various report sections and organized based on the report design requirements.
Each section has unique display properties and printing characteristics that can be modified. For example, if a report object, such as an image, is placed in the Report Header section, the image displays and prints only once per report, on the first page. If the same image is placed in the Page Header section, the image then displays and prints once for every single page of the report. The same principals hold true for other custom sections, such as Group Headers and Footers. Finally, the Detail section implies that whatever is placed in this section displays, and prints, once for each and every row retrieved from the data source.
The Crystal Reports design environment is built on a paper metaphor with pages the driving concept in structuring the presentation of report information. This page metaphor applies when referencing report printing and with respect to various presentation characteristics of report formatting.
Using the report created in Chapter 6, you will take a closer look at how to format report sections. The following exercises demonstrate how to format sections such as the Group Header and Group Footer to improve the overall presentation of a Crystal Report. In addition to modifying display properties, conditional logic is also applied that modifies the behavior of the Page Header section based on the result of the defined condition (format formula). The Section Expert is the central location for working with all report section properties, and it is used to view and modify the properties of each report section throughout the following exercises.
As you might have noticed, long names (descriptive names) of each section are provided to the left of the design environment within the Design tab, whereas only the short names (abbreviated names) of sections are presented while viewing reports from the Preview tab. This maximizes the report viewing space while working in the Preview tab. The long names can, however, be accessed by either hovering the mouse cursor over the section or by right-clicking on the section name (or label).
There are three distinct ways to access the Section Expert; these include
- Right-clicking on the name of the section you want to work with and selecting Section Expert from the pop-up menu.
- Clicking on the Section Expert toolbar button located on the Expert Tools toolbar.
- Selecting the Format menu and choosing Report, Section Expert.
To start the hands-on learning, follow these steps:
- Open the report you created in Chapter 6. Alternatively, open the report entitled Ch07start.rpt (available for download at www.usingcrystal.com or by searching for the book’s ISBN—0-7897-3417-6—at Que Publishing’s website, www.quepublishing.com).
- Open the Section Expert. From either the Design or Preview mode, right-click on the Group Header #1 section and select Section Expert from the pop-up menu. This presents the Section Expert dialog displayed in Figure 7.4.
- Now apply a background color to your Group Header #1 report section so the report consumers can quickly distinguish between country sections and determine which customer contacts belong to each country. In the Section Expert, select the Group Header #1 item from the Sections list on the left, and then click on the Color tab on the right. Click on the Background Color check box so that it is activated and select Navy from the drop-down list of color options. Click OK to continue.
From within the Section Expert, you can easily navigate from modifying the properties of one report section to another without closing this dialog window. Regardless of how you open the Section Expert dialog window, you can quickly toggle to other report sections, providing a central location to access and modify the properties of all report sections.
- Select the Preview tab to view your report display.
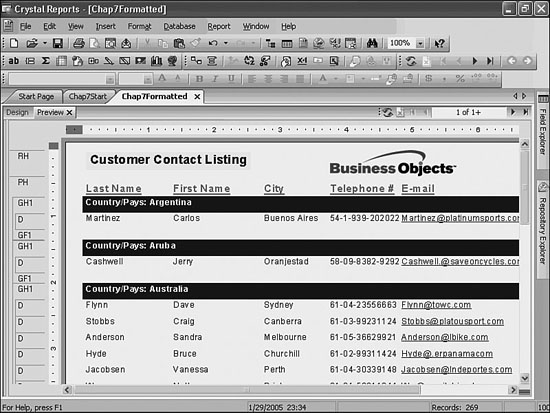
- The Red font used for the object in the Group Header #1 does not look good against the Navy background color. To resolve this, highlight the text object—actually a combined object consisting of a text object and a database field object—and change its font color to White, as shown in Figure 7.1.
Figure 7.1 Formatting a report section can make reports more readable and friendly to end users.
- To complement the current report grouping on the Country field, add a summary count of the contacts for each country in the Group Footer #1 section. To do this, select Summary from the Insert menu to present the Insert Summary dialog and select the following items:
• Customer.Contact Last Name field from the Choose the Field to Summarize drop-down list
• Count from the Calculate This Summary drop-down list
• Group #1: Customer.Country from the Summary Location drop-down list
To access the Insert Summary dialog so that you can add a summary field to your report, you can use the Summary command from the main Insert menu, you can use the Insert Summary button located on the Insert toolbar, or you can simply right-click on any report field already in the report and access the Insert Summary menu option from the right-click menu. This last option pre-populates the Choose the Field to Summarize drop-down box and saves you one needless step.
- After you have made these selections from the Insert Summary dialog, click OK to continue.
- You should now see the Count Summary field listed in the Group Footer #1 section of your report. To align the field values to the left and make them noticeable, use the Align Left and Font buttons located on the Formatting toolbar to apply the desired alignment and a Red font color.
- Now add additional report section formatting to the Group Footer #1 section. From the Report menu, select the Section Expert command to present the Section Expert dialog. From the Sections list on the left, select Group Footer #1 and then select the Color tab on the right. Specify a Silver background color for this section and click OK to return to the report preview, shown in Figure 7.2.
Figure 7.2 Section formatting can be applied specifically to the various sections of your report for a more meaningful report presentation.

- As a final step, change the font color of the database field column titles. From either the Design or Preview view, right-click on the Page Header section title and choose Select All Section Objects from the pop-up menu. After all the column title objects are highlighted, select Teal from the formatting toolbar Font Color button.
As you have seen, formatting the various sections of your report is very straightforward. Each section has unique and specific properties that can be modified and used collectively to enhance the presentation quality of the entire report.
To quickly remove blank space within report sections and tighten up the alignment of the objects positioned within the sections, you can use the Fit Section command. The Fit Section command is available from the right-click menu of each report section. This raises the bottom boundary line and reduces unnecessary space within the section.
Modifying Report Section Properties
In addition to formatting properties, each section has a variety of general properties that can be used to manipulate the behavior of that section within the overall report. For example, if you would like to suppress a particular section from the report display or just hide a detail-oriented section from the initial display but enable business users to navigate to the underlying details, you can use the Section Expert to accomplish this.
Using the report you created in the previous exercise, relocate the Count summary field into the Group Header and hide the Details section to enable the viewer of the report to access this section only if he double-clicks on the Group Header summary values—commonly known as drilling-down on report data. The following steps guide you through formatting several fields and sections, creating a drill-down report:
- Highlight the Summary field currently located in the Group Footer #1 section (Count of Contact Last Name) and drag it up in the Group Header #1 section so that it is positioned to the right of the Country/Pays field, approximately under the Telephone # column title. The results are shown in Figure 7.3.
Figure 7.3 Report objects can be repositioned into the various report sections to change the presentation of the report.

- While the Summary count field is still highlighted, modify the font properties so that it is underlined and in a bold yellow color.
- Using what you have learned from the previous exercises, remove the background color of the Group Footer #1 section—the background color property can be located on the Color tab of the Section Expert. Figure 7.3 shows what your report should now look like.
- To display the listing of customer contacts for each country on a separate and unique page, open the Section Expert and select Group Footer #1 from the section list on the left. As Figure 7.4 shows, the Common tab within the Section Expert provides access to a variety of properties unique to the section that you have selected from the list on the left. In this case, check the box next to the New Page After item and click OK to continue.
Figure 7.4 The Section Expert provides access to a variety of section formatting properties, as well as enabling the specification of what happens before and after each section is printed.

Common report section commands—such as Hide, Suppress, Delete, Hide Section Names, and Select All Section Objects—are accessible via the pop-up menu when you right-click on the applicable section’s name. Some of these commands are also available within the Section Expert dialog, although unlike the Section Expert, the right-click pop-up menu pertains only to the specific section you have selected.
- Looking at the preview of your report, you should now see each country’s list of contacts on a separate page. Although this might be desirable for those countries with a considerable number of contacts, such as Canada, France, and the United States in this report, it is not necessarily the most visually pleasing presentation for the countries that have only one or two customer contacts. A potential solution here is to conditionally create a New Page After the Group Footer section only when a country has a significant number of contacts. This is accomplished using a formula entered by accessing the x+2 button adjacent to the New Page After title and check box. A simple solution might include adding the following formula:
Count ({Customer.Contact Last Name}, {Customer.Country}) > 5
This formula is evaluated for every Group Footer (for every country) and will only cause a New Page After the involved Group Footer when the current country has more than five contact names.
Exploring the end users behind this hypothetical example a bit more, it is likely that the majority of the business users for this report are primarily interested in the total number of contacts for each country rather than the actual list itself. However, a few of the business users also want to be able to access the complete contact list on occasion. To accommodate both groups of users, you can manipulate the properties of the Details section.
Drill-down functionality is designed to make report viewing easier. You can hide the details of your report and only have the group headers and summaries visible, and, when necessary, the business users of the report can then click on the group header or summary fields to view the report details.
- Disable the New Page After property that was set for the Group Footer #1 section. The Section Expert can be used to remove this setting. Click OK to continue.
- From either the Design or Preview view of your report, right-click on the Details section title to the far left of the application area and select Hide (Drill-Down OK) from the pop-up menu.
To indicate to the business user of the report that more detailed information is available behind the summary group level, the mouse pointer turns into a magnifying glass icon when it floats over a drillable section (for example, the yellow count field of customer contacts, located in the Group Header #1 section).
As shown in Figure 7.5, a list of each country with the total number of contacts displayed has now been created. Additionally, upon double-clicking the count of contacts (displayed with the underlined, yellow number) the business user of the report is quickly able to drill-down into the Details section and be presented with the actual customer contact specifications.
Figure 7.5 A manager now is presented with a summary list of customer contacts by country and is also able to access the customer contact details through a drill-down.

As you can see in Figure 7.6, after the business user drills down into a particular group’s detail listing (France in this example), that group’s detailed contact list is displayed in the Crystal Reports application in a separate tab and is cached so that it can be easily accessed for future reference. When a business user of the report selects a refresh on the report, all cached tabs are removed because there is no guarantee that the data being retrieved from the database would be the same as the previously cached page. The end user would have to drill back down into France if he wanted to view the detailed contact listing again.
Figure 7.6 The detailed list of customer contacts for England.

The Section Expert Settings and Functionality
As discussed to this point in the chapter, the Section Expert provides a great deal of powerful report formatting functionality and flexibility. There are two major areas to the Section Expert as shown in Figure 7.4—the Sections area and the Formatting tabs (Common, Color, and Layout). This section presents each of these sections and their associated functionality.
The Sections Area
The Sections area is composed of a listing of all the current report’s sections and five separate buttons—Insert, Delete, Merge and the up and down arrows. The Sections area takes up the entire left half of the Sections Expert dialog and enables you to create, delete, merge, and reorder entire sections within the involved report. The following list describes each of the Section Expert Sections area components:
- Sections—This box provides a list of all the sections in the current report. When a section is highlighted, the program highlights the other Section Expert properties and buttons that you can set, modify, or use for the selected section.
- Insert button—This button enables you to add sections below the currently highlighted section. The newly added section is based on the type that is currently selected. (For example, inserting a section while on the Detail section creates another Detail section called Detail b, the original Detail section is called Detail a, and they both exist under a parent node called Detail.) Different formatting and display properties are made available for each child section in addition to the parent section. Creating multiple detail (or other) sections dramatically increases the flexibility in which you can display information as each independent child section can have unique formatting and display properties applied (for example, Only Show Column Titles in Details a Section Every 10th Row).
- Delete button—Use this button to delete existing highlighted sections from the current report. Note that only inserted children sections (as described previously) can be deleted—not original primary sections.
- Merge button—This button enables you to merge two related children sections (for example, Details a and Details b) into one new section.
- Up and Down Arrow buttons—These buttons enable you to reorder children sections within the currently selected report. It is important to note that the original parent sections cannot be reordered in the Section Expert.
The Common Tab
In addition to the Section Expert options that you have already used, the following segment of the chapter provides an overview of the available settings presented on the Common tab of the Section Expert. A subset or all of these options are made available when a section is selected in the Sections area, as described previously. The following options are made available in the Common tab:
- Free-Form Placement—When enabled, this option places objects within a section in a free-form manner, ignoring all program alignment grids and guidelines. When this option is not selected, objects are placed at fixed points using an underlying grid (see the Layout tab of the Options menu for more details on grid display). This option is generally used in combination with report graphics (such as boxes) whose default display mechanism is free-form.
- Hide (Drill-Down OK)—This option hides the respective section from the report’s initial visual display, but still enables report users to access the section’s content upon end-user drill-down.
- Suppress (No Drill-Down)—Hides the respective section from the report’s visual display and disables any drill-down capabilities such that the section’s content is not available to report users. This is very useful for eliminating the display of sections that contain no data (such as redundant or empty Group Footer sections).
- Print at Bottom of Page—Causes the current section to print at the bottom of the page. This setting is most useful for printing invoices and other reports where you want summary values to appear toward the bottom of the page in a fixed position.
- New Page Before—Inserts a page break before it prints the section. This option is only applicable to the Group Header, Group Footer, and Details sections.
- New Page After—Inserts a page break after it displays and prints the section. For example, you can use this setting in the Group Footer section to print each group on a separate page.
- Reset Page Number After—Resets the page number to one (
1) for the following page after it prints a group total. When this option is used in conjunction with Print at Bottom of Page, a single group prints on a page, the group value is printed at the bottom of the page, and the page number is reset to1for the next page. This option is useful whenever you are printing multiple reports from a single file (such as customer invoices), and you want each report to be numbered beginning with Page 1. - Keep Together—Keeps a particular section together on one page without splitting the section between multiple pages. For example, in a customer list, data on a single customer might extend over several lines. If the standard page break falls within the data for a customer, the data is split—part on one page and the remainder on the next. You can use the Keep Together setting to insert the page break before the record begins so that all the data is printed together on the following page.
- Suppress Blank Section—Hides the report section if it is blank, and only prints it if it is not blank. This is a powerful display control to eliminate unnecessary blank space in reports.
- Underlay Following Sections—Permits the selected section to underlay the following section(s) when it prints, making the current section transparent. This feature is often used for the printing of Watermarks on a report (such as “Internal Use Only,” “Draft,” or a company logo). It is also often used to display data in different sections beside each other (for example, a summary pie chart from the Report Header underplayed to show beside the actual details of the pie chart kept in the Group and Detail sections).
- Format with Multiple Columns—Only available on the Detail section, this option presents the Layout tab (otherwise hidden from view) within the Section Expert and enables you to use multiple columns in the given report. This powerful feature enables the presentation of row data in the detail section as columns in a report. It is particularly useful when presenting summarized information for comparison or a lengthy list. This is discussed later in this chapter.
- Reserve Minimum Page Footer (Page Footer section only)—Reserves space at the bottom of each page for your Page Footer sections (a default setting). This enables you to minimize the space reserved for your Page Footer sections, thus maximizing the space available for other report information on each page. This option only affects a Page Footer area with multiple sections.
- Read-only—Locks the formatting and position of all report objects within the section so that they can’t be formatted or repositioned. The Read-only setting uses password protection to enable the report designer to return to the report to make future changes.
- Relative Positions—Locks the relative position of a report object next to a grid object within a section. For example, if you place a text object one inch to the right of a cross-tab or OLAP grid object, during report generation the program pushes the text object to the right so that the one inch of space is maintained regardless of the width of the cross-tab or OLAP grid object.
The presence of the x+2 buttons to the right of the majority of the options indicates that those options can be set via a formula in addition to setting them via the dialog. When an option is set via formula, this is referred to as conditional formatting because the formula typically evaluates a condition.
To implement a conditional option, click on the x+2 button associated with the option and the Formula Editor is presented. Within the Formula Editor, a formula needs to be created that is evaluated for every iteration of the section. If the formula evaluates to a value of True, the involved option is applied; otherwise, it is not. A simple but practical example of conditional section formatting could be a marketing campaign list where the marketing department wants to contact customers in the USA by phone and everywhere else by mail. Two detail sections could be created, one that includes Contact Name and Phone Number, the other with Contact Name and Mailing address. The first section can be conditionally suppressed on the following formula—{Customer.Country} <> "USA" to only show that section for USA-based customers. The second details section would be conditionally suppressed with {Customer.Country} = "USA" to only show non-U.S.-based customers.
The Color Tab
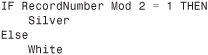
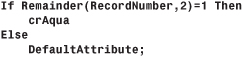
Use the Color tab to set the background color for the entire highlighted section. This can be done absolutely or conditionally. A good example of a conditionally colored background is when presenting a lengthy list of detailed items. To enable easier reading of the report, every second row can be conditionally colored Silver with the following formula:
Listing 7.1. Alternate Row Coloring Formula
The Layout Tab
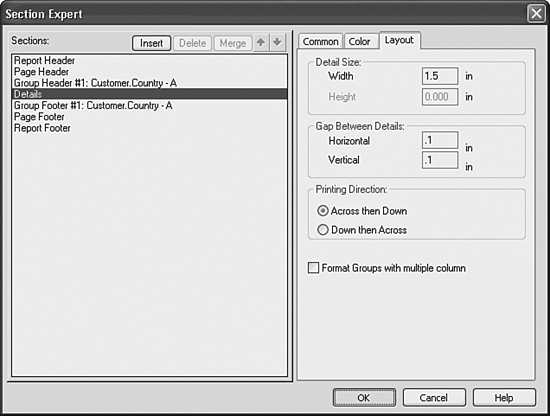
The Layout tab only appears when you have the details section selected and the Format with Multiple Columns check box has been selected on the Common tab. This tab enables multi-column formatting. As described earlier, this kind of report enables you to present multiple columns of standard row data and have the data flow from column to column. This tab, shown in Figure 7.7, has four distinct settings:
Figure 7.7 The Layout tab is only available for advanced multi-column reports.

- Detail Size—This box enables the specification of the dimensions (height and width) of each detail column.
- Gap Between Details—This box enables the specification of the empty area between detail columns and rows. The horizontal gap is the distance between the details going across the page and the vertical gap is the distance between rows going down the page.
- Printing Direction—This option enables the specification of the flow path to be followed when printing the detail column and rows on a report page. The Across then Down option prints details across the columns in one row first before moving onto the next row of data. The Down then Across option prints details down an entire column first before moving onto the next column.
- Format Groups with Multiple Column—This option formats groups with multiple columns using the Width, Gap Between Details, and Printing Directions specified for the selected Detail section.
When you format a report to show multiple columns, the Crystal Reports engine reviews the fields in the detail section and sizes the columns in the rest of the report based on the width of those fields. As such, if data labels (text fields) are placed in the detail section for row identification, these increase the width of the report’s columns and reduce the number of columns that fit onto a page. To place such fields, consider placing them in a Page or Group header and underlaying them onto the Details section.
To begin to truly understand the powerful formatting capabilities of multi-column reporting, it is instructive to edit your current contact list report using this functionality. Figure 7.8 highlights some appropriate layout settings you can set after you have checked the Format with Multi-Columns check box (remember that it’s only available for the Detail section). At this time, do not check the Format Groups with Multiple Columns option but rather simply set the Width and Gap options. You will also need to increase the height of the Details section and stack the current Details columns one on top of the other for the best display effect.
Figure 7.8 The Layout tab is only available for the Details section when the Format with Multi-Columns option is set.
The results of this small report modification are seen in Figure 7.9. You can see that the report now shows the pertinent customer contact information in multiple columns across the page. This flexibility is often effectively used in the creation of financial statements and other reports where a columnar display paradigm is natural or expected.
Figure 7.9 A multi-column version of your customer contact report.

Using Multiple Report Sections
Including multiple sections within each section area of your report provides for an extremely flexible presentation of your report data. Chances are good that you do not need to create more than one occurrence of any of the existing report sections for basic reporting needs. However, Crystal Reports enables you to define multiple report sections within any given section area and to identify section-specific properties for challenging formatting requirements within more complex reports. Certain reporting tasks are performed most efficiently by creating multiple sections within an area.
For example, multiple report sections would be very useful if you want to create a form letter for your customers and you need to display only one of two possible return addresses on the letter—an American address for customers based in the United States and a Canadian address for the Canadian customers. To accomplish this, you do need to insert two report header sections into your report and use Conditional Formatting to dynamically apply the appropriate return address based on where the customer is located.
To demonstrate how to implement and use multiple report sections, you first need to review the basic operations of resizing, inserting, removing, and merging report sections.
Resizing Report Sections
Report sections might require resizing to accommodate for various sized report objects, such as large database fields, lengthy text objects, or corporate logo images, but they cannot exceed the size of the report page itself. From the Design tab of the report environment, you can drag the bottom boundary of the various sections up and down with the mouse to resize each section. Using the mouse, float the pointer over the horizontal boundary lines of the different sections. When the mouse pointer changes into a double-headed arrow icon, click and hold the left mouse button while dragging the boundary line to the desired position.
Inserting New Report Sections
To display only one of two possible return addresses on a form letter based on the country of the customer, you need to insert a second page header onto the report. The following steps walk you through constructing the following report using the Customer table from the Xtreme Sample Database:
- Create a new Crystal Report using the standard Report Wizard, connecting to the Xtreme Sample database and selecting the Customers table. Do not add any database fields to the report. Click the Finish button at the Fields Selection dialog.
- Create a Group (by choosing Insert, Group) based on the Customer Name field, but remove the Customer Name field from the Group header section. The Group field should have automatically appeared in the Group Header section when you created the group.
- Select the New Page After property for the Group Footer #1 section.
- Ensure that the Report Header section is suppressed.
- Create and insert text objects in the appropriate report sections, as shown in Figure 7.10.
Figure 7.10 This simple form letter report shows the correct return address conditionally.
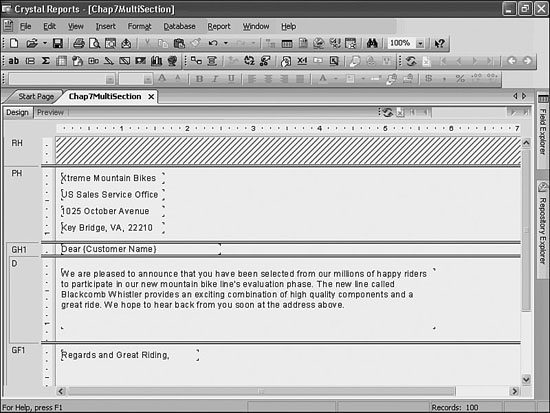
Notice that in this sample form letter report, each report object displayed on the report is just a text object inserted into the appropriate section. There are no database fields included in the report yet.
Next you will insert a new Page Header in which to display an alternate return address for Canadian customers. The following steps will take you through this process:
- To insert a new Page Header section, locate the existing Page Header section, right-click on the section name (on the left of the design environment), and select Insert Section Below from the pop-up menu.
The new section is entitled Page Header b and the original section was renamed to Page Header a so that there are now two Report Header sections within your report. The application follows this naming convention whenever multiple report sections are added. - After you have inserted a new Page Header section (labeled Page Header b), insert text objects to display a Canadian return address to be used for the non-U.S.-based recipients of the form letter, as shown in Figure 7.11.
Figure 7.11 The form letter report now shows two Page Header sections.

Now that the report has the two different return addresses and report sections created, the logic must be created within the report to implement the appropriate Page Header section based on each customer’s location—whether they are based in the United States or Canada. Each customer’s mailing address needs to be evaluated—the Country field from the Customer table. For this example, you’re only concerned with North American customers, and if this field is equal to USA, use Page Header a to display the return address. If it is equal to Canada, use Page Header b.
- To isolate your report for only North American (excepting Mexico) customers, choose the Select Expert option from the Report menu. From the list of available fields, select the Country field from the Customer table listing and click OK to continue.
- You should now see the Select Expert dialog. From the drop-down list on the left, select Is One Of and include Canada and USA in the list box.
- To add additional personalization to the form letter, use the Field Explorer to insert the Customer Name field into the Text Object—located in the Group Header #1 that reads “Dear Customer,”—so that it appears as
Dear {Customer Name}in the Design tab of your report. To do this, you’ll need to modify the text portion of this combined object to read “Dear” (the word Dear followed by a space), and then followed by the database field object.Finally, you need to apply the logic to display the appropriate return address on the form letter. To do this, you apply a conditional formatting statement (format formula) to each of the two Page Header sections.
- Using the Section Expert for Page Header a, click on the x+2 button (with the pencil symbol) located directly to the right of the Suppress (No Drill-Down) option on the Common tab. After clicking this icon, you should be presented with the Format Formula Editor dialog (see Figure 7.12). Here, you can use the Field, Function, and Operator windows (located in the upper area of the dialog) to insert the necessary format formula within this dialog, or you can just type in the statement in the lower area of the Editor dialog so that it reads
{Customer.Country} = "Canada". After you have inserted this statement, click Save and Close to return to the Section Expert. Note that the x+2 button has changed color (to red) to signify a conditional formula has been created here.Figure 7.12 The report section is suppressed only if the conditional statement defined in the Format Formula Editor is
True.
- You now need to implement a very similar formatting condition for the Page Header b section. Following the same procedure used for the first section, use the Section Expert to insert a statement that reads
{Customer.Country} = "USA".You do not need to check the Suppress (No Drill-Down) check box in the Section Expert dialog for either report Page Header section. By inserting a format formula, you have effectively applied conditional formatting that suppresses the section if the format formula is found to be true. In this case, one of the two format formulas should always be true because the customers are either located in the United States or Canada.
- Close the Section Expert dialog by clicking OK. As shown in Figure 7.13, your report should now display only one of the two possible return addresses on the form letter. To verify that the appropriate return address is being populated on the form letter report for each customer, you can easily add the Country field from the Customer table into the Group Header #1 section, also shown in Figure 7.13.
Figure 7.13 A simple form letter report is now dynamically formatted with the appropriate return address based on the customer’s location.

Deleting Report Sections
In much the same manner sections were inserted, unused report sections can be removed from reports quickly by right-clicking on the section name and selecting Delete Section from the pop-up menu. Be aware, however, that any report objects positioned within the section are also deleted from the report. If any of the objects within a section that will be removed are required, they will need to be relocated into alternative report sections before deletion.
Crystal Reports requires at least one section to be present for certain section types in every report—the Report Header and Footer, Page Header and Footer, and Details sections. These report sections are generated by default when creating new reports. Also, if Group objects exist within a report, you cannot remove the Group Header and Footer sections unless you first remove the Group object itself from the report.
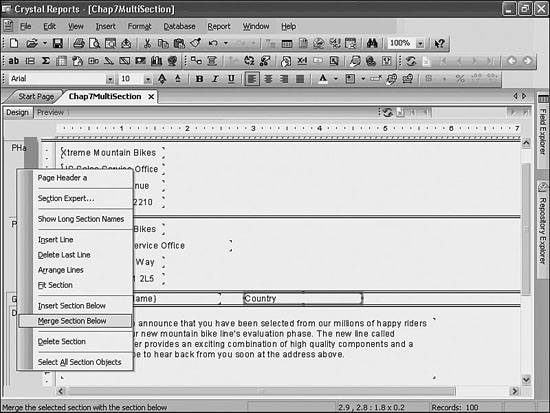
Merging Report Sections
When designing reports, you might periodically want to merge two report sections to simplify the layout of a report. To merge the two Page Header sections from your earlier example, right-click on the Page Header a section title and select Merge Section Below from the pop-up menu. The Merge Section Below command is available from the right-click menu of any report section that meets two criteria:
- There are more than one of the given section type (Page Headers) within the Section Area.
- The section is not last in a series of sections (Page Headers) consisting of the same section types within a common area.
For example, if three Page Header sections are present on a report (as shown in Figure 7.14), the Merge Section Below command would be accessible from the right-click menus of Page Header a and Page Header b, but not from Page Header c.
Figure 7.14 The Merge Section Below command is available from the right-click menu of certain report sections.

Troubleshooting
Report Section Formatting
I keep getting blank spaces above and/or below my data fields in my report sections, and I need a quick way of removing them.
To quickly remove blank spaces within report sections and tighten up the alignment of the objects positioned within the sections, use the Fit Section command available from the right-click menu of each report section.
Showing Group Section Headers on Drill-down
I want the Group headers of each Group Section to be shown as I drill-down into the report’s grouping hierarchy. By default, this does not happen and creating conditional suppress functions on each section can be time consuming.
To change the default behavior to always show Group Headers on drilling down, access the Report Options dialog from the File menu and check the Show All Headers on Drill-down option box.
Crystal Reports in the Real World—Advanced Formatting
Often, a report section needs to be more than simply one color or another. A report with many rows might need some color to help guide the reader’s eye and make each line distinctly separate from the next. In the following sample, the report created earlier is modified to improve readability:
- Open the Chap7RealWorld.rpt report or the report you created at the beginning of this chapter.
- From the Report menu, select Section Expert. When the Section Expert dialog window opens, select the Details section and click the Color tab.
- As previously described, checking the Background Color box enables you to set all the Detail lines to a single color. The intent here is to highlight the detail lines so they appear distinctly different from the detail line above and below to improve readability. Click the x+2 button and enter the following text into the code window:
- Finally, go back to the Section Expert. Select Group Footer from the list of sections and check the box labeled New Page After.
- Now, each group starts on a new page, and long groups have detail lines defined by color. The color improvement can be seen on page 3 of the report, as shown in Figure 7.15.
Figure 7.15 Records are delimited by color for improved readability.

- Save the report.