
Chapter 1 Creating and Designing Basic Reports
Introducing the Crystal Reports Designer 18
Understanding Data and Data Sources 25
Introduction to the Database Expert 27
Adding Database Objects to Your Report 29
Joining Database Objects Together 33
Understanding the Different Join Types 34
Using the Report Creation Wizard 35
Getting Started with the Report Wizards 36
Using the Standard Report Creation Wizards 36
Creating a Report Without Wizards 46
Crystal Reports—The Real World—HTML Preview 50
Crystal Reports—The Real World—SQL Commands 50
Introducing the Crystal Reports Designer
This chapter takes you through the required steps to create your own basic reports in the Crystal Report Designer. After you’ve installed the Crystal Reports XI Designer, you are ready to open it and familiarize yourself with the environment. This section briefly introduces the following components of the application interface:
- Report sections
- Application toolbars
- Application menus
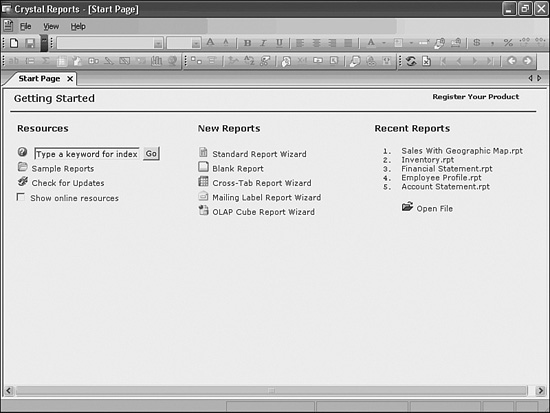
If you have already registered your installation, you should be presented with the Getting Started page shown in Figure 1.1. This page provides quick access to existing Crystal Reports files while also enabling you to begin designing new reports via the Report Expert Wizards or from a blank report template.
Figure 1.1 The Getting Started page provides quick access to existing Crystal Reports files as well as the Report Expert Wizards.
Crystal Report Sections
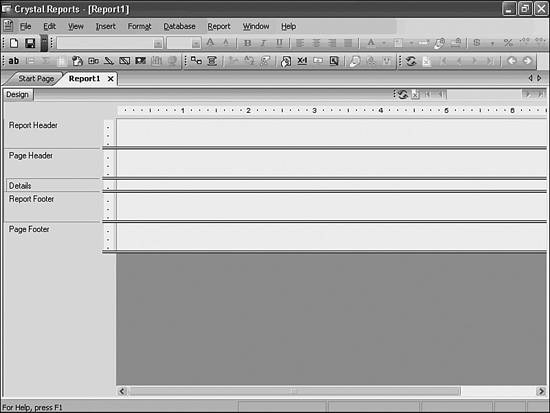
From the Getting Started page, select the Blank Report link (listed below the New Reports heading). You’ll see a window labeled Database Expert; click Cancel. If the Field Explorer window is now displayed on the right side of the new report screen, click the Close button. You will now be presented with a new Report1 Tab beside the original Start Page tab.
On the Report1 tab, you are presented with a blank report template that is divided into five report sections. As Figure 1.2 illustrates, report sections are identified by name on the left side of the design area. These sections segment the Crystal Reports design environment into logical areas to facilitate more intuitive report creation—these include the Report Header, Page Header, Details, Report Footer, and Page Footer sections (if your install displays initials instead of these report section names, go to the File menu, choose options and uncheck Short Section Names under the Layout tab). Each of these sections has unique properties and printing characteristics that you can modify. When creating reports, you place objects (such as data fields) into the various sections according to report requirements. If a report object such as an image is placed in the Report Header section, the image displays and prints only once per report, on the first page. If the same image is placed in the Page Header section, the image then displays and prints once per page. The same holds true for custom sections, such as Group Headers and Group Footers. The Details section implies that whatever is placed in this section displays and prints once for each and every row retrieved from the data source.
Figure 1.2 Report sections provide an intuitive way to create and organize your data when designing reports.
Although Crystal Reports is commonly used for Web reporting initiatives, the design environment is built on a paper metaphor with pages as a concept to facilitate the presentation of information.
Report sections can contain a variety of different object types, including database fields, text, pictures, charts, and map objects. Additional objects, such as formula and subreport objects, are also positioned within report sections and are covered later in the book in greater detail.
The Section Expert is used to view or modify the properties of the report sections. To access the Section Expert, perform one of the following actions:
- Right-click on the section’s label (or name, located on the left sidebar) you want to work with, and then select Section Expert from the pop-up menu.
- Click on the Section Expert button.
- Select the Section Expert option from the Report menu.
When designing reports, you should consider the following items when working with report sections:
- It is good practice to print a validating test page of each report you are designing.
- Consider keeping all font sizes the same within each section for maximum eye appeal.
- Print preprinted forms on the same machine to avoid discrepancies in the interpretation of the report layout by different print drivers and printers.
Crystal Reports also provides some more advanced section formatting options, reviewed later in the book, such as underlaying and suppressing sections based on certain criteria (formulas). These features are accessible from the Section Expert dialog.
Using Toolbars and Menus
Toolbars are the graphical icon bars at the top of the Crystal Reports application environment, containing various buttons that you can click to activate the most frequently used application commands. Toolbars act as shortcuts to access commonly used functions of the design application, and you can enable or disable them to appear or disappear at the top of the application area by selecting Toolbars from the View menu, which is located in the uppermost area of the application. As Figure 1.3 shows, there are five main toolbars that you can use within the Crystal Reports design environment:
- Standard—The most commonly used application functions, including New, Open, Save, Print, Preview, Export, Copy, Cut, Paste, and Help.
- Formatting—Functions that pertain specifically to modifying object properties with regard to Font, Font Size, Bold, Italics, Underline, Alignment, Currency, and Percentage formats.
- Insert Tools—Quick access to the building blocks of all reports including Text Objects, Summary Fields, Groups, Online Analytical Processing and Cross-Tab Grids, Charts, and Maps, and Drawing items such as lines and boxes.
- Expert Tools—Functions that enable you to access the main application experts quickly, such as the Database, Group, Select, Section, Formula Workshop, and Highlighting Experts.
- Navigation Tools—Functions that enable refreshing of the report data and navigation through the pages of the involved reports.
Figure 1.3 The five Crystal Reports Design toolbars provide quick and easy access to commonly used application commands during report design.
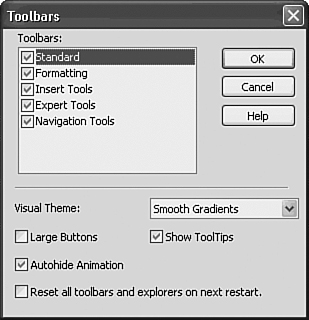
ToolTips are pop-up descriptions that appear when your cursor rests over any of the toolbar buttons. ToolTips are enabled by default. To disable ToolTips on your toolbars, deselect the Show ToolTips check box from within the Toolbars dialog.
In much the same way that the toolbars offer quick and easy access to commonly used commands, the menu items at the top of the application environment provide listings to virtually all the application functions available in Crystal Reports. The menu items act as shortcuts to all the commands within the design application, and they include the following items:
- The File menu includes file-specific commands to create a new report file, open an existing report, close a current report, save a report, save a report with an alternative filename, export to a different file format, and save the current data set with a report. In addition, the File menu contains commands that enable you to send a report to a printer, select a specific printer, modify the page setup and margins, add summary information to a report, and set a variety of report options.
- The Edit menu includes commands used to modify various aspects of a report, including commands to undo and redo actions, as well as to cut, copy, and paste report and OLE objects. Additionally, you can edit fields, formulas, summaries, and subreport links.
Object Linking and Embedding (OLE) enables you to insert objects (OLE objects) into a report from other applications and then use those applications from within Crystal Reports to edit the objects if necessary. If Crystal Reports did not make use of OLE, you would have to exit Crystal Reports, open the original application, change the object, return to Crystal Reports, delete the object originally inserted, and then insert the newly revised object.
- The View menu includes commands used to customize the user interface of the Crystal Reports application. The View menu commands enable you to navigate between the application’s Design and Preview views, access the three main explorers (Field, Report, and Repository Explorers), access the new XI Dependency Checker window, access the new XI Workbench window, access the Toolbars dialog, zoom in and zoom out of a report, as well as turn on and off the application rulers, guidelines, grids, ToolTips, and group tree from both the Design and Preview views of the report.
- The Insert menu includes commands used to insert text objects, summaries (counts, sums, medians, and so on), field headings, groups, subreports, lines, boxes, pictures, charts, maps, report template objects, and other objects into your report.
- The Format menu provides easy access to a variety of commands useful in formatting your reports for presentation purposes. This menu includes commands used to change the characteristics of the objects in a report. The Format menu provides quick access to commands for modifying font properties (color, size, borders, background color, and drop shadows for example), chart, line height, and hyperlink properties, and formatting for entire sections of the report. The Format menu also provides commands to arrange report objects (move, align, and size) and to specify desired highlighting characteristics via the Highlighting Expert.
- The Database menu includes commands used to access the Database Expert, from which you can add and remove data source tables for use within reports, specify links between data source tables, and modify table and field alias names. This menu also provides easy access to the set database location and enables you to log on and off SQL and ODBC servers, browse field data, and display and edit the report SQL syntax. In general, the Database menu enables you to maintain the necessary specifications for the report with regard to the data source(s) with which the report interacts.
- The Report menu includes commands used to access the main application experts (also referred to as wizards), identify the desired records or groups to be included in a report via the Select Expert and Selection Formulas (often referred to as applying report filters), construct and edit formulas, create and view alerts, specify report bursting indexes, modify grouping and sorting specifications, refresh report data by executing the query to run against the database, and view report performance information.
- The Chart menu is only visible after selecting a chart or map object and includes specific commands used to customize your charts and maps. Depending on the type of chart you select, the Chart menu includes commands to zoom in and out of charts; apply changes to all instances of a chart; discard custom changes made to the chart; save the chart template to a file; apply and modify template specifications for the chart; change the titles, numeric axis grids, and scales of the chart; and auto-arrange the appearance of the chart. After selecting a map object, the Chart menu then includes additional commands used to configure the overall style of the map, reorganizing the layers of report elements, changing the geographic map, and hiding or showing the Map Navigator.
- The Window menu includes commands used to rearrange the application icons and windows, as well as providing a list of report windows that are currently open and a command that enables you to close all report windows at once.
- The Help menu includes commands used to quickly access the Crystal Reports online help references, commands to register Crystal Reports and locate the Getting Start page, and quick access to the About Crystal Reports dialog and several key Business Objects websites for technical support and product information. Lastly and new to Crystal Reports XI, the Help menu provides online access to Crystal Reports updates, downloaded and installed automatically from the Web. These updates can be set to occur automatically or manually.
Report Design Explorers
Several report design explorers, intended to streamline the report design process, compose another key component to Crystal Reports XI. The design explorers are application tools that greatly enhance a report designer’s efficiency while working with reports. They are design tools you will use in building reports throughout the remainder of the book.
The report design explorers are dialog windows that display various objects relevant to the report in a hierarchical tree view facilitating quick access to and formatting of each respective object and its properties. The explorers enable you to easily locate and navigate to specific report objects, such as the report header or a corporate logo image, to customize the object for design purposes. All the objects included in a report (report sections, groups, database fields, formulas, parameters, images, charts, and so on) are organized and displayed within one of the design explorers. There are three distinct explorers:
- Report Explorer—Provides a tree view of each report section in the report and each of the report objects contained within each section. You can work with each report object directly from the explorer rather than navigating to each object separately in either the Design or Preview tab of the report.
- Field Explorer—Displays a tree view of database fields, formulas, SQL expressions, parameters, running totals, groups, and special fields. You can add any of these field types directly to a report from the Explorer dialog. Fields that have already been added to the report or fields that have been used by other fields (such as formula fields, groups, summaries, and so on) have a green check mark icon in front of them.
- Repository Explorer—Provides a tree view of each object contained in the Crystal Enterprise report repository. You can work with each report repository object directly from the Repository Explorer rather than locating each object separately for inclusion in the report during the report design process.
It is important to emphasize that since Version 10, the centralized Repository is only available for use with BusinessObjects Enterprise. See Chapter 18, “Using a Semantic Layer—Business Views and Universes,” for more details on this topic.
Locating and Using the Report Design Explorers
Each of the explorer dialogs can be docked in place or used in a free-floating state. By default, the Report and Field Explorers appear docked on the right side of the report design environment. However, you can manually dock each of them in other locations if you prefer. The explorers can also be used in free-floating mode, in which case each of the explorer dialog windows can be dragged to any location within the report design environment and float in place until you either close or reposition it. To view each of the report design explorers, click the View menu and select each desired explorer individually, as shown in Figure 1.4.
Figure 1.4 By default, the design explorers, workbench, and dependency checker are docked on the right side of the report designer application but can be moved about and toggled on and off to facilitate report design.

To save space in the design environment, the individual explorers can be dragged on top of each other and provide their functionality through respective tabs in a single dialog. This is the default position for the Field and Report Explorer in a fresh install but note in Figure 1.4 how the Report Explorer has been dragged into its own dialog with the Repository Explorer exposing itself through a tab in that same dialog. Also new in XI is the ability to autohide the explorer windows by clicking on the thumbnail toggle button at the top of each explorer. The explorers will then autohide on the sides of your report until you are ready to use them again.
The report design explorers create an intuitive way for report designers to add and format report objects quickly while constructing reports. As you progress through the remainder of the book, you will be using these explorers on a regular basis, so it’s important that you understand the basics of these application features.
The Workbench and Dependency Checker
Two new features presented in XI are the Workbench and the Dependency Checker. The Workbench provides a tool within the Crystal Reports Designer that enables the logical grouping and management of reports into projects. The Dependency Checker is another new tool that checks a specified report, or all reports in an existing Workbench report project for several types of errors, including formula compilation problems, database errors, repository object errors (if you’re using BusinessObjects Enterprise), and hyperlink errors. You can check for these types of errors and invoke the Dependency Checker from under the main Report menu or from within the Workbench window. Both the Dependency Checker and the Workbench can also be accessed from the main View menu and can be located and locked in the same way as the Report Explorer.
Understanding Data and Data Sources
The first step in creating a report is always to identify a data source. Today, Crystal Reports supports more than one hundred different types of data sources. These data sources range from traditional databases such as Microsoft SQL Server, Oracle, IBM DB2, and Microsoft Access to other more abstract forms of structured data such as log files, email, XML, COM/.NET/EJB objects, and multidimensional (OLAP) data. Many of the advanced data sources and their specific nuances are covered in great detail in Chapters 15–18.
To determine which database driver to use to connect to a certain data source, it’s best to understand the different types of database drivers. The following sections discuss direct and indirect access database drivers.
Understanding Direct Access Drivers
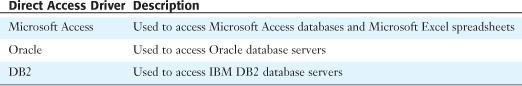
Direct access database drivers are built solely for reporting from a specific type of database such as Oracle. If a direct access driver (sometimes called a native driver) exists for the database that you intend to report from, it is generally the best choice. Although they follow the standard model of a database driver, direct access drivers are tailored for that specific database. For example, if you choose the Microsoft Access direct access driver during the creation of a report, you will be prompted for the filename of the Access MDB file. If you are using the Oracle direct access driver, you will be prompted for a server name. Not only is the user experience more specific to that database, a direct access driver often results in better performance than other methods of connecting to the same data. Table 1.1 lists some of the most common direct access database drivers.
Table 1.1. Common Direct Access Database Drivers
Understanding Indirect Access Drivers
As you might guess from the name, an indirect access driver is one that connects indirectly to an actual data source. Indirect access drivers are not built for any one type of database, but rather are built to read data from a variety of data sources via a standard data access mechanism. The purpose of these drivers is to enable Crystal Reports to use data sources for which direct access drivers do not exist. The two major indirect access drivers provided are ODBC and OLE DB.
ODBC, which stands for Open Database Connectivity, is a long-standing technology built to connect various applications to various data sources via a common mechanism called an ODBC driver. Just as Crystal Reports has a concept of database drivers that enables data access to report developers, ODBC has a concept of ODBC drivers that enables data access to any application. The Crystal Reports ODBC database driver communicates with an ODBC driver, which in turn communicates with the actual database. ODBC drivers are generally developed by the database vendors themselves and often come bundled with the database software.
OLE DB, pronounced “OH-lay-dee-bee,” is the evolution of ODBC. Like ODBC, OLE DB has a concept of database drivers, but calls them OLE DB providers. Crystal Reports can read most OLE DB providers. Figure 1.5 illustrates the various ways to connect to your data.
Figure 1.5 The Crystal Reports data access architecture provides unparalleled data access.

If appropriate, any necessary database client software should be installed and configured prior to installing Crystal Reports. However, if you’ve installed Crystal Reports before installing the database vendor’s client software, follow the directions located in the Crystal Reports Help files to ensure correct configuration of the Crystal Reports system Data Source Names (DSNs).
Introduction to the Database Expert
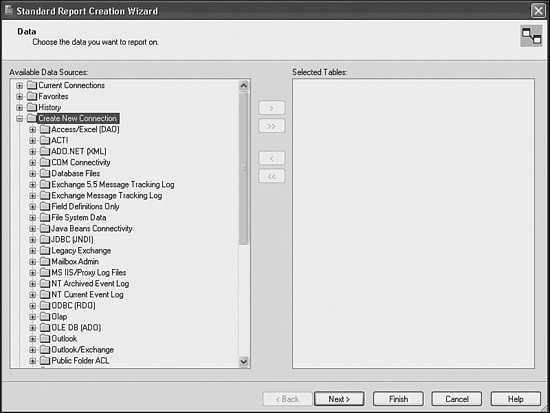
Now that you’ve got a basic understanding of what database drivers are and an idea of which one you might use to access a particular data source, let’s look at the user interface for selecting the data source for a report. Because this is the first step in the creation of a report, it is only natural that this is the first step in the Report Wizard. This is shown in Figure 1.6. The Database Expert is a tree control hosted inside the Report Wizard that enables you to identify the following:
- Which Crystal Reports database driver you want to use
- Which data source you want you use
- Which database objects you want to use
Figure 1.6 The Database Expert provides access to the multitude of supported Crystal Reports data sources.
To open the Database Expert, select File, New and select the type of report you want to create. Selecting Blank Report opens the Database Expert on its own, whereas selecting any other report type opens the Database Expert as part one to a multipart wizard dialog. The Database Expert represents data source connections organized into a number of categories. The following sections describe each of these categories, whereas the Enterprise Repository is discussed in Chapter 18.
Creating a New Connection
To specify a new connection, expand the Create New Connection node in the Database Expert. As Figure 1.6 shows, you can select from a multitude of data sources in this interface. You will notice a node in this section for each of the drivers selected during the installation process.
One node to take special note of is the More Data Sources node. When this is expanded, it lists all database drivers that are available but not installed. Crystal Reports supports install on-demand. This means that various features always appear as being available, even if they are not installed. When you expand one of the database driver’s node selections under the More Data Sources node, that driver would be installed on demand. Then the next time the Database Expert is loaded, it would list that driver directly under the Create New Connection node.
Now that you understand which data sources are listed where, look at the process of creating a connection. To create a connection, follow these steps:
- Expand the node that corresponds to the appropriate database driver. An easy one to play with is the Xtreme sample database that comes with Crystal Reports XI. To create a connection to this database, expand the ODBC (RDO) node.
- Notice that when a node is expanded, a dialog is presented that allows for the specification of connection information. In the case of ODBC, the DSN is the only thing required. In this list of available DSNs, Xtreme Sample Database 11.5 should be visible. This is pre-installed with Crystal Reports. Select this and click Finish.
- Focus returns to the Database Expert, and there should be a node below the ODBC (RDO) node called Xtreme Sample Database 11.5. Below that node is the list of available tables, views, and stored procedures, as well as the Add Command option for adding a SQL command. (This will be discussed shortly.)
The Xtreme Sample Database could also have been used via the OLE DB or direct Access driver. Note that when prompted for connection information when using one of these drivers, the report developer is asked to provide different information. In the case of ODBC, a DSN needed to be selected, whereas with OLE DB, a provider would need to be specified.
Using Current Connections
The Current Connection node lists all database connections that are currently open. In other words, if a report is currently open or was recently open, that connection is listed under the Current Connections node. The first time the Crystal Reports Designer is opened, the Current Connection node is empty because no connections have been initiated. This is indicated by a “...no items found...” item shown when the Current Connections node is expanded. This is a quick way to select the same connection as another report currently open.
Using Favorite Connections
The Favorites node lists all connections that have been designated a favorite. This is analogous to favorites and bookmarks in a Web browser. If you have a certain database connection that is used often, adding it to the Favorites node makes it quick and easy to find in the future.
To accomplish this, create a connection to a database (you can use the Xtreme Sample Database to try this out), and select Add to Favorites when right-clicking on that connection. Be sure to right-click on the connection and not the driver or table name. Figure 1.7 illustrates the Xtreme Sample Database connection being added to a user’s Favorites.
Figure 1.7 Add the Xtreme Sample Database ODBC connection to the Favorites node to locate it quickly.

Leveraging Recently Used Connections with the History Node
The History node is situated beneath the Favorites node in the Database Expert. It lists recent database connections that have been made. This is useful for quickly locating and using a connection that has been recently used, but not added to the Favorites list. The history list stores the last few connections. If you find yourself using connections from the History node frequently, it might be better to add the connection to your favorites list.
Adding Database Objects to Your Report
The term database objects is used to describe the various forms of data that can be added to a report. Specifically, Crystal Reports can use the following types of database objects as data sources for a report:
- Tables or system tables
- Views
- Synonyms
- Stored procedures
- SQL commands
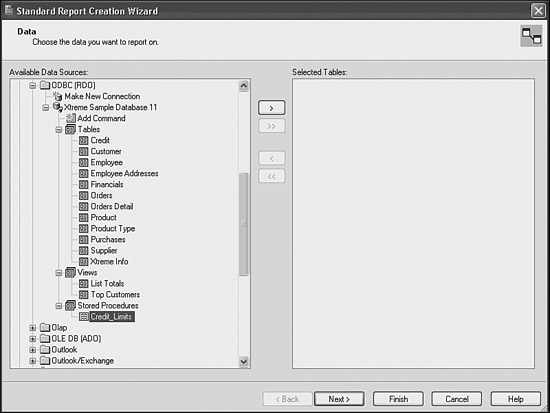
Database objects are listed underneath connections in the Database Expert and are grouped by object type. In Figure 1.8, the various database objects are shown for the Xtreme Sample Database. In this case, there are tables, views, system tables, and stored procedures. The Add Command node gives you the ability to add SQL commands to this report.
Figure 1.8 The Database Expert presents database objects in their logical categories.
You can control the objects that are displayed in the Database Expert by setting selection, description, and filtering options accessed from either the Database tab of the Options dialog under the File menu or the Options menu option of the database’s right-click context menu. This can be particularly useful when you are reporting off databases with hundreds of tables.
The following sections describe the most common database object types in further detail.
Reporting on Tables
Tables are the most basic form of a data structure. Simply put, a table is a set of fields bound together to represent something in the real world. A Customer table might contain fields that describe all the customers of a given business. An Employee table might store information about a corporation’s employees such as name, title, or salary.
To add a table to a report, select the table in the Database Expert and click the arrow (>) button. The table is added to the Selected Tables list on the right side of the dialog below its corresponding connection. Most database administrators give the tables meaningful names; however, sometimes tables can have quite archaic names, such as RM564_321. A name like this isn’t very descriptive, so it would be useful to rename this table to something more meaningful. To rename a table, select it in the Selected Tables list and press the F2 button (F2 is a standard convention for renaming things in Windows). In Crystal Reports, renaming a table is referred to as aliasing a table.
Reporting on Views
A view is a query stored by the database that returns a set of records that resemble a table. Views often perform complex query logic, and good database administrators create them to simplify the job of people (like report developers) extracting data out of the database. For example, the Top Customers view in the Xtreme Sample Database returns all customers who have sales of more than $50,000. From a report developer’s perspective, views act just like tables and can be added to the report in the same way.
Reporting on Stored Procedures
Stored procedures, in the context of Crystal Reports, are similar to views in that they are predefined queries in the database that return a set of records. The major difference is that a stored procedure can be parameterized. This means that rather than having a preset query that returns the same data every time it is run, stored procedures return different data based on the values of parameters passed in.
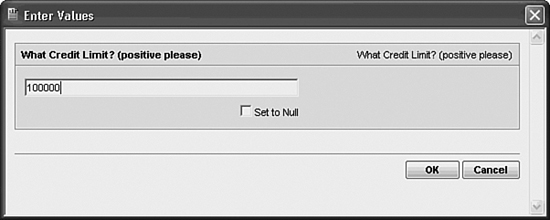
Adding a stored procedure to a report works much the same way as tables and views. However, if the stored procedure has a parameter, a dialog appears when you attempt to add the stored procedure to the report. This is shown in Figure 1.9. The dialog asks you to provide values for each of the stored procedures’ parameters. After you complete this and click the OK button, focus returns to the Database Expert and the stored procedure is shown in the list of selected tables. At this time, a parameter is created in the report that corresponds to the stored procedure parameter, and any values that parameter is given are passed to the underlying stored procedure.
Figure 1.9 Adding a stored procedure with a parameter invokes the Enter Values dialog.
Reporting on SQL Commands
When reporting from tables, views, and stored procedures, Crystal Reports generates a query behind the scenes using the Structured Query Language (SQL). This is beneficial because the report developer does not need to understand the complexity of the SQL language, but rather can just drop fields onto the report and get data back that matches those fields. However, sometimes report developers are quite experienced with databases and, specifically, the SQL language. Because of this, they sometimes prefer to write their own SQL query rather than have Crystal Reports generate it for them. For an introduction to the SQL language, refer to the XI Downloads section at www.usingcrystal.com and download Appendix A: “Using SQL Queries in Crystal Reports.”
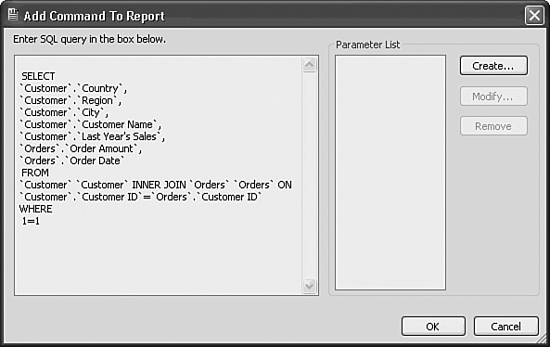
SQL Commands enable you to use your own prebuilt SQL query and have the Crystal Reports engine treat that query like a black box. This means that any query, whether simple or very complex, that returns a set of records can be used as a data source for a Crystal Report. To create a SQL Command, select the Add Command item under the database connection, and then click the arrow (>) button. This initiates a dialog that enables the user to type in a SQL query. Figure 1.10 illustrates a typical query.
Figure 1.10 Adding a typical SQL Command to a report.
After the query is typed in and the OK button is clicked, focus returns to the Database Expert, and the newly created command is represented as 'Command' underneath its corresponding connection in the Selected Tables area. As with all database objects, selecting the command and pressing the F2 button enables the user to rename the object.
One key feature of SQL Commands is parameterization. If you had to create a static SQL query, much of the power of SQL Commands would be lost. Fortunately, SQL Commands in Crystal Reports support parameters. Although parameters can be used in any part of the SQL Command, the most common scenario would be to use a parameter in the WHERE clause of the SQL statement to restrict the records returned from the query. To create a parameter, click the Create button in the Modify Command dialog. This initiates a dialog that enables the user to specify a name for the parameter, text to use when prompting for the parameter value, a data type, and a default value. After the OK button is clicked, the parameter appears in the Parameter list. To use this parameter, place the cursor where the parameter should be used in the SQL query, and double-click the parameter name.
When a SQL Command is created with a parameter, the report developer is prompted for a parameter value. This works much the same way as parameterized stored procedures in that a parameter is created automatically in the report that maps to the SQL Command parameter.
Unlike previous versions (9 and before), SQL Commands can no longer be centrally stored and accessed in a centralized Crystal Repository without the BusinessObjects Enterprise product. In fact, the Repository and all its reusable objects are now only available through BusinessObjects Enterprise. A Repository Migration Wizard is distributed with the Enterprise product to facilitate a quick migration from the V.9 Crystal Reports–based Repository.
Joining Database Objects Together
Up until this point, only reports based on a single table, view, stored procedure, or SQL Command have been discussed. However, it is quite common to have several disparate database objects in the same report. Crystal Reports treats all types of database objects as peers, which means that a single report can contain multiple tables, views, stored procedures, and SQL Commands. Because all database objects are treated as peers, the term table will be used from now on to describe any of these database objects.
Because of Crystal Reports’ inherent basis on relational data, any time multiple tables are used, they must be linked together so that the sum of all database objects is a single set of relational records. The good news is that most of the time, Crystal Reports takes care of this automatically, and the report developer need not worry about linking.
To see this in action, create a connection to the Xtreme Sample Database and add both the Customer and Orders tables to the report. When clicking Next in the Report Wizard, the linking between those tables is displayed as shown in Figure 1.11. Each table is represented by a window. In addition to the name, each field in the table is listed inside the window, and those fields that are defined as indexed fields in the database are marked with colored arrows. Any links defined between tables are represented as arrows connecting the key fields from two tables. Based on general database theory, linking to a field that is indexed generally results in a better performing query, and indexing is highlighted in this dialog through the color-coded icons displayed beside the field names.
By default, Crystal Reports creates links based on name. In this case, both tables have fields with a name of Customer ID, so a link is already created. To accept this link, simply click Next to move to the next step in the Report Wizard. If there were not a common field name, selecting the By Key option and clicking Auto-Link would attempt to create a link based on the fields defined in the database as keys. If neither of these methods of automatic linking work, the link must be manually created. This is very simple to do: Simply drag the field to link from one table and drop it onto the field from a second table.
Figure 1.11 You can link multiple tables together in the Report Wizard.
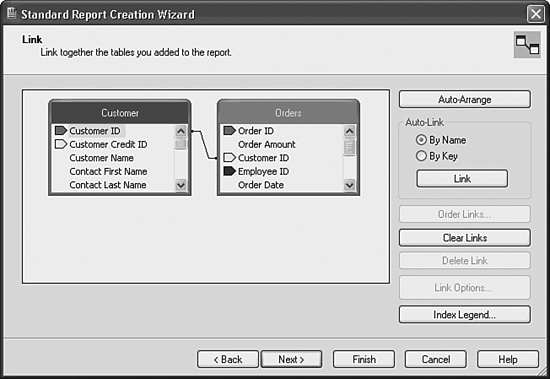
After links are created, you can configure them by clicking on the link arrow connecting two tables (it turns blue when selected), and then clicking the Link Options button. Links have two options: join type and link operator. These settings determine how Crystal Reports matches records from both tables. The default join type is an inner join, which means that only records with a matching key in both tables are included. The default link type is equal. For most cases, these two settings do not need to be modified.
Understanding the Different Join Types
In Crystal Reports, the Link tab of the Report Wizard (and Database Expert) provides a visual representation of the relationship between multiple database objects. Defining the appropriate join strategy for any given report should be reflective of the data within the database objects and of how the report needs to read and display that data. Join type settings enable you to control more precisely the query results based on your unique requirements. The following is a list of the most common types of joins and their associated descriptions:
- Inner—The resultset includes all the records in which the linked field value in both tables is an exact match. The Inner join is the standard type of join for most reports, and it is also commonly known as the Equal join.
- Left Outer—The resultset includes all the records in which the linked field value in both tables is an exact match. It also includes a row for every record in the primary (left) table for which the linked field value has no match in the secondary (lookup) table. For example, if you would like your report to display all customers and the orders they have each placed—including the customers who have not placed any orders at all—you can use a Left Outer join between the Customer and Orders tables. As a result, you would see a row for every customer who has not placed any orders.
- Not Equal—The resultset includes all records in which the linked field value in the primary table is not equal to the linked field value in the secondary (lookup) table. For example, if you needed to report on all orders that were not shipped on the same date that they were ordered, you could use the Not Equal join type to join the
OrderDatefield in the Orders table with theShipDatefield in the OrderDetails table. - Full Outer—The resultset includes all records in both of the linked tables—all records in which the linked field value in both tables is an exact match, in addition to a row for every record in the primary (left) table for which the linked field value has no match in the secondary (lookup) table, and a row for every record in the secondary (lookup, or right) table for which the linked field value has no match in the primary table. The Full Outer join is a bidirectional outer join, which essentially combines the characteristics of both the Left Outer and Right Outer joins into a single join type.
The capability to enforce links created in a report was introduced in version 10. Enforcing a link between two tables ensures that this link will be used in the report’s respective SQL, regardless of whether fields are required from either or both of the involved tables. The default setting is Unenforced Links, meaning that the link will be used only if the report’s respective SELECT statement requires it. Access to the different enforcing options is provided by right-clicking on a link and selecting the Link Options menu item.
After a report is created, select Database Expert from the Database menu to return to the Database Expert. Here tables and SQL Commands can be added, removed, and renamed just as they could from the Database Expert in the report creation process.
Using the Report Creation Wizards
Now that you have been quickly introduced to the Crystal Reports development environment and reviewed data access, a good place to begin creating reports is with the default report wizards. The report wizards are provided to expedite the report design process for report designers of all skill levels, but they are especially useful for new users of Crystal Reports.
The report wizards, also commonly referred to as report experts, provide a simplified interface and guided path to constructing the fundamental elements found within most reports. As a result, designing interactive, professional-looking reports can be achieved in a matter of minutes.
This section reviews the various wizards available for different report styles you might require. This chapter also provides a tutorial that walks you through the report design process using the Standard Report Creation Wizard to create a useful, professionally styled report.
Using the default report wizards as a starting point for beginners on most reports is a good idea. The report wizards offer a shortcut to establishing the core elements required for most reports.
Getting Started with the Report Wizards
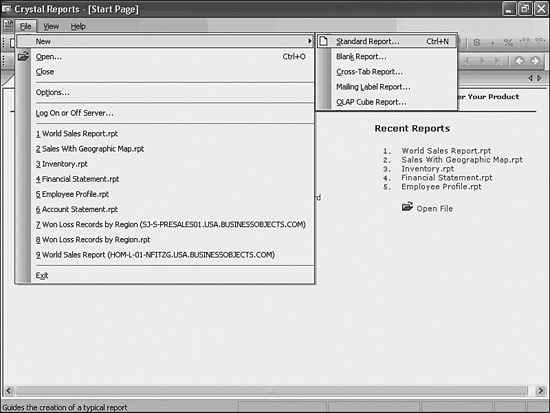
The Report Wizards are accessed from either the Getting Started page previously highlighted in Figure 1.1 or from the New menu option accessed under the main File menu. The four report wizards facilitate the guided, visual creation of four types of reports.
As Figure 1.12 illustrates, the New menu option from under the File menu serves as the gateway to accessing and using the various report creation wizards. From this menu, you can select from one of the four provided report wizards:
- Standard—Used to create traditional columnar-styled reports
- Cross-Tab—Used to create summary styled Cross-Tab reports
- Mailing Label—Used to create reports with multiple columns, such as address labels
- OLAP Cube—Used to create summary styled Cross-Tab reports that are based on an OLAP data source
Figure 1.12 The Crystal Reports New File menu provides quick access to the various report creation wizards.
The remainder of this section focuses on exploring and using the Standard Report Creation Wizard. In general, this is the most commonly used report wizard, and it provides a good introduction to the components of the report design process. If your interests lie in either OLAP Cube or Cross-Tab reports, they are covered in later chapters.
Using the Standard Report Creation Wizard
The Standard Report Creation Wizard is the most frequently used design assistant in Crystal Reports. It provides multiple dialogs common to creating reports that are based on conventional corporate data sources. The Standard Report Creation Wizard guides you through selecting a data source, linking data source tables, adding data source fields to the report, specifying field groupings, identifying summary (total) fields, and setting the desired sort criteria for your report.
Additionally, the Standard Report Creation Wizard walks you through creating chart objects, applying record selection criteria (data filters), and applying predefined templates (layouts) to your report.
The term filter is commonly used to describe data selection criteria that narrow the scope of the data being extracted by the report from the underlying data source. For example, by using a filter such as Country = USA, you can easily limit your report to include only the information you are interested in extracting.
The Standard Report Creation Wizard consists of nine dialog screens that enable you to specify the criteria mentioned previously to create a professional-looking report quickly. The sequence of the wizard’s dialog screens is dynamic and directly associated with the items selected in each of the progressive screens. For example, if you do not choose to identify any summary items for your report, you will not be presented with a Chart dialog screen. In general, charts apply best to summarized data, so if you have not identified any summary fields, the wizard assumes that you do not want to include a chart object in your report.
Charts can also be created from base-level data, although to do this you must appropriately specify the On Change Of option and use the Advanced settings with the Chart Expert. Generally, it makes more sense to base chart objects on summary-level data, such as regional sales by quarter—where you are charting the total sales for each quarter rather than each sales transaction in each quarter.
The following exercise steps through the wizard and builds a sales report to display last year’s sales by country. By making use of the Standard Report Creation Wizard, you include the country, city, customer name, and last year sales database fields, graphically display a summary of last year sales by country, and apply professionally styled formatting to the report. To create the sales report, follow these steps:
- From the main File menu, select the New option, and then select the Standard Report Wizard from the wizard list.
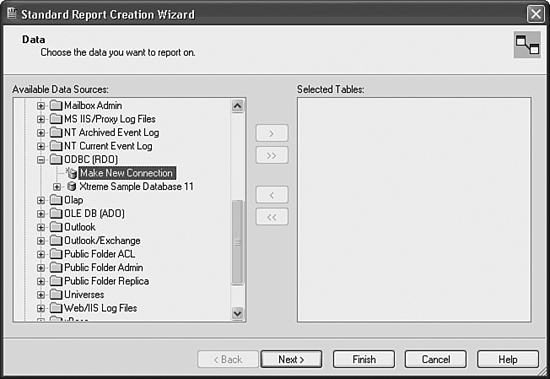
- As shown in Figure 1.13, you should now be presented with the first dialog—labeled Data—as part of the Standard Report Creation Wizard. From the Data dialog screen, expand the Create New Connection node and then expand the ODBC listing as well. This should present the ODBC Data Source Selection dialog.
Figure 1.13 The Standard Report Creation Wizard begins by requesting a data source for your report.
- From the ODBC Data Source Selection dialog, scroll to the end of the Data Source Name list and select Xtreme Sample Database 11, as shown in Figure 1.14. Click Next to continue.
Figure 1.14 The ODBC Data Source Selection dialog enables you to select a valid connection to access your ODBC data sources.

- Verify that the Data Source Name is correct and click Finish from the ODBC Connection Information dialog. No password is necessary to access this database.
- After you have successfully identified and connected to Xtreme Sample Database 11, you should see this item listed under the ODBC node in the Available Data Sources area of the Data dialog screen, as shown in Figure 1.15. Upon expanding the Xtreme Sample Database 11 item, you should see three or four distinct data source items listed: Tables, Views, and Stored Procedures—and possibly System Tables, dependent on your options settings (shown in Figure 1.16).
Figure 1.15 The Xtreme Sample Database is listed under the Available Data Sources area of the Data dialog.
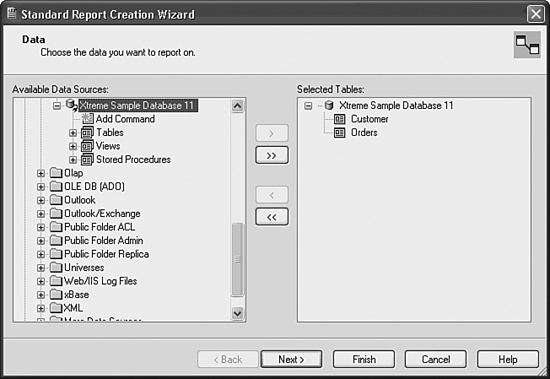
Figure 1.16 Upon expanding the Xtreme Sample Database 11 item, you will notice multiple database items listed.
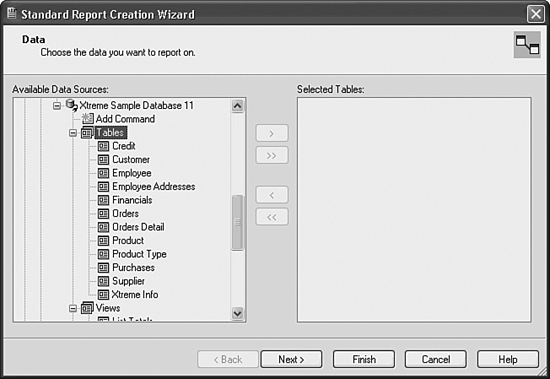
- Within the Data dialog screen, select the Customer and Orders tables so that they are listed in the Selected Tables area on the right. After these two tables are selected, click Next to continue on to the Linking Dialog.
There are multiple ways to include tables in your report from within the Data dialog screen. From the list of available tables on the left side of the dialog, you can perform any one of the following actions to populate the Selected Tables list on the right side of the dialog area:
• Double-click on each desired table item
• Drag-and-drop each desired table item
• Highlight the table item on the left (or multiple tables by using Ctrl-click) and click on the respective arrow icon (
>or>>) between the two listing areas to populate the listing on the right - The Link dialog screen presents a visual representation of the relationship between these two tables and permits you to modify the defined relationship by specifying the exact Join links that you require to accurately report on the data within the selected tables. As shown in Figure 1.17, you should now see the Link dialog screen. For our purposes here, accept the default Join condition. Click Next to continue.
Figure 1.17 The Customer and Orders tables are linked together via the Customer ID field.

- After specifying the table linking, you will see the Fields dialog screen, shown in Figure 1.18. Select the Customer Name, Country, and City fields from the Customer table and the Order Amount and Order Date fields from the Order table so that they appear under the Fields to Display area on the right. If necessary, you can use the up and down arrows to modify the order of these fields in the list. Click Next to continue.
Figure 1.18 The Customer Name, Country, City, Order Amount, and Order Date fields should appear under the Fields to Display area.

If you’re not sure of the data contained in any of the respective field items on the left, you can highlight a field name and click the Browse Data button to view a list of values from this field, as shown in Figure 1.19. This can be particularly useful if you are unfamiliar with the database and need to locate a field based on the values it contains, such as account numbers, policy codes, or employee names.
Figure 1.19 The Browse Data button enables you to view a list of values from any of the available database field items.

- You should now see the Grouping dialog screen. This dialog enables you to specify logical groups of information within your reports. For this example, select to group by the Country field only, as shown in Figure 1.20. Click Next to continue.
Figure 1.20 The Grouping dialog enables you to create structured groupings of information within your report.

- You should now see the Summaries dialog screen. The Summaries dialog screen enables you to identify summary values (such as Sums, Counts, and so on) for your reports. If you have not identified any grouped items in a report, the Summaries dialog does not appear because summaries are only applicable to grouped data. To apply a summary object to the report, select the Order Amount field so that it appears under the Summarized Fields list on the right. This is shown in Figure 1.21. Click Next to continue.
Figure 1.21 The Summaries dialog screen enables you to create summarized values that are frequently used in coordination with the grouping structure within reports.
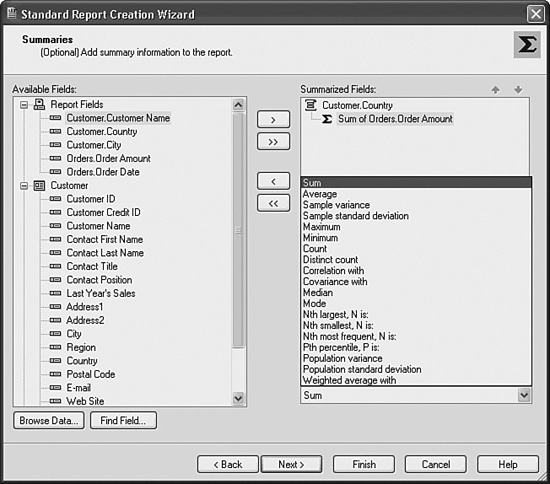
As you might notice, Crystal Reports automatically chooses a summary for you if you choose to group your report data. It examines the detail information you’ve specified for the report and builds a summary on the first available numeric field. However, this default summary criteria is easily modified in the wizard.
By default, the Order Amount field that appears under the Summarized Fields area on the right is aggregated as a Sum of the actual field value. As shown in Figure 1.21, the drop-down list located in the lower-right area of the Summaries dialog screen enables you to select from a variety of summaries, including Sum, Average, Maximum, Minimum, Count, Correlation, Covariance, and Standard Deviation.
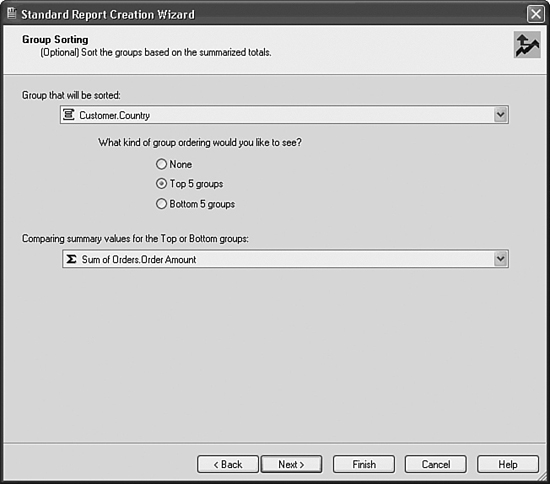
- Now sort the report based on the total order amounts of the top five countries. The Group Sorting dialog screen enables you to sort the grouped fields based on the summarized totals. From the Group drop-down list, select the Country field (the only option in the example here) and select the Top 5 Groups option from the Group Ordering choices. Also, select the Sum of Order Amount item (the only option in the example here) from the Comparing Summary Values drop-down list, as shown in Figure 1.22. Click Next to continue.
Figure 1.22 The Group Sorting dialog enables you to sort your report based solely on the Group values you want to include in the report results.
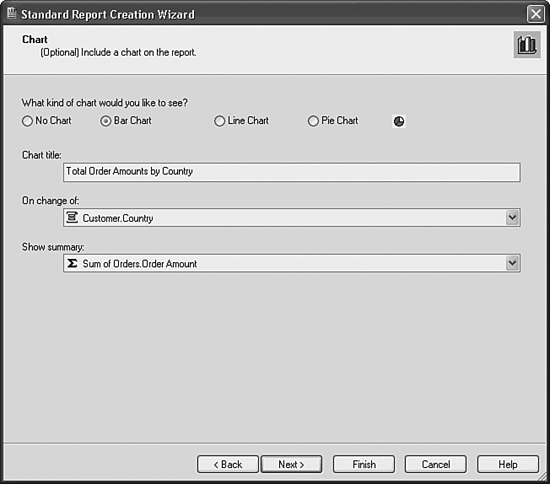
- Charting can be added through the wizard to visually display the data already selected. From the Chart dialog screen, you can select a chart object to be included in the report based on the group and summary items you identify here. For this example, add a bar chart and select the Country field from the On Change Of drop-down list and the Sum of Order Amounts item from the Show Summary drop-down list. Change the chart title to read Total Order Amounts by Country—see Figure 1.23 for additional guidance. Click Next to continue.
Figure 1.23 The Chart dialog enables you to select a chart object for a report based on the previously identified group and summary criteria.
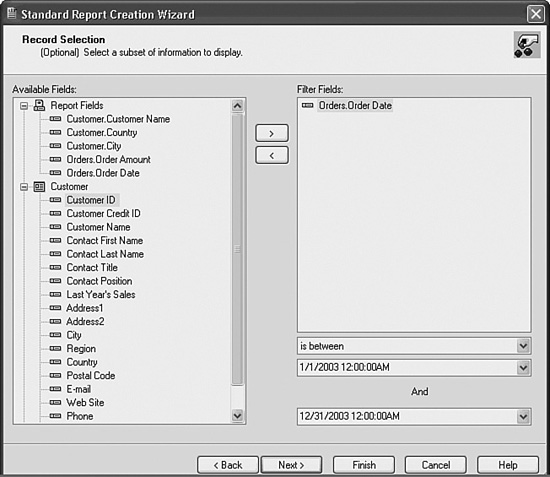
- Now you’ll address the fictitious requirement that you are only interested in customer orders from the year 2003. The Record Selection dialog screen enables you to identify selection criteria, often called data filtering, to focus the resultset of the report to include only the information you are interested in returning. To accomplish this, select Order Date as the Filter Field, choose Is Between from the filter operator drop-down list, and select a data range from the newly created date-range drop-down boxes to incorporate all the dates in 2003 (see Figure 1.24). Click Next to continue.
Figure 1.24 The Record Selection dialog permits you to narrow your resultset based on the selection criteria identified here.
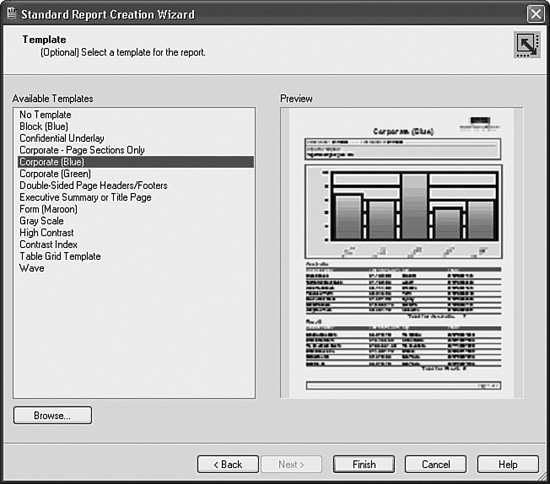
- Finally, apply a predefined style to your report. From the Template dialog screen, you can select predefined styles to be applied to your report for formatting purposes, as shown in Figure 1.25. The Available Template list includes various sample templates that are included with the Crystal Reports XI installation. However, you can also create your own templates to be used for report formatting. For this example, select the Corporate (Blue) template. For additional details on how to design and implement your own templates, see Chapter 14, “Designing Effective Report Templates.”
Figure 1.25 The Template dialog permits you to select predefined styles to be applied to your report.
This now concludes the Standard Report Creation Wizard example. After you click Finish, you will execute the report that you have just created and will be presented with the preview of the corresponding resultset. At this point, you can click Finish if you are satisfied with the report design criteria. When you are presented with the preview of your report, save your new report by selecting Save As from the File menu. Name this report Chap1Wizard.rpt or anything you would like.
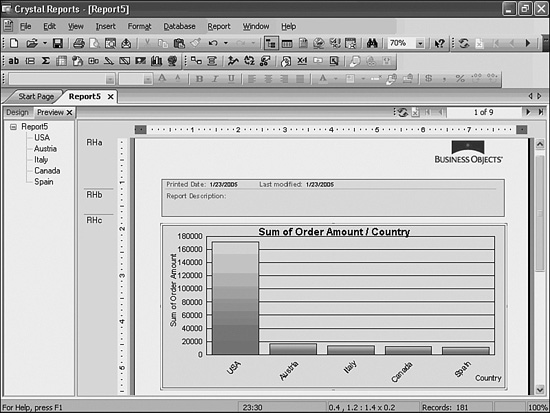
After you select Finish at the end of the Standard Report Creation Wizard process, you will be presented with the executed resultset and a preview of your newly created report. As Figure 1.26 shows, creating a useful and professional-looking report is extremely simple when using the Standard Report Creation Wizard. In the preceding exercises, you have connected to a database, identified the tables and fields you wanted to include in your report, linked the tables together, grouped and summarized the data, sorted the data, applied filtering criteria, included a chart object for enhanced visualization of the report results, and applied a report template for quick and easy formatting—all in just a few clicks of your mouse! This process speaks both to the ease of use and power of the Crystal Reports design application.
Figure 1.26 The executed resultset and preview of the report you have just created using the Standard Report Creation Wizard.
Creating a Report Without Wizards
As with many software tools, educational tools and facilitators like the Report Wizards are often the best way to begin a learning process. They are by their nature, however, limited in functionality and it generally does not take long before maturing students want to roll up their sleeves and discover the raw power and incredible flexibility that lies beneath. This section reintroduces the report just created in the Report Wizard through a manual design process in the Crystal Reports Designer. The beginnings of that same Sales Report are created from scratch with the following steps:
- Select a blank report. After opening Crystal Reports, select the New option from the File menu. From the submenu that appears, select the Blank Report option.
- Select an appropriate data source. From the Database Expert dialog that comes up, in the Available Data Sources list, browse to Create New Connection, ODBC. As soon as you choose ODBC, the ODBC (RDO) dialog pops up. Scroll until you find the Xtreme Sample Database 11. Select it and click Finish. (There are no other settings to get this database working, so you can ignore the Next button.)
- Select the appropriate tables. After choosing the appropriate database to connect to, you need to select the tables for this report. Move down in the left list box and expand the Tables item. Choose the Customer and Orders tables by using the right-arrow (>) button, shown in Figure 1.27.
Figure 1.27 The Data tab from the Database Expert dialog shows the two tables you just added to the report.

- Link tables from the database. Move to the next tab in the Database Expert dialog by either clicking the OK button or selecting the Links tab. Notice that all the tables have already been linked. Crystal Reports attempts to link tables using similar field names and sizes whenever possible. You can optionally turn off this automatic smart linking in the Database tab (accessed from File, Options).
You can enlarge this dialog by using the stretch markers so that you can increase the display area and see more tables at once. The next time you enter this dialog, your adjusted size will be remembered.
You don’t need to make any changes at this point, so just click the OK button.
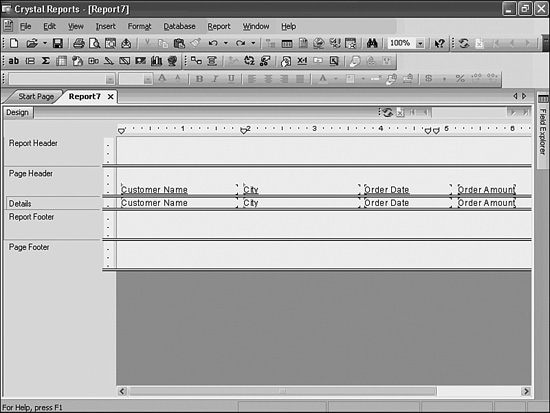
- Add detail records to the report. First, confirm that the Field Explorer is being displayed so that you can use it to add the fields to the report. If it is not, choose View, Field Explorer. In the Field Explorer that becomes available, open the Database Fields item and then the Orders and Customer tables to expose the fields that you’d like to add. Select each field separately and drag it to the Design tab using your mouse. Place them side-by-side in the Details Section: Customer Name and Customer City from the Customer table, and Order Date and Order Amount from the Orders table. Figure 1.28 highlights the desired result.
Figure 1.28 This is the Design window after you’ve added all the fields.
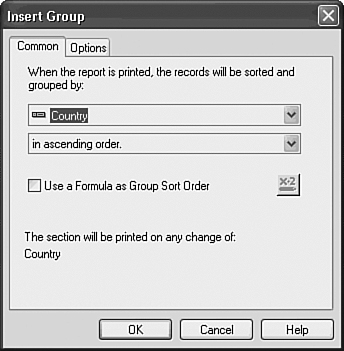
- Create a logical grouping of data by Country. To accomplish this, choose Insert, Group. When the Insert Group dialog appears, scroll down the first list box until Country under the Customer table is available. Select it, as shown in Figure 1.29, and then click OK.
Figure 1.29 The Common tab of the Insert Group dialog with the Country field selected.
Notice that in the Design view of the report, two new sections become available called Group Header #1 and Group Footer #1. Within Group Header #1, the Group Name #1 field is also automatically added.
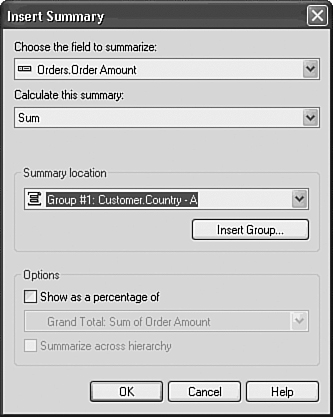
- Add a summary value of total Historical Order Amount by Country to the report. Choose Insert, Summary to get the Insert Summary dialog to appear. In this dialog, select the Order Amount field in the Field to Summarize drop-down box. Next, because you plan on finding out how much has been ordered in each country, you need to set the summary operation in the second list box to Sum. Last, because the desired summary is per Country, set the location of the summary to show Group #1, as shown in Figure 1.30. Click OK.
Figure 1.30 The Insert Summary dialog with Order Amount summed by Customer Country selected.
A shortcut to the Insert Summary command (and running total command described later) is accessible for each field on the report by right-clicking the involved field in the Report Designer.
Notice that in the Design view, in the Group Footer #1, the Sum of Order Amount field has been added.
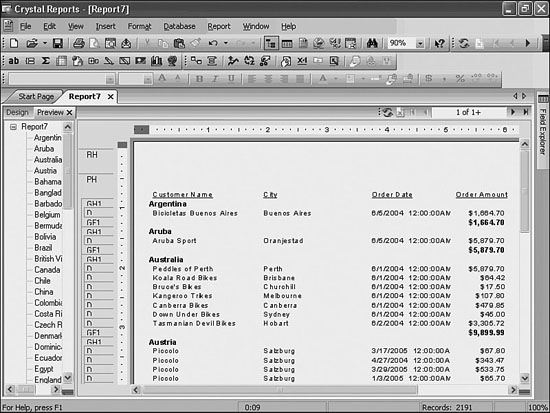
- View the report. Take a look at the report by choosing Report, Refresh Report Data or by either pressing the F5 key or clicking the Refresh button in your Crystal Reports Designer. A report with all the data represented in the last wizard-driven report you created is returned in the Preview tab as shown in Figure 1.31.
Figure 1.31 The resulting report based on steps 1 through 8 in the Preview tab.
- Save the report. Choosing File, Save opens the Save dialog. Provide a suitable name for the report, such as
Chap1Manual.rpt. You are welcome to explore the charting and report template features now to replicate the Chap1Wizard report but they are covered in detail in Chapter 8, “Visualizing Your Data with Charts and Maps,” and Chapter 14, “Designing Effective Report Templates.”
If you are concerned about losing work between manual saves of a report, Crystal Reports has an autosave feature that you can enable. Set this option by navigating to File, Options, and then selecting the Reporting tab. The Autosave Reports After option can be set and the length of time in minutes between saves can be specified in the edit box for this option.

Troubleshooting
I am having difficulty accessing the Database Expert.
To access the Database Expert for a new report, select File, New and select the Blank Report option or any of the Report Wizards. For an existing and open report, select the Database Expert from the main Database menu.
I want to update my Crystal Reports Installation with new patches.
To check for new updates in an on-demand mode, select the Check for Updates option under the Help menu. To have this handled for you proactively, select the Check for Updates on Start Up option under the same menu.
Crystal Reports in the Real World—HTML Preview
Mature report designers know that to ensure end-user happiness and to deploy reports with absolute confidence of expected results, it is critical to preview the report in the desired distribution format. Because many reports are distributed through the Web and a DHTML viewer, Business Objects has added a new productivity feature in XI called HTML Preview.
To see an HTML rendering of a Crystal Report design as it will appear when published to the Web, click the HTML Preview button on the Standard toolbar, or select HTML Preview from the View menu. Unlike the standard Crystal Reports Preview tab, the HTML Preview tab shows a converted format. By calling up both the Preview and the HTML Preview tabs, you can quickly preview your web-distributed copy of the involved report and make rapid adjustments to yield ideal web results.
The Preview HTML feature is available when reports are published to Crystal Reports Server or BusinessObjects Enterprise. In the case of reports that are published to either of these web distribution environments, no configuration is required and the HTML Preview feature works automatically.
The feature is also available for standalone reports if you use the Report Application Sever (RAS) to generate the preview. To enable the feature in this situation, configure the HTML Preview feature under the Smart Tag & HTML Preview tab of the Options dialog box in Crystal Reports. In this tab, you need to specify the involved web server, platform, virtual server URL, and RAS server.
Crystal Reports in the Real World—SQL Commands
Experienced report developers will notice that the sample database is very simple (only a dozen tables) and that all the fields in the tables have useful names. In practice, it’s very common for a database to have many more tables with very complex relationships and field names that are not descriptive. This is where SQL Commands can help. This section explores the advantages of using SQL Commands to create reports. To take SQL Commands for a test-drive, follow these steps:
- Open Notepad and type the following lines of SQL exactly as they appear here:
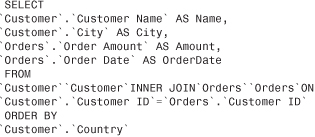
This is the SQL statement that will be used in the report.
- Select a blank report. After opening Crystal Reports, click on the New option from the File menu and select Blank Report.
- Select an appropriate data source. From the Database Expert dialog that opens, in the Available Data Sources list, browse to Create New Connection, ODBC. As soon as you choose ODBC, the ODBC (RDO) dialog pops up. Scroll until you find the Xtreme Sample Database 11. Select it and click Finish. (There are no other settings to get this database working, so you can ignore the Next button. These additional options will be discussed in a later chapter.)
- Rather than selecting tables, double-click the Add Command option. The Modify Command window pops up. Copy the SQL Command from Notepad into the box as shown in Figure 1.32.
Figure 1.32 The Modify Command window with the SQL Command pasted into the text box.
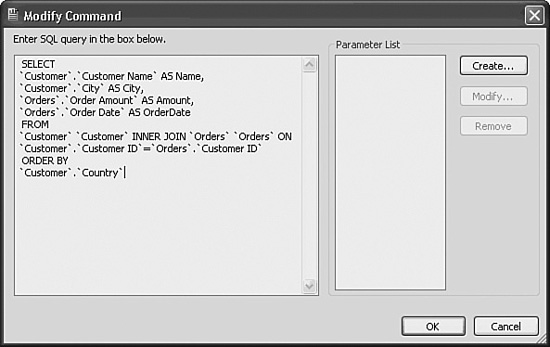
Click OK; notice that there is no need to link the tables because the SQL Command already defines the relationship between the tables. Notice also that there are only four fields to choose from and that the names have been changed.
The SQL Command does four things:
- Hides database complexity. Converts many tables into one view with the table relationships defined.
- Hides unnecessary fields. Many database fields are ID fields that simply aren’t intended to be seen by users. The SQL Command can be constructed so that these fields don’t pass through.
- Renames database fields. Database field names are often unreadable and give no hint about what they contain. The SQL Command can rename these obscure names into something more meaningful.
- Empowers SQL Experts. If you are a SQL Expert or have them in your organization, you can leverage their expertise in creating optimally performing SQL through use of SQL Commands.