
Chapter 18 Using a Semantic Layer—Business Views and Universes
Introduction to Semantic Layers 398
Introduction to Business Views 399
Differences in How CR/WebI Use Universes 420
Differences with Business Views and Universes 421
Introduction to Semantic Layers
The semantic layer is a metadata layer that abstracts the complexities of the data source. The end user sees only a logical grouping of available, well-named fields for use and does not have to concern herself with the intricacies of database design or need any SQL knowledge.
In Business Objects XI, two semantic layers are supported—business views and universes. With the merging of Crystal Decisions and Business Objects, a decision was made to keep business views from Crystal Decisions and universes from Business Objects. The author predicts that in future releases there will be only one supported semantic layer that will have the best components of both products. Currently, however, Business Objects has made a commitment to support both business views and universes.
Why Use a Semantic Layer
Semantic layers offer tremendous advantages over traditional report design processes by removing the most difficult data-intensive tasks, as described in the following sections, from report design. Furthermore, it allows for reuse of components and promotes the concept of changing a component once and having the change applied to multiple reports.
Abstract the Complexities of the Database
With large complex data warehousing projects using many tables and complex joins, the report author might not have the requisite knowledge. If the report author is required to join the tables for the reports, he might not use the most efficient join, resulting in poor performance. Semantic layers allow for a division in labor, whereby the more technical database administrators and developers can create the joins between tables and data sources and the business users can concentrate on designing reports to satisfy their requirements.
Putting Report Design in the Hands of Business People
As a result of this division of labor and the reuse of the Business Objects repository, business people do not have to be as technically savvy, effectively resulting in less technical skill being required to develop reports.
Support for a Wide Range of Data Sources
Both metadata layers provide a wide range of database support, including the majority of relational database vendors. Business views also include the ability to connect to some nonrelational data sources; for example, a user could abstract the complexity of an XML file by encapsulating the XML with a business view.
Reuse of Metadata Components
One major drawback to specifying the data joins in each report is that this creates a large amount of redundant work. Secondly, should the database change, there is no way to effect this change other than changing each of the individual reports. A semantic layer allows the administrator to create this join once and should this join change, the administrator only needs to change it once.
Security
The semantic layer allows the administrator to set up security so that data is filtered based on who the user is. This can be based off of security within an entitlements database, or the Business Objects user model can be used to create the security model. This way rows and columns can be secured by users or groups.
The Business Objects repository also secures the semantic layers and only those users with the required permissions can access them. For example, it is generally accepted auditing practice that accounts receivable personnel should not be able to see accounts payable information and vice versa. By using the user group functionality in Business Objects Enterprise, the accounts receivable group would be given access to only the accounts receivable semantic layer.
Transportability
The semantic layers provide the ability to export a business view to an XML file or a universe to an .unv file. These files can then be easily imported into another Business Objects Enterprise repository. This simple form of transportability makes semantic layer swapping a simple exercise. It also simplifies the storage of source code, should the organization have a source code storage requirement.
Introduction to Business Views
Business views are multitiered semantic layers that sit between report authors and end users and their respective data sources. These layers allow the complexities of the data source to be abstracted into logical groupings of the fields or business views.
The architecture provides multiple tiers with each tier performing a different function. This multitiered system is broken down into three layers: the client, business, and data tiers.
The semantic layer is optional. In certain circumstances the costs of building a semantic layer outweigh the benefits. Crystal Reports XI still provides you the flexibility to use a semantic layer, or to access the data source directly, or use any combination of the two. For example, an organization upgrading its reports from earlier versions might be satisfied with the current state of its implementation and hence might never use a semantic layer. Crystal Reports XI even allows for a combination of semantic layer access and direct data source access via subreports.
Client Tier
The client tier consists of the applications that interact with the business views, in particular, Crystal Reports XI, Live Office, and InfoView.
Business Tier
The business tier consists of the components to create and manage the business views:
- Business View Manager
- Data connections
- Dynamic data connections (optional element)
- Data foundations
- Business elements
- Business views
- Dynamic and cascading prompts and prompt groups
At each component level, different security rights can be applied to the components and security setup. This provides great flexibility as to who controls which component. For example, a database administrator (DBA) can set up the data connections and data foundations, but have no rights to view the business element and business view layers.
There is functionality within certain components that might give users access to view the data. For example, when creating a data foundation, the user can browse the data, which will give her a better understanding of the field. If you do not want her to be able to do so, you need to explicitly remove her rights.
Business View Manager
The tool used to manage the business views and the repository is the Business View Manager, a Windows-based development tool that can be installed locally on the developer’s or administrator’s Windows workstation. The Repository Explorer allows the user to manage the Business Objects repository. To show the Explorer, click the View menu from within the Business View Manager and then check the Repository Explorer. To reiterate, the objects that can be stored in the Crystal repository are
- Business views
- Command objects
- Custom functions
- Images
- Text objects
It is worth describing some of the functionality of the Repository Explorer because it can become quite large in larger projects, with multiple users adding objects simultaneously. There are certain features that can simplify navigation and security when dealing with many objects.
Sorting Items in the Repository Explorer
As a content creator, you need to navigate quickly and effectively through the repository to reduce content development time. Below are some techniques to aid in the organizing of the Business Objects repository:
- View setting allows the user to filter objects by item type and then sort the object by name or type.
- Advanced filtering turns on filtering by author or filters objects by entering text. Only those objects with the associated text in their names will be displayed.
- Users can add or delete objects or folders, depending on their permissions. Creating your own folder structure can be an efficient way of organizing the repository.
- Before deleting and after adding objects, a user can check his dependencies from the standpoints of what might be dependent on that object or what that object might depend on. For example, if the user creates a data foundation, he can check what data connections it is dependent on by clicking the Show Referenced Objects icon, or the user could check what depends on this object by clicking on the Show Dependent Objects icon.
Setting Security of the Repository
The repository security is controlled via the Repository Explorer found in the Business View Manager. It works on an inheritance mechanism, whereby an object inherits the security settings from its parent and is designed so administrators do not have to set the security for every object. For example, you might have an administrators group that has view, edit, and set security rights, another group called Content Creators that has only view and edit rights, and another group called Everyone that has only view rights. Alternatively, objects can inherit security from the folder they are published to. If you set the security of the root folder, any folders created under the root folder will inherit the root folder’s security.
Data Connections
The data connection component is where the user establishes a connection to the data source. The setting up of the connection component is similar to the setting up of a connection in Crystal Reports and, in a lot of cases, uses the same drivers and dialog boxes. The user can enter in a username and password. This is the username that will authenticate against the data source and the username and password are then stored in the repository.
Join Disparate Data Sources
Data in corporations typically sits in multiple data sources. A requirement might exist to pull information from multiple data sources and consolidate this information in a single report. A business view enables the administrator to join disparate data sources together or to link two universes together.
Dynamic Data Connections
Organizations typically have two or three environments. Most have at least a test/development environment and a production environment. In some cases, the test/development environment is split into separate environments. During the development process, reports are developed against the test environment, tested against the test environment, and finally put into production. In prior versions of Crystal Reports, the report had to be opened and the data source mapped to a new data source. Business views can switch data sources dynamically through the use of dynamic data connections. This creates a Crystal Report parameter that prompts the user to select his data source. Alternatively, the report designer can use logic to switch the data source. For example, an organization may have a production database and periodically archive data to an archive database. The report developer can programmatically swap data sources to the archive database, based on the date entered for the data that the user wishes to view.
Using dynamic data connections, users can easily switch data sources at runtime, yet maintain a single report.
The dynamic data connection is an optional component. If the dynamic data connection component is used, the Crystal Report automatically has a read-only parameter created. The parameter’s name consists of the data connection’s name, concatenated with the dynamic connection parameter, and the parameters available selections consist of the various database options.
The dynamic data connections are useful for quickly moving from development to test environments. They can also be used to change languages dynamically; for example, if there are English and French databases, the user can switch between the two. However, bitmaps and text objects do not automatically switch and the report designer needs to have one for each language.
If the database is designed with a column that designates language (hence, there would be a row in the table for each language), a row-level filter is required. This is described in the later “Filters” section.
The Data Foundation Component
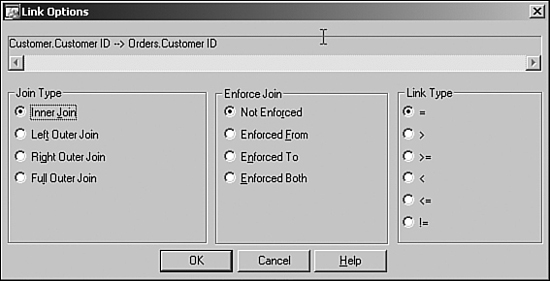
The data foundation component allows the user to join the various tables exposed by the data connection(s) or dynamic data connection(s). The user would typically have knowledge of the data structures and correct joins. To join a table to another table, simply drag the field from one table to the corresponding field in the other table. The data fields need to be of the same type for the join to be successful. Right-clicking on the join and selecting the link type allows the user to change the join type, as shown in Figure 18.1. The correct joining of the tables, especially when there are multiple disparate data sources involved, is vital from a performance standpoint and for ensuring that the correct data is returned. Related to this is the ability to order the links. The user can set the linking order the business view will use by selecting Order Links from the Linking Diagram menu. In addition, link enforcement can be vital to correct implementation of security filters. For instance, the filter that determines row-level permissions might require information from a particular table. However, if that particular table is not used in the report, you need to force the use of that table to ensure correct filtering. In that case, you can set join enforcement to result in the correct behavior.
Figure 18.1 Double-clicking a join in the data foundation will display the join type.
Data warehouses can have hundreds, sometimes thousands, of tables. The data foundation component can become complex to manage. Following are some pointers to aid in the management of the foundation:
- Map only the tables from which you require information—A common mistake is trying to map all the tables in the data warehouse. This might sound obvious, but you might require information only from certain functional areas of the data warehouse and hence you need only to map those tables.
- Keep it simple—It generally requires less effort to go from simple to complex than complex to simple. Bite off as much as you can chew, work out the relationships, test, check performance and expected data results, and then take another bite.
- Use indexes—For performance reasons, try to join indexed fields (indicated by a colored icon to the left of the field) and have the database do the work, as opposed to the business view. Because indexed fields are much faster to find at the database level, the database can return data much faster, especially in large tables, if the fields used for the join are indexed.
In some cases the index pointer does not appear next to the indexed field. Select the Fetch Table Indexes from the Linking Diagram menu to make these appear.
- Keep the number of retrieved records to a minimum—The data foundation allows the user to create SQL expressions and formulas. SQL expressions are evaluated at the database level, whereas in many cases the formula is evaluated by the Business Objects Enterprise server. The number of records retrieved can be reduced significantly by having the database filter the records based on a SQL expression rather than a formula, effectively pushing the filter into the query itself rather than retrieving all the data and then discarding the unnecessary portion.
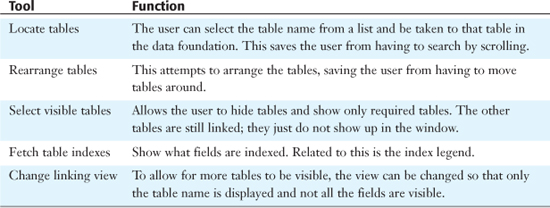
- Use the tools available in the Business View Manager—A number of tools, described in Table 18.1, are applicable to the data foundation and allow for management of the tables within the business view. All of these can be found under the Link Diagram menu.
Table 18.1 Available Tools for Managing the Data Foundation
SQL Expressions
Within the data foundation components, the user can create a SQL expression. A SQL expression is a SQL statement that is executed on the database. It is typically used to create data fields that do not exist in the database. A good example of using SQL expressions is to join disparate data sources where one of the data sources is missing a relevant field to join on. For example, you might have a database where you want to join a numeric Vendor Number ID field to a Vendor Number field that is of type string in the other data source. In this case, you can create a SQL expression that converts the Vendor Number to a numeric field so that the field types can be joined.
The administrator has the ability to set security on the SQL expression by right-clicking the SQL expression and selecting Edit Rights. See the earlier “Security” section for more detail on setting security.
Formulas
In some cases the database SQL might not support the required functionality, or a calculation might be required using fields from disparate data sources. In this case a formula can be used, as opposed to using SQL expressions. For example, you might have a quantity shipped number coming from a Shipping database and a price field from an Orders database. In order to see the total value of orders shipped, these values could be calculated in a formula.
The administrator has the ability to set security on the formula, and any other object, by right-clicking the formula and selecting Edit Rights. See the earlier “Security” section for more detail on setting security.
Custom functions stored in the repository can be added to the data foundation and reused within formulas.
Parameters
The user can create parameters at this level to use at the business element level. The parameter can be either static or can make use of list of values or a prompt group. Static parameters are better suited for values that do not exist in the database and are manually entered by the user or the business view designer. Dynamic parameters are better suited for getting the list of values from the database. Implementing parameters at this level ensures reuse and consistency across all your reports.
Filters
Business views use filters to select the data based on a particular logic. In some cases the logic prevents too much data from being returned to the user. For example, the user might be interested in seeing data from the manufacturing division only. Another case might be that the user is not allowed to see the row of data based upon some business security requirement. This is commonly called row-level security. To achieve this, the business view creator makes a filter, or multiple filters, and concatenates them together using either AND or OR logic. He must make sure that the logic is correct. Users can filter data using fields, SQL expressions, formulas, other filters, parameters, Boolean logic, or a special Crystal Reports field called Current CE User. The user right-clicks the filter and selects either the user or the group the filter needs to apply to. By default, the system creates a Full Data Access Filter and a No Data Access Filter. These are the two extremes—an organization’s security will typically fall somewhere in between. For example, the Accounts Payable department or group might have a filter that filters the transaction type to Accounts Payable.
If the organization is not using business views or wants to quickly filter a report without having to set up a business view, {CurrentCEUserID} or {CurrentCEUserName} can be used with the Record Selection formula of Crystal Reports.
Associated with row-level security is the concept of column-level security. In this case, the column’s data is displayed or not displayed based on certain business logic. For example, if you belong to the Human Resources group, you might have permission to see the Identity Number or Social Security column. All other groups would not have access to that column; however, they can see the rest of the report.
In order to enable the column-level security, right-click on the field in the Object Explorer and select Edit Rights. Select the group or user you want to deny or grant access. A user’s net rights can be determined using the Rights Test View described in the Business View section later.
Business Elements
Business elements provide a layer on top of the data foundation. It is at this level that the developer can further abstract the complexity of the database by aliasing the fields with business terminology and logically grouping these fields around business requirements. Here is where the division of labor might occur between technical- and business-oriented focuses. In other words, the business-oriented person might want to start renaming the fields to business terms.
When creating a new business element, the Business View Manager prompts the user for a data foundation. Select the required one. Insert the required fields for the business element. The business element allows for a logical grouping of the fields. For example, the business elements might be designed based on a division or department, such as an accounts payable element.
Applying Changes at the Business Element Level
Making changes, such as security, at this layer will only affect this layer and will not affect the underlying data foundation layer. However, changes made at the data foundation layer will be added to any changes made at this layer. For example, if you denied a user the right to see the Country field at the data foundation level and now you deny the same user the right to see the Region field, when the user runs the report he will see neither the Region nor Country fields. This illustrates the flexibility in making changes for certain business groups without creating multiple similar data foundations.
Business Views
Finally, you can collect business elements into business views. A primary consideration is that a business view must contain business elements derived from the same data foundation. Stated differently, a business view can contain data from only one data foundation.
At this stage in the architecture, the appropriate filtering has been performed and the business view is a cumulative view of all the underlying components.
For example, assume that the database contains multiple company numbers, each representing a separate organization as part of a large conglomerate. The administrator could set up the data foundation and filter by each company number, assigning only that company the rights to the data foundation. Within that specific company, there might be multiple sales departments. This could be defined in a business element; once again, a filter is applied at this level so that only the associated sales department is seen by the relevant personnel. The business view combines the business elements to provide a view of data. This view will be filtered by relevant company and by relevant sales department, which is the cumulative effect of the layers.
To create a new business view, the user can select the New icon, and select a new business view, or from the File menu, select the business view. Select the business elements that are going to be part of the view and save the view.
By right-clicking on the view in the Object Explorer, the user can set the rights to the business view. In this case the rights refer to who has rights to edit, view, and set security on the business view.
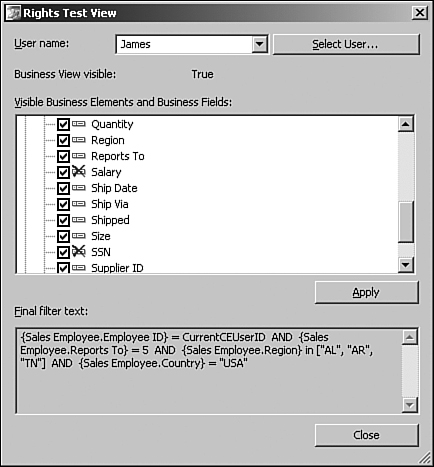
The Rights Test view, shown in Figure 18.2, allows the content creator to check each user’s net rights for the visible fields. If column-level security is applied, the field has a red cross associated with it and will appear as a NULL value to Crystal Reports. How Crystal Reports is set up to handle the NULL value determines what is displayed. As far as the row-level security is concerned, the cumulative total of all the filters is applied, from both the Element and Foundation levels and is shown as the final filter text.
Figure 18.2 Rights Test View showing the final column- and row-level filters that will be applied for the selected user.
Dynamic and Cascading Parameters
Crystal Reports XI introduces the concept of dynamic and cascading parameters. The ability to dynamically query a field in the database for a list of values and then filter the list of values for the following parameter based on the prior selected value is now supported within business views. However, business views add one further dimension—the ability to schedule the list of values on a predetermined basis, prepopulating the list of values.
After the user has created the parameters, she can group them logically in the form of prompt groups. The user only has to select the prompt group to apply all the parameters within the group.
Data Tier
The final tier of the architecture is the data tier. This consists of all the data sources available to the business view. The available set of data sources changes depending on the platform Business Objects Enterprise is installed on.
Please check the documentation, specifically platforms.txt (found on the Business Objects Enterprise CD), for a list of available data sources for your install.
http://support.businessobjects.com/ provides a searchable knowledge base for related patches (hot fixes), knowledge base articles, and technical papers.
Introduction to Universes
The idea of the universe is to capture and encapsulate elements of the database as objects, and that these objects can be selected in any combination by a business user to answer a question (hence, the company name Business Objects). This concept of providing an abstraction of the physical data layer was developed and patented by Business Objects in 1992. Since that time, the semantic layer has been continually enhanced and developed in conjunction with the reporting engines to provide a very simple yet powerful user experience for creating ad-hoc reports, interacting with reports, and performing analysis of the data. The overall design paradigm is to provide ease of use for the ultimate consumer who is assumed to be a nontechnical business user.
The universe itself contains no data; it is a file containing the pointers to the data. The universe is utilized by the reporting engine to generate Structured Query Language (SQL) queries according to the object definitions and other rules defined within the universe. In Business Objects XI, it is used by the Web Intelligence engine to generate all the SQL for any report requests. The Web Intelligence engine executes the query and creates the report, and will continue to use rules and definitions of object relationships defined in the universe to allow for interactive exploration and analysis of the data (more on this in Chapter 20, “Introduction to Web Intelligence”).
Because the semantic layer paradigm is so applicable to any reporting tool, the universe was easily integrated with Crystal Reports 10. As of June 2004, with the release of the Business Objects Crystal Integration Pack, the universe can generate SQL for Crystal Reports. This integration was continued and enhanced in Crystal Reports XI.
Universe Objects
The universe contains several object types that are represented with different icons. The object types represent different relational concepts and are used by the reporting engines in different ways.
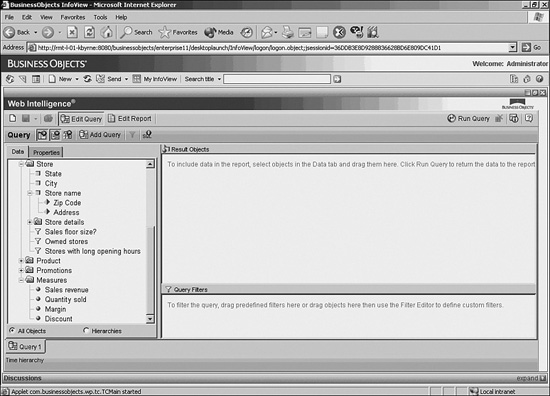
The universe is accessed by the end user through a query panel. The query panel provides a drag-and-drop interface where business users can select, in any combination, the objects they want to see, provide conditions for the query, and then execute the query. The report engines review the objects chosen and, based on the semantic rules defined in the universe, generate appropriate and correct SQL on the fly.
Figure 18.3 shows the Web Intelligence query panel. Note the four object types in the preceding table appear in the left frame. Users see these objects (business objects) and can randomly select any combination by dragging and dropping them in the Result Objects frame on the right. The universe provides the logic for correct, sophisticated SQL generation based on any combination of objects.
Figure 18.3 Web Intelligence query panel.
The query panel will be discussed in detail in Chapter 20.
Creating the Universe
Universes are created in a separate module known as the Designer. The Designer is a client/server tool installed on the desktop of only those who create the semantic layer. This is generally an IT function. The universe is created with this tool and then exported to the Central Management Server (CMS) database or InfoStore, where it is accessed by the Business Objects Enterprise infrastructure and the Web Intelligence or Crystal Reports engines. Other Designers can also access it and enhance it, and re-export it back to the InfoStore. As with business views, there is currently no version control mechanism for universes. However, each time a universe is re-exported to the CMS the internal universe revision number is incremented.
The Designer tool requires authentication via the CMS and the proper rights to access the Designer module. After authenticated, the Designer provides the capabilities necessary to create the universe semantic layer and associated data rules used by the query engines. Figure 18.4 shows a diagram of a universe open in the Designer module.
Figure 18.4 The universe is open in the Designer.
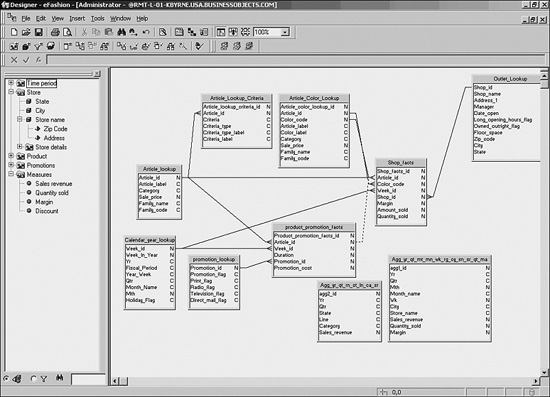
Note that the same objects are showing as in Figure 18.3. The right pane shows the database schema and possible joins defined by the universe creator; the left side shows the objects visible to the end users via the query panel. Users will never see the underlying database structure, only the objects and classes in the left pane.
The window is divided into two main sections. The right side of the window is called the Structure Pane and shows the tables and views of the underlying database, along with any derived tables and joins defined with the Designer. The left side of the window is called the Universe Pane, and shows all the objects exposed by the universe. The Universe Pane also shows the object classes (often incorrectly called folders) that are arbitrary groupings of objects to best fit the user requirements. There is no requirement to group objects from the same table in the same object class. Classes can contain subclasses as well as objects, and objects can live at any level of the class/subclass hierarchy, but must be contained within a class/subclass.
As a best practice, objects are generally separated into classes according to dimensional groupings known as subject areas. For example, all of the time objects (Year, Month, Week, Day, Hour, and so forth) are put into a Time class; likewise, all customer elements are grouped in a Customer class and so forth. Measure objects are also placed in a single Measures class that is often the last top-level class in the tree. This is not a required grouping but is the convention used and taught by Business Objects.
In order to create a universe, a preexisting universe connection must be selected from the InfoStore or created via the Designer. The universe connection is an object in the InfoStore that defines the connection information to the underlying database. It specifies the RDBMS and version, username, password, and middleware type and version. It is encrypted and stored in the InfoStore and used by the Web Intelligence engine or the Designer module when generating SQL.
The connection can be static or “dynamic” (based on some parameter such as the logged-in user); there is no differentiation of static or dynamic data connections, as there is in business views. Universe Designer does not support true dynamic connections, but allows for restriction set creation that can switch between identically formatted databases based on current user and/or group identities.
Unlike business views, the universe has one and only one connection. The Web Intelligence report engine can accommodate multiple resultsets, so reporting can alleviate this somewhat (see the “Microcube” section).
Object Definition
The object itself contains a SQL snippet representing the piece of the database the object reflects. For example, if the database contains a customer table, there might be a dimension object called Customer Name that contains the definition customer_table.last_name. If, for example, the business user would prefer the first name and last name, the object definition can be redefined as customer_table.first_name + “ “ + customer_table.last_name.
Object definitions can be defined using any of the native database-specific extensions (such as CASE, CAST, DECODE, DATEPART, and so on). This allows for the development of quite complex objects. The universe supports all native RDBMS-specific SQL extensions, as well as any custom database functions developed in-house.
Dimension objects can be defined to exist in a dimensional hierarchy. A dimensional hierarchy defines natural parent-child relationships within the data. The most common example of a hierarchy is Time, which is often defined in the following hierarchy: Year, Quarter, Month, Week, Day, and so forth. The hierarchy mechanism is used by the Web Intelligence reporting engine to provide drill-down capability. With a universe, drill down refers to exploring data at some level below the current level of aggregation. In other words, when looking at Sales for the Year, a user can drill down to look at Sales by Quarter, and from there drill down to look at Sales by Month. Users can also drill up (move up a level in the dimensional hierarchy) and drill by (swap the presentation to other dimensions in a completely different dimensional hierarchy). More discussion on drilling can be found later in the “Microcube” section, and in more complete detail in Chapter 20 in the “Drilling” section.
Measure objects are almost always defined with aggregate SQL functions such as sum, count, max, min, and so on. Although not required, the universe design is such that aggregate functions are preferred in the object definition because this often engages more appropriate SQL optimization on the underlying RDBMS. It also returns smaller resultsets that should aid in a better total request and response time during an ad-hoc request.
In general, database optimization is more important in providing user-expected performance for an ad-hoc application than it is in straight enterprise reporting. Most enterprise reports are generated prior to actual report consumption, such as during off hours in a batch process, so runtime and processing time are less important. Put another way, the computing necessary for report processing does not happen right before report consumption by the user. In an ad-hoc application, you can assume that the query requests happen during the actual report consumption (users are actually generating and executing the SQL requests at the time of report consumption—not in batch). The users expect maximum analytical flexibility and minimal response time—easier said than done, especially because by definition an ad-hoc reporting application does not know what SQL requests will be made (hence ad-hoc). The best practice for developing and deploying successful ad-hoc applications is to gather extensive user requirements to understand why the business users are asking for the data and what they do with it next, and then build an appropriate model to support those requirements.
Universes are extremely flexible, and many of the universe mechanisms (contexts, aggregate awareness, short-cut joins, aliases, and so forth) can be used to ensure that proper SQL is generated on any model type. Universes do not require underlying star schemas and can be deployed on any underlying supported database regardless of the model type. However, if the goal is to provide maximum analytical flexibility, proper data modeling cannot be avoided. Often times a universe will be used as a cheap and easy way to provide business users access to transactional systems. If ad-hoc data analysis was the goal of the business sponsor, placing a universe on the transactional system means the reporting application is not designed properly, most likely because proper requirements were not gathered and a model analysis was not completed. This often results in slow performance, or IT re-entering the project to develop reports for the business because the universe is overly complex and not business centric. In other words, if you expect to slap a universe on top of a transactional system without doing a proper requirements-gathering and then let your business users try to do data analysis, no one will be happy, especially your DBA. The most important thing IT can do to ensure success of an ad-hoc or analytic application is to gather proper requirements.
SQL Generation, Contexts, and Aggregate Awareness
Based on the objects selected by the business user via the query panel, the universe determines which tables are necessary and the optimal join paths between these tables, as defined in the Structure Pane. The universe might contain multiple routes, or join paths, between any two tables. This is most evident in a star schema where multiple fact tables exist (but would apply in any model type). For example, say you have a universe to perform expense analysis, and there is one fact table containing the budgeted amounts along the organizational hierarchy and the time hierarchy (resulting in budget amount by department and by month) and there is a second fact table with the actual daily figures spent by all employees. You might then want to join the time and organization dimensions directly to the budget fact and actual fact. When the business user engages the universe via the query panel, she might want to see the budget amount and actual amount per month for her department. The universe employs a rule called a context that is a grouping of tables and joins that dictates proper join paths based on the object selection. In this case, there would be two contexts, one for the budget figures and another for the actual expenses. This tells the SQL engine that two SQL statements need to be generated in order to get proper results—one with time, organization, and budget, and the second with time, organization, and the actual expenses. The results are then rejoined together within the reporting engine (Web Intelligence) to present a single result set.
Another feature of the universe is the use of aggregate awareness. Aggregate awareness allows for the inclusion and use of aggregate tables where possible, and use of lower-level tables where appropriate. To further the expense analysis example, suppose that the DBA has aggregated the actual expense data at the month level and by department. This means there is an aggregate of actual expenses, but the atomic-level fact table also exists (which lists each and every expense by employee, expense type, and day). If the business user chooses department, month, and the expenses amount, the aggregate awareness tells the universe that the query can be handled by the aggregate table and to use it instead of the atomic-level table. This can have a great benefit on query performance. Furthermore, if the business user drills down a hierarchy that leaves the aggregate (say from month down to day), the universe is smart enough to know that a new SQL statement needs to be generated and that now it should execute against the atomic-level table.
The Microcube Engine
The Web Intelligence engine contains tight integration with the universe. One of the main points of integration is the storage of the result set in a multidimensional array commonly called the microcube or microcube engine. The cube part of microcube implies multidimensionality (a cube of data rather than a flat table). The micro part of microcube distinguishes it from a macrocube that is a full-fledged multidimensional database (MDDB), such as Essbase, DB/2 OLAP, Oracle OLAP, or MS SQL Server Analysis Services. The microcube is mentioned here in the “Universes and Deployment” section, but is demonstrated in Chapter 20 on the Web Intelligence Reporting engine in the “Drilling” section.
Without understanding the microcube, you cannot fully appreciate how the universe features actually benefit the business user, other than providing a mask for SQL generation. Because the universe knows that the objects are dimensions, details, or measures, these object types can be used to provide for additional methods of post-query processing by the microcube engine. This means the result set that comes back can be processed further simply based on the definition of the result set’s originating object type. For example, if a query asks for Year, Quarter, Month, and Actual Expenses, the result set is returned to the microcube engine, which then further notes that Year, Quarter, and Month are dimensions, and Actual Expenses is a measure. It also notes that Year, Quarter, and Month are part of a dimensional hierarchy that can be drilled, and that the Actual Expenses measure object is defined with a projection that tells it to sum when projected. A projection is a behavioral indicator for the measure when placed in the microcube.
When a user displays the data in the report as Year, Quarter, Month, and Actual Expenses columns in a simple table, the user sees a row containing the results just as they were returned from the database. However, if the user removes the Month and Quarter columns from the table, the Actual Expenses value changes dynamically to reflect the value for each year. The measure is “projected at the Year level” because the object definition tells the microcube that it should sum the measure when viewing the measure with any combination of dimensions other than all dimensions returned in the result set.
Additionally, if the user then drills down on Year to the Quarter level, a drill filter is created on Year and the report block displays the quarters and projects the Actual Expenses at the Quarter level. So the drilling capability provides for both proper navigation and projection of dimensions and measures by the microcube.
There are two important things to note here. First, this paradigm is different from Crystal Reports, in which drilling or moving between levels of data requires the creation of subreports. With the microcube, the table, grid, or chart display of a Web Intelligence report is referred to as a report block and there is no concept of bands or banded reporting. What is seen in the report block is the projection of the microcube, which is completely dependent on the objects displayed in the report block. The report often contains more data (additional objects) than is currently projected; generally, the user will use the current projection in the report block as a starting point to navigate through the data. The data dynamically changes as the user interacts with it, drilling up and down or swapping objects into or out of the report block. This might sound terribly confusing but is made clearer in Chapter 20, where more time can be given to this discussion.
Second, the semantic layer does more than query generation—it provides for sophisticated post-query behavioral rules for the reporting engine. It not only tells how to get the data and how to get it with the most optimal SQL, but also how the data should behave after it is presented for analysis to the business user. This is crucial to ensuring that the business user does not manipulate the data in ways that would lead to incorrect results (an overarching theme with the semantic layer).
The microcube also provides a few additional benefits:
- Recombining results of multipass SQL—In certain conditions, such as the one described previously for requesting budget and actual expenses, a question from a business user needs to be broken into multiple queries or multiple passes to the database. The semantic layer automatically generates these multiple SQL statements. When the result sets are returned, the microcube allows for these multiple passes to be rejoined conceptually into a single result set that can then be projected for analysis via the microcube. The microcube knows that the dimensions between these two queries are really representations of the same objects and therefore the microcube will synchronize rows with common dimensions, which can then be projected in synchronization. This is done automatically by the Web Intelligence report engine. This also allows for formulas to be built on these measures as if they existed in a single flat table result set (budget minus actual expenses, for example).
- Multiple queries—A Web Intelligence report is the projection of part of the multidimensional array or microcube. The Web Intelligence engine allows for multiple microcubes to exist within a single report file. This means that a report can contain data from multiple universes that could be based on completely different RDBMS platforms.
In the multipass SQL example just discussed, the result set is considered a single data provider by the report engine, even though it is multipass; this is because it originated from a single query panel request. Multiple data providers come from multiple query panel requests (one data provider per request).
Universes and Deployment
In order for a universe to be utilized by others, it needs to be published as a resource in the CMS. The Designer module will export the universe, meaning it will export the .unv file from the desktop to the CMS, where it is stored in a folder for distribution. From here, other Designers can download the universe or import it to their desktop. Likewise, the Business Objects Enterprise infrastructure can access it for use with the Web Intelligence and Crystal Reports reporting engines. The universe is automatically downloaded to the Business Objects Enterprise infrastructure when the first user requests usage of the universe. It is cached on the Web Intelligence server to avoid having to retrieve it from the InfoStore for every successive user request.
Semantic Layer Overrides
After the universe is an InfoObject in the InfoStore, data security overrides can be applied to the semantic layer. The idea behind these overrides is to supply a semantic layer that provides access to the database in general, but can also restrict the access based on user or group profiles. Because the universe is designed for ad-hoc usage, the user should be prevented from asking any questions he should not be able to ask. And because a user’s questions cannot be known prior to asking them, the security restrictions need to be applied to the semantic layer for that user. The semantic layer applies these security overrides when appropriate during SQL generation.
The most common semantic layer override is row restriction. This is accomplished by forcing WHERE clause usage within the universe. For example, say Joe belongs to the Eastern sales region, and Joe should only be able to see data from his region. Because you cannot predict what queries Joe will ask ahead of time, you want to ensure that any SQL he generates will have a restriction added, limiting him to Eastern region data only. In SQL this might appear as WHERE Org.Region = 'East'. With this clause applied, whenever Joe creates an ad-hoc query, he will be limited to only Eastern region data. If you wanted to limit a group of Eastern region users to the same data, you could apply the WHERE clause restriction to a group and place all users within the group, where they would inherit the override.
Other semantic layer overrides are
- Object hiding—Restricts users from seeing certain objects (column-level security).
- Table swapping—Substitutes one table in the database for one defined within the universe. An example of this would be if a DBA created a restricted view of a fact table (maybe limiting it to only Eastern region data). The DBA wants a certain user, Joe, to use this particular database view in place of the normal fact table as defined in the universe.
- Connection swapping—Substitutes a different connection string to a different database. This assumes that there are two databases with the exact same table structures as represented in the universe. The different databases exist to segregate data in some way—say, one database contains Eastern region data only.
Note that the same example is used here to illustrate a point. With the exception of object hiding, the other three restrictions perform the same function—limiting the user to a certain set of data. However, DBAs often employ different techniques to achieve this result. Business Objects can handle it one way by applying WHERE clause restrictions. If the DBA decides to use database views to limit the data, table swapping is used to assign the views. If the DBA puts the data in a separate physical database, connection swapping is used. There are additional methods for limiting users to certain records, such as a security lookup table. Security lookup tables, along with other methods, are also accomplished by employing semantic layer overrides. The four mentioned previously are the most common and have been built into the universe for about a decade.
Restriction Sets
Semantic layer overrides are applied via the Designer and are called restriction sets. A restriction set contains one or more semantic layer overrides bundled into a single administrative entity. For example, suppose that you want to restrict certain objects in a universe, swap a table for a view, add a WHERE clause restriction, and limit the number of rows returned to 50,000. This can all be defined within a single restriction set. The restriction set is then applied to particular users or groups defined via the CMS. In this case, all overrides apply to the users or groups to which they are assigned.
To recap the overrides available for inclusion in a restriction set, see Table 18.2.
Table 18.2. Overrides for Restriction Sets

Restriction sets are created by selecting Tools, Edit Security Restrictions and choosing the New button.
Figure 18.5 shows the Edit Restriction Set dialog. The six tabs correspond with the six overrides listed in the preceding table. The Objects tab is highlighted in the figure, showing that the Discount object from the Measures class is restricted and will be hidden from all to whom this restriction set is applied. The restriction set can combine restrictions from all six override types.
Figure 18.5 Designer with Edit Restriction Set dialog open.

After the overrides have been set and the OK button is selected, the restriction set shows up in the list of available restrictions. Clicking OK saves the restriction set.
Applying Restriction Sets
To apply the restriction set to a particular user or group, select Tools, Apply Security Restrictions and choose the Select Users/Groups button. This shows the available users/groups as defined via the Central Management Console (CMC). The window allows for searches through the InfoStore to aid in managing the list in large deployments.
After the user or group is selected, the user or group is available to apply to a restriction set. This is achieved by clicking on the user or group to highlight it. After it’s highlighted, you click on the restriction set drop-down menu, select the restriction set you want to apply, and click on the Apply button.
Multiple Restriction Sets
Because multiple groups can house the same users, it is possible for a user to have more than one restriction set applied to her. If a user belongs to more than one group, the order of restriction sets can be prioritized. Sometimes contrary to expectation, the restriction set with the highest priority number is the dominant one. For example, suppose that there are two groups, Sales Management and Sales Field, and both have restrictions limiting row return, with Sales Management limited to 50,000 rows and Sales Field to 20,000 rows. If Sales Management is priority 1 and Sales Field is priority 2, for those users who are in both groups, the priority 2 would apply. (you might think priority 1 would win, but it’s the highest number of all restrictions possible). If a user has individual overrides applied through one restriction set and is also a member of a group, the overrides are cumulative. For example, if Joe is limited to the Eastern region only via a WHERE clause restriction and he is in the Sales Field group, he will also be limited to 20,000 rows.
Some restrictions have to be managed by priority because they cannot cumulate, such as connection information (the user must clearly have one and only one connection defined). The other two restrictions that have priority applied are table swapping and query and SQL controls. The other restriction types can accumulate (object access and row access).
It is possible to define a restriction for a user that conflicts with the group. For example, say you define a restriction set for Joe for Org.Region = 'East'. You then put Joe in a group called Central, which has a restriction set containing the restriction Org.region = 'Central'. In this case, Joe will apply both of these WHERE clauses to the SQL generated. Because there is no row that can be both in the East region and Central region at the same time, Joe will get no results returned. It is best practice to apply overrides at the lowest level possible and to use the Preview Security Restrictions command in the Designer to show the cumulative effect of restrictions on individual users.
Universe Changes
Sometimes after a universe is deployed and users begin using it, you might find that an object definition is incorrect and needs to be rectified. Or perhaps you discover the necessity for an aggregate table, create one, and make your universe aggregate aware. Or you find out the DBA made a change to one of your underlying tables and accidentally renamed some of your column names. You corrected the universe, and want all of your users to start using the new version.
However, you have many users who have developed reports (either Web Intelligence or Crystal) off of the universe currently in use. You know the SQL statements they are using are either not optimal or incorrect. How do you get all the existing reports updated with the new semantic definitions?
This capability is built in to the Business Objects Enterprise framework. When a new universe is placed in the InfoStore to replace the existing one, the report engines will detect that a newer version of the semantic layer exists, and will fetch it from the InfoStore. It will then be used to dynamically regenerate the SQL statements at execution time. The reports pick up the new object definitions and new SQL, if applicable. It will be done automatically the next time the report is run. So, if a user pulls a report out of his Favorites and executes it, the SQL will automatically regenerate with the new universe object definitions. If a user had a report scheduled for refresh every week, the report would generate new SQL at the next scheduled refresh. This holds true for both Crystal and Web Intelligence reports.
In version 10 of Crystal Reports, with the Business Objects Crystal Integration Pack, the universe could be used to generate SQL for Crystal Reports, but it would not dynamically update as the universe changed. However, in Business Objects XI, Crystal Reports will regenerate SQL when the universe changes. This is an important change to note.
The reason the SQL should regenerate is simple—security. Users often move from department to department or are promoted to a new job which might have less restrictive data access. After the appropriate semantic layer overrides have been made, all reports used by that user will pick up the new restrictions automatically. It’s just part of a Business Intelligence system.
Any instances the user might have run historically will have results based on the old semantic layer overrides. After the SQL is executed, the data retrieved, and the document stored as a report instance, the data is static. Changes to the semantic layer will not rerun historical instances. You can see why this would be impossible given the fact that the underlying data is changing constantly. Therefore, semantic layer changes will modify any SQL generated from the point in time that the new universe is in the CMS—until the next semantic layer change, of course.
Differences in How CR/WebI Use Universes
Because both Crystal Reports and Web Intelligence can use universes, this discussion of the differences begins by restating what is the same:
- Both report engines utilize the universe to generate SQL.
- Both report engines update their SQL when newer universes are available.
- Both report engines take advantage of semantic layer overrides.
- Both report engines can have multiple result sets generated from multiple query panel requests.
The main difference between the Crystal and Web Intelligence report engines’ use of the universe is the existence of the microcube engine in Web Intelligence. Because Crystal Reports does not have a microcube engine and uses a fundamentally different reporting paradigm, some SQL generated via the universe and accommodated by Web Intelligence will not be accommodated by Crystal Reports. For example, any single query panel request that requires multipass SQL will not be accommodated. This is because there is no microcube to reassemble the multiple resultsets into a single entity (data provider).
Again, you cannot overlook the tie between the data model and the expected usage. If you have a complex report with little to no interactivity that needs to be built off of a transactional model, this might be a better use for Crystal Reports without a universe. If you have a fairly decent data model that could possibly be used for analysis (even though reporting requirements don’t currently state it), you can use either tool to write the report—either Crystal Reports with or without the universe, or Web Intelligence with the universe. If you want a high level of user interactivity with the report (drilling, sorting, filtering, object swapping, and so forth), use Web Intelligence. If you want ad-hoc reporting with great performance, the ability to ask sophisticated questions, and a high level of interactivity, but do not have an appropriate model, no reporting tool can help you—you must model the data to meet the reporting requirements.
Differences with Business Views and Universes
The major differences between business views and universes are
- Multiple data sources versus single data source—A business view can have multiple data sources defined within it; a universe has one and only one connection. Although a universe connection can be dynamic, the universe itself can point to only one data source at a time.
Data from multiple universes can be combined within a single report as of Business Objects XI Release 2.
- Reuse of business elements—In business views, the business elements (which are roughly equivalent to the object classes) are reusable within other business views. Although object classes are not reusable, there is a similar functionality with universes in that universes can be linked. This means that a universe can embed another universe within it. The inheriting universe assumes that all tables and object definitions, and new joins will need to be drawn to integrate those tables with the existing ones in the inheriting universe. However, the inherited universe and inheriting universe still assume a single connection, meaning all tables exist within a single RDBMS.
- Report variables as objects—In business views, you can define an element that will not reflect a SQL snippet, but might be a formula composed of two or more elements that are SQL snippets. For example, there could be a revenue element that points to a column in a database, and a costs element that also points to a column in the database. From these two elements, there could exist a third element called margin, defined as revenue – cost. When the margin element is chosen, the business view understands that the revenue and cost elements must be selected, and the formula executes within the Crystal Reports engine after the data is returned. In a universe, all objects are SQL snippets; you cannot place what is effectively a report variable in the universe.

Troubleshooting
I updated scheduled prompts in my business view but I don’t see the list of values in my Crystal Report. I get the old list of values.
In most cases, the user needs to open the report and change the parameters from the static values to the new scheduled list in a business view.
How do I install the Repository samples?
From the tools menu in the Business View Manager, select Install Repository Samples.