
Chapter 16 Formatting Multidimensional Reporting Against OLAP Data
OLAP Concepts and OLAP Reporting 360
Recently Added or Changed OLAP Features in Crystal Reports 361
Using the OLAP Report Creation Wizard and OLAP Expert 362
Introduction to OLAP Intelligence 378
Crystal Reports in the Real World—OLAP Summary Report with Drill-down 379
Introduction to OLAP
Through the first 15 chapters, you have been exposed to a wide variety of the reporting capabilities found in Crystal Reports. Up to this point, however, all the reports you have created were based on relational data sources—often known as Online Transactional Processing (OLTP) databases—where most organizations generally keep their operational data.
In many organizations and for many people today, data reporting ends with Crystal Reports pointing at existing relational data sources such as Microsoft SQL Server, Oracle, DB2, Sybase, or even Microsoft Access. All these relational databases have been designed for the efficient storage of information. These databases were not designed optimally, however, for the efficient extraction of data for aggregated analysis across multiple dimensions—that is where OLAP databases excel.
OLAP stands for Online Analytical Processing and is designed to enable business users to quickly identify patterns and trends in their data while reporting against multiple dimensions at once. Examples of dimensions for analysis include time, geographic region, product line, financial measure, customer, supplier, salesperson, and so on. Crystal Reports provides powerful OLAP-based formatted reporting capabilities and these will be introduced in this chapter.
This chapter covers the following topics:
- Introduction to OLAP concepts and OLAP reporting
- Recently added OLAP features in Crystal Reports
- Creation of OLAP-based Crystal Reports
OLAP Concepts and OLAP Reporting
OLAP is an analysis-oriented technology that enables rapid analysis of large sets of aggregated data. Instead of representing information in the common two-dimensional row and column format of traditional relational databases, OLAP databases store their aggregated data in logical structures called cubes. These OLAP cubes are created around specific business areas or problems and contain an appropriate number of dimensions to satisfy analysis in that particular area of interest or for a specific business issue. OLAP is a technology that facilitates data viewing, analysis, and navigation. More than a particular storage technology, OLAP is a conceptual model for viewing and analyzing data. Table 16.1 highlights some common business areas and typical sets of related dimensions.
Table 16.1. Business Areas and Commonly Associated OLAP Dimensions
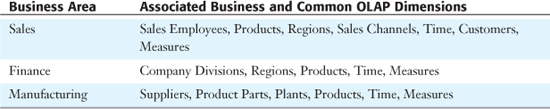
OLAP cubes pre-aggregate data at the intersection points of their associated dimension’s members. A member is a valid field value for a dimension. (For example: Members of a time dimension could be 2000, 2001, Q1, or Q2; and members of a product dimension could be Gadget1, Gizmo2, DooDah1, and so on.) This pre-aggregation facilitates the speed-of-thought analysis associated with OLAP.
Pre-calculating the numbers at the intersection points of all an OLAP cube’s associated dimension members enables rapid high-level analysis of large volumes of underlying data that would not be practical with traditional relational databases. Considering the example of analysis on several years of sales data by year, quarter, and month and by region, sales manager, and product, the pre-aggregated nature of OLAP facilitates quick speed-of-thought analysis on this data that otherwise would not be practical working with the phenomenal amount of data and involved calculations required on a traditional relational (OLTP) database system to provide those answers—it would simply take too long.
When a Crystal Report uses an OLAP cube as a data source, it presents the multidimensional data in a two-dimensional OLAP grid that resembles a spreadsheet or cross-tab. The focus of Crystal Reports when reporting against OLAP cubes is to present professionally formatted two-dimensional (or flat) views of the multidimensional data that will be of particular business use for report consuming end users and not necessarily analysts requiring interactivity—the more traditional OLAP end-users.
The concepts of OLAP usually become more understandable after they are actually explored. To that end, later sections in this chapter step you through a Crystal Reports report creation example against an OLAP cube.
Recently Added or Changed OLAP Features in Crystal Reports
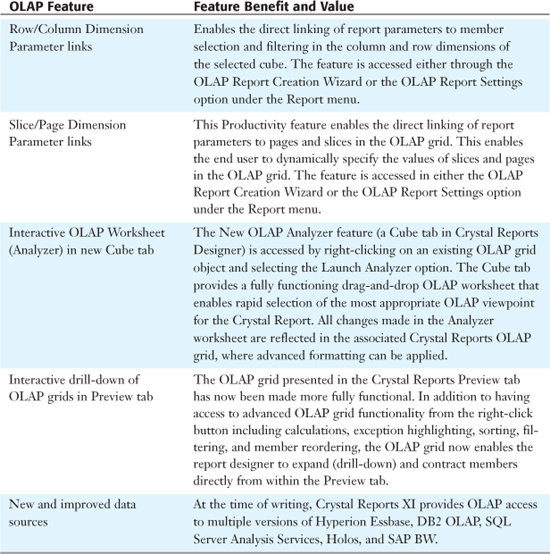
This section is specifically targeted for users of older versions of Crystal Reports. Table 16.2 lists the new OLAP-oriented features of recent versions and their practical use or benefit. If you are a new user to Crystal Reports or you have not previously used the OLAP reporting features in the product, you might want to skip directly to the next section.
Table 16.2. New OLAP Features in Crystal Reports 9, 10, and XI
The following sections explore the creation of an OLAP report through the OLAP Report Creation Wizard, the added value of the OLAP Expert, and the advanced interactivity features of Crystal Reports.
Using the OLAP Report Creation Wizard and OLAP Expert
Crystal Reports provides two easy ways to create reports against OLAP data sources. As introduced in Chapter 1, “Creating and Designing Basic Reports,” Crystal provides several report wizards to step you through the creation of some popular types of reports—one of those is OLAP. The OLAP Wizard involves five steps and walks you through the process of creating an OLAP grid and an optional supporting graphic based on an existing data source. The OLAP Wizard is accessible when you are creating a new report.
The second method of creating an OLAP-based report is through the OLAP Expert that is accessed from the Insert OLAP Grid on the Insert menu. This expert provides six tabs that step through the creation of an OLAP grid to be placed anywhere on a report.
The two methods of creation offer very similar degrees of functionality, and their respective dialog screens and tabs are almost identical. The OLAP Report Creation Wizard does provide a built-in Charting screen not found in the OLAP Expert, whereas the OLAP Expert provides Style Customization and Label tabs not found in the OLAP Wizard.
Although Crystal Reports has been designed to report off of numerous multidimensional/OLAP databases including Hyperion Essbase, Microsoft SQL Server Analysis Services, and SAP BW, for the purposes of demonstration in this chapter, examples will be based on the SQL Server sample HR cube–FoodMart. If a different OLAP Database is available, the general principles should be followed against that native OLAP cube.
Specifying an OLAP Data Source
The OLAP Data tab (or screen in the OLAP Wizard) requests the OLAP data source on which the report is to be based. This wizard and its associated dialog screens are to multidimensional data sources what the data explorer, introduced in Chapter 1, is to relational data. Figure 16.1 shows the OLAP Data screen from the OLAP Wizard.
Figure 16.1. The OLAP Data dialog from the OLAP Report Creation Wizard.
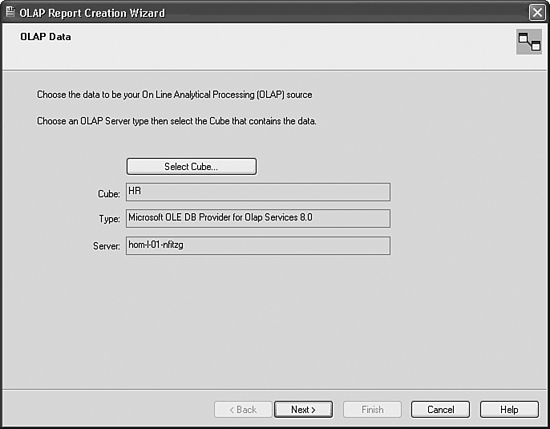
When this screen is first displayed, a cube will need to be selected with the Select Cube button. Clicking on this button opens the OLAP Connection Browser, which is displayed in Figure 16.2. From the tree control presented in this dialog, select the desired cube.
Figure 16.2. The OLAP Connection Browser enables the specification of an OLAP data source for the involved Crystal Report.

![]() For detailed coverage of the OLAP Connection Browser and the functionality it provides, see “Accessing OLAP Data with OLAP Intelligence,” p. 426.
For detailed coverage of the OLAP Connection Browser and the functionality it provides, see “Accessing OLAP Data with OLAP Intelligence,” p. 426.
To help you learn about the creation of an OLAP-based Crystal Report, here are the introductory steps to doing exactly that against SQL Server’s sample FoodMart HR cube. Other steps will follow these initial steps after subsequent screens have been explained. Start the OLAP Report Creation process with the following steps:
- Create a New Crystal Report by selecting the OLAP Wizard from the Crystal Reports Start Page.
- Click the Select Cube button from the OLAP Data dialog.
- Assuming that the location of the OLAP Server has not already been identified to the OLAP Connection Browser, click the Add Server button and identify the location of your SQL Server Analysis Server and the sample HR cube. Figure 16.3 shows the New Server dialog.
Figure 16.3. The Connection Properties dialog for a new OLAP server is used to create new connections to OLAP data sources.
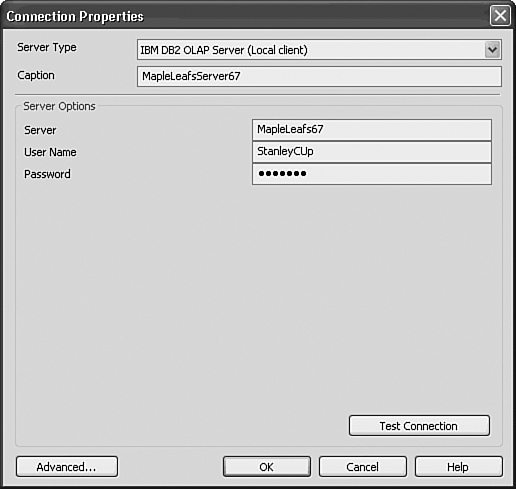
- Enter a caption for the OLAP Server you are adding. This caption will appear in the OLAP Connection Browser. Enter the name of the SQL Server Analysis Server for the server name and click OK.
- Back in the OLAP Connection Browser, navigate into the presented list of servers (there will likely only be the one you just added) and double-click on the sample HR cube.
- Click the Next button to proceed.
A Select CAR File button exists on the Data screen of the OLAP Report Creation Wizard, in addition to the Select Cube button. CAR files are Crystal Analysis Reports (CAR) and are created with the sister product to Crystal Reports—OLAP Intelligence (formerly called Crystal Analysis). This product is an OLAP-focused reporting and application tool and will be introduced in Chapter 19, “Creating OLAP Intelligence Reports.” These CAR files can be treated as multidimensional data sources because they themselves contain connectivity information to an underlying OLAP data source.
Specifying OLAP Rows and Columns
The Rows/Columns dialog screen enables you to select both the dimensions and fields to be presented along the columns and rows of the OLAP grid. All the available dimensions in the selected cube/data source are listed in the Dimensions list box depicted in Figure 16.4.
Figure 16.4. The Rows/Columns dialog of the OLAP Report Creation Wizard.

To select a dimension for placement in the rows section or the columns section of the OLAP grid, highlight the desired dimension and click either the column or row arrow (>) button. It is possible to select multiple dimensions to be displayed and have these nested in the OLAP grid by successively selecting multiple dimensions for either the rows or the columns section. It is also possible to remove dimensions from the existing row or column list boxes; however, the column and row dimension list boxes cannot be left empty.
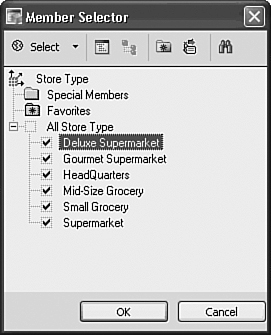
After the desired dimensions are selected, a subset of the fields (also known as members) for those dimensions can be selected using the Select Row Members or Select Column Members buttons. Examples of this might be selecting only a certain subset of provinces or states in a region dimension or, alternatively, selecting only a certain year’s worth of data in a time dimension. By highlighting a dimension in either of the Rows or Columns list box and then selecting the appropriate Selection button, a subset of the members for the involved dimension can be selected from the Member Selector dialog as shown in Figure 16.5.
Figure 16.5. The Member Selector dialog is used to select default Column and Row Dimension members.
The last and newest feature of the Rows/Column screen is the Create/Edit Parameter functionality provided for each of the Row and Column dimensions. This capability provides the business user or report consumer with the capability to interact with the report and control its content by entering parameters that directly affect the dimension members displayed in the OLAP grid(s) on the report.
Because Chapter 5, “Implementing Parameters for Dynamic Reporting,” covered parameters in detail, you are likely familiar with this topic already. Of significance for this wizard screen is that the parameter creation process is directly accessible here, and this facilitates the rapid development of formatted and interactive OLAP reports. If necessary, review Chapter 5 for a refresher on creating and editing parameters.
The Member Selector dialog provides some powerful shortcuts for the selection of certain logical groups of members. These selection shortcuts are accessed through either the Select drop-down box or by right-clicking on any part of the Member Selection list box. Sample selection shortcuts include the capability to select all base level members or all members at a highlighted level.
Continuing with the creation of the sample report started in the last section, the following steps walk through the Rows/Columns screen part of this report creation example and allow for the refinement of the data to be viewed in the OLAP grid. Follow these steps to add rows and columns to your OLAP-based report:
- Select the Store Type Dimension from the available dimensions list as the Row Dimension using the Row Dimension arrow button. (Note: It will likely be necessary to remove a default dimension to ensure that this is the only dimension in the Row Dimensions list view.)
- Using the Select Row Field’s button, select all the Store Types (for example, Supermarket, Headquarters, and so on) from the Member Selection dialog, but deselect the aggregated top level All Stores field. This enables the OLAP grid to present all the different store types down the side of the grid as rows.
- Select the Time Dimension from the available dimensions list as the Column Dimension using the Column Dimension arrow (>) button. (Note: It will likely be necessary to remove a default dimension to ensure that this is the only dimension in the Column Dimensions list view.)
- Using the Select Column Field’s button, select the years 1997 and 1998 from the Member Selection dialog, but ensure that no children members have been selected. This enables the OLAP grid to present a comparison of the two years of data in two side-by-side columns.
- Click the Next button to proceed.
At this point, you will review the concept of OLAP dimension filters and pages in your OLAP report.
Specifying OLAP Dimension Slices (Filters) and Pages
The Slice/Page dialog of the OLAP Report Creation Wizard, shown in Figure 16.6, enables you to select values or members for the dimensions that were not selected to be row or column dimensions. In the OLAP world, these dimensions are often called paged or sliced dimensions.
Figure 16.6. The Slice/Page screen of the OLAP Report Creation Wizard allows manipulation of the dimensions not selected for use on either the rows or columns.

The Slice list box lists all the paged dimensions and their current member settings. The default setting is usually all members for any given dimension. An example is that for the Store Dimension, the default slice setting is All Stores. To change the member selection (slice) for a particular dimension, that dimension must be selected in the Slice list box and the Select Slice button must be used to open the familiar Member Selection dialog (refer to Figure 16.5). This dialog is identical to the Member Selection dialog used previously except that only one member from the selected dimension can be selected. If multiple members from a slice dimension are required in a report, the Page list box should be used and separate pages/grids will be created for each value selected.
The Page list box is initially empty but can contain any dimensions outside the row and column dimensions that require multiple member selection. An example could involve selecting the three countries of North America as store regions. The selection of multiple values for a paged dimension creates completely separate grids (based on the same preselected rows and columns) for each selected member value. To select multiple members for a dimension, the involved dimension needs to be selected in the Slice list box and moved to the Page list box using the transfer arrow buttons between the list boxes. Once moved to the Page list box, the Select Page Values button enables multiple member selection through the Member Selection dialog.
The last, but perhaps most powerful, feature of the Slice/Page screen is the Link to Parameter functionality provided for each of the Filtered and Paged dimensions. This capability provides the business user or report consumer with the capability to interact with the report and control its content by entering parameters that directly affect the information displayed in the OLAP grid(s) on the report.
Of significance for this wizard screen is that the parameter creation process is directly accessible here, and this facilitates the rapid development of formatted and interactive OLAP reports.
![]() For more information on creating and editing parameters, see “Creating and Implementing Parameters Fields,” p. 136.
For more information on creating and editing parameters, see “Creating and Implementing Parameters Fields,” p. 136.
Continuing with the creation of the sample report, the following steps walk through the Slice/Page dialog part of this report creation example and will enable you to select the measure that will be displayed in the OLAP grid. Follow these steps to select measures on the page/slice dimensions:
- Select the Measures dimension from the Filter list box.
- Instead of selecting a specific filter using the Select Filter Value button, click the Link to Parameter Create/Edit button to enable the business user to dynamically select this slice every time the report is run. The Create Parameter Field dialog, shown in Figure 16.7, appears.
Figure 16.7. The Create Parameter Field dialog called from the Slice/Page screen.
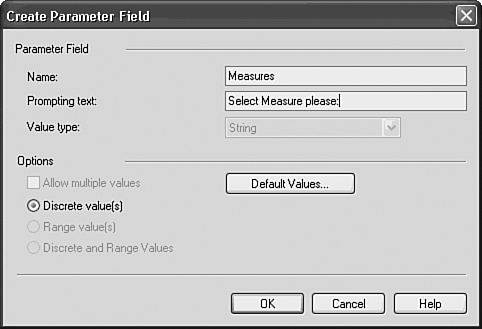
- In the Prompting Text text box, enter the text that you want your user to be prompted with when this report is run. In this case, it could be something similar to
Please select the Measure to be used in your report. Also, ensure that the Discrete Value(s) radio button is selected because a range of entries is not required (or allowed) here. - To avoid requiring users to type in any text, defaults can be set so that selection from a drop-down box is possible. To do this, click the Select Default button and the dialog in Figure 16.8 appears.
Figure 16.8. The Set Default Values dialog for the OLAP Slice Parameter.
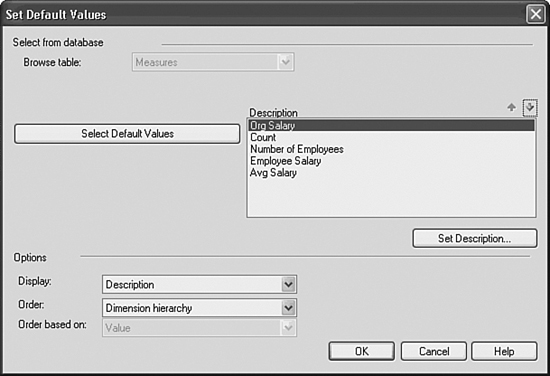
- The Measures table is pre-selected because the report respects the association with the previously highlighted dimension. Move all the available member values for the Measures dimension to the Description list box by clicking on the Select Default Values button and selecting all the members through the familiar Member Selector dialog.
- Ensure that the Display drop-down box has Description selected and that the Order drop-down box has no sort selected. Click OK twice to get back to the Slice/Page dialog of the OLAP Report Creation Wizard.
- Once you return to the Slice/Page dialog, highlight the Pay Type dimension in the Slice list box and click the arrow transfer/select button to move this to the Page list box. The Member Selection dialog will immediately appear with the Pay Type Dimension Hierarchy presented.
- Select the Hourly and Monthly pay types (children of All Pay Types) and deselect the All Pay Types field. Individual OLAP grids are now created for each of the monthly paid employees and the hourly paid employees. If this isn’t clear now, it should make more sense when you are visualizing the report.
- Click OK and then Next to proceed.
After Parameters or Multi-Value Paged Dimensions have been set in the OLAP Report Creation Wizard, you can only access them for editing through the OLAP Design Wizard under the main Report menu. These settings are not configurable in the OLAP Expert.
Adding Report Styles in the OLAP Report Wizard
The Style dialog in the OLAP Report Creation Wizard enables you to select any one of a predetermined number of styles for OLAP grids available in Crystal Reports. Figure 16.9 displays the Style dialog. The styles are often considered a good starting point for formatting the OLAP grids on your reports and can be enhanced through both the Customize Style tab of the OLAP Expert (described later in the chapter) and using many of the advanced formatting features you have already learned about.
Figure 16.9. The Style dialog of the OLAP Report Creation Wizard.

Adding Charts via the OLAP Report Wizard
The Chart dialog provided in the OLAP Report Creation Wizard enables you to add graphics quickly to the OLAP report being created. The graphics available in this wizard, shown in Figure 16.10, are only a subset of the graphics available in Crystal Reports (refer to Chapter 8, “Visualizing Your Data with Charts and Maps,” for a refresher), but they do enable the rapid visualization of your OLAP data without the need for using the Chart Expert.
Figure 16.10. The Chart dialog of OLAP Report Creation Wizard enables you to select between different basic chart types.
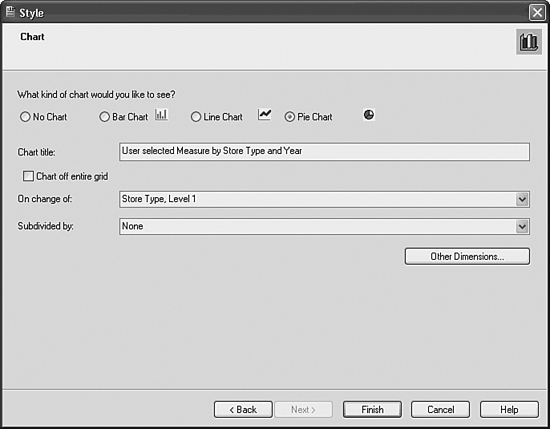
Aside from selecting the type of chart (bar, line, or pie) and specifying a title on this screen, an On Change Of field must be specified with an optional Subdivided By field before this screen is complete. As Chapter 8 discussed, the On Change Of field is the field in your data source that provides the breaking point for the involved graphic. Examples could include country, region, year, store, product, and so on. The Subdivided By field can provide a second variable to base your charts on. An example of a two-variable OLAP Chart using the FoodMart sample cube would be a chart showing salary information by year and then subdivided by store type.
Now, to complete the OLAP report creation process, the following steps will take you through the addition of a style, a chart, and the creation of the finished report:
1. On the Style dialog, select any style that suits your preference and click the Next button.
2. On the Chart dialog, select Pie Chart as the Chart Type by selecting the radio button associated with that chart type. This provides a nice way of visualizing comparables across different store types.
3. Provide your chart with a title similar to Measures by Store Type and Year by entering this into the Chart Title text box.
4. Select Store Type as the On Change Of field. This facilitates the comparison of the six different store types. Leave the Subdivided By drop-down field empty.
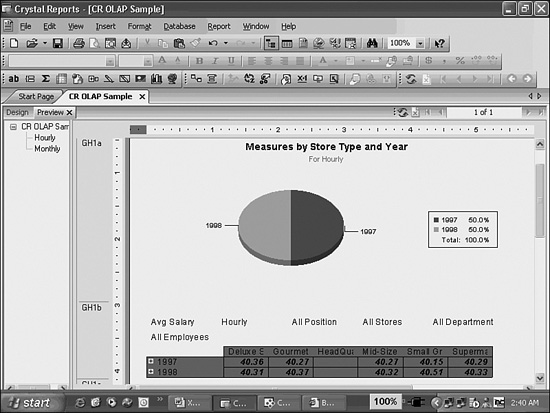
4. Click Finish on the OLAP Report Creation Wizard. You will be prompted to select a parameter for the Measure dimension. After selecting Average Salary (or another field if you prefer), a report is generated that looks similar to Figure 16.11.
Figure 16.11. The sample OLAP report created using the OLAP Wizard.
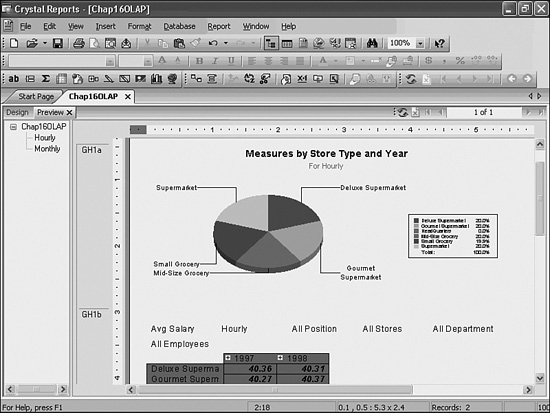
The OLAP Report Creation Wizard provides an efficient and effective method to getting value out of OLAP data in a short timeframe. After an OLAP grid or OLAP chart has been placed on your report through the wizard, further formatting and analysis can be performed through a variety of built-in Crystal Reports formatting tools. The next two sections explore further customization options and the three subsequent sections discuss the powerful new interactivity available in Crystal Reports OLAP objects.
Customizing Styles in the OLAP Expert
After an OLAP grid has been added to a report, with or without a selected style, Crystal Reports provides the capability to enhance and customize the formatting of that grid through the Customize Style tab accessed on the OLAP Expert. The OLAP Expert dialog is displayed in Figure 16.12 and is accessed by right-clicking on an existing OLAP grid object and accessing the OLAP Grid Expert, or by selecting the Insert OLAP Grid option from the Insert menu.
Figure 16.12. The OLAP Expert dialog provides the capability to edit many of the OLAP Grid display properties including the customization of styles.
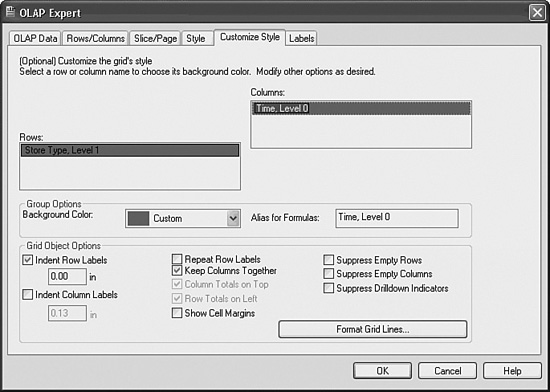
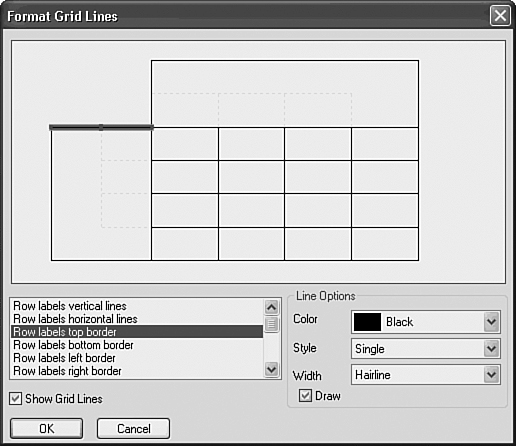
Four of the tabs in the OLAP Expert have identical functionality as presented in the previous Report Wizard sections. The Customize Style tab shown in Figure 16.12 is unique to the OLAP Expert and provides the capability to fine-tune the formatting of the row and column dimensions selected for the involved OLAP grid. By selecting any of the column or row dimensions from the presented list boxes, custom colors can be selected for the backgrounds of the OLAP grid row and column headings. This tab also provides a number of formatting options for the presentation of the grid including indentation, blank column/row suppression, margins, and labels. Also provided is an option to format grid lines, shown in Figure 16.13. This dialog enables granular level formatting and selection of grid lines for display on the OLAP grid’s layout.
Figure 16.13. The Format Grid Lines dialog is accessed from the Customize Style Tab of the OLAP Expert dialog and enables granular level control of the OLAP grid’s grid lines.
Customizing Labels in the OLAP Expert
The Labels tab of the OLAP expert, shown in Figure 16.14, provides the capability to customize the display of the paged-dimension (non row/column dimensions) labels on the OLAP grid.
Figure 16.14. The Labels tab of OLAP Expert enables you to specify display properties around the OLAP grid’s dimensions.
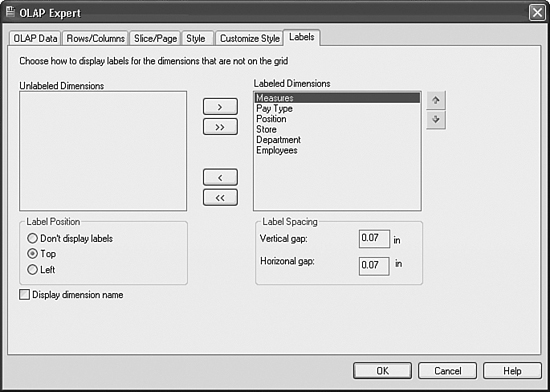
Paged/Sliced Dimension member values for the display grid can be displayed or hidden by simply moving the selected dimension between the unlabeled dimension and labeled dimension list boxes using the transfer arrow (>, >>, <, <<) buttons. Additional labeling options—such as label location, label spacing, and dimension names—can also be selected in this tab.
Advanced OLAP Reporting
Up to this point, the OLAP Expert and OLAP Report Creation Wizard have demonstrated the capability of Crystal Reports to rapidly create OLAP-based reports. More than these capabilities, Business Objects provides advanced analytic capabilities against OLAP data sources through some advanced OLAP-oriented features in Crystal Reports and through a sister product called OLAP Intelligence (formerly called Crystal Analysis). The last four sections of this chapter introduce some of these advanced features for Crystal Reports; OLAP Intelligence is introduced in Chapter 19.
Interacting with the OLAP Grid
Crystal Reports provides some powerful interactive OLAP features from directly within the Crystal Reports Preview and Design tabs. Figure 16.15 displays the right-click menu that appears when right-clicking on the year 1998 member in this chapter’s sample report.
Figure 16.15. Advanced OLAP features are provided in the right-click menu.

Advanced features made available here include conditional member highlighting, setting column display options, hiding and showing members for asymmetrical reporting, adding calculations, adding filters, reordering members, changing the member caption, expanding members (that is, drilling into the children members), adding sorts, and adding automatic totals to the OLAP grid. Although exploring these features in detail is beyond the scope of this chapter, it is important to note their availability for enhancing your OLAP grid presentations and reports. For detailed information on all these functions, review Chapter 19 where the same functionality for OLAP Intelligence is presented.
One feature of note for now is the active nature of the column and row dimensions in the OLAP grid. By double-clicking on any member in either the row or column headings—and assuming that the selected member has lower level members (children)—the OLAP grid dynamically expands to include that member’s children in the grid. In OLAP parlance, this is called drilling-down. Figure 16.16 shows the result of drilling-down on the 1998 Header in this chapter’s sample report. An alternative means to drilling down is to click on the + icon displayed beside any row or column dimension member.
Figure 16.16. Sample OLAP-based report with 1998 member’s children expanded.

A dimension member can subsequently have its children contracted by double-clicking on the parent member or clicking on the – icon beside the involved parent member. This feature enables you to interactively determine the best static viewpoint to provide to the business user audience for the report.
Pivoting OLAP Grid
After an OLAP grid has been added to a report, as in this chapter’s sample, Crystal Reports provides the capability to easily swap the grid’s columns and rows. In OLAP parlance, this is referred to as pivoting the OLAP grid. Figure 16.17 highlights this chapter’s sample report after being pivoted with this function. To access this function, right-click on the OLAP grid and select the Pivot OLAP Grid option. Pivoting the OLAP grid does not affect any OLAP charts or maps already on the report.
Figure 16.17. A preview of the sample report after pivoting the OLAP grid. Notice how the chart and the grid have changed.
This function is particularly useful when attempting to decide which viewpoint of the involved OLAP grid will be most useful to the business users of the report.
Using the Cube View Functionality
The Cube View (previously called the OLAP Analyzer) is a powerful worksheet analysis tool first introduced in version 9 of Crystal Reports. The Cube View is initiated through the View Cube option on the right-click menu of the OLAP grid (make sure that you don’t have any specific grid objects selected) and is accessed through a new tab, titled Cube View, in the Crystal Reports Designer (see Figure 16.18). Report designers and analysts familiar with other OLAP interface tools will be instantly comfortable with the Analyzer because it provides access to the OLAP cube through a traditional OLAP worksheet.
Figure 16.18. The Cube View tab launched by the OLAP Analyzer provides a powerful analytic tool for report designers and power users.
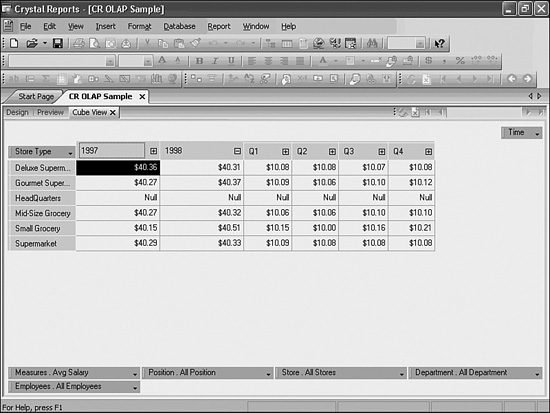
Unlike the OLAP grid presented in the Crystal Reports Preview tab, the Cube View tab’s worksheet is designed for rapid analysis of the underlying OLAP data through a rich and interactive interface not available in the OLAP grid. Dimensions can be rapidly shifted, swapped, and nested by double-clicking on them and dragging them into any of the row, column, or paged dimension areas. Dimension members can be quickly expanded and contracted by clicking on their associated + or – icons. Additional calculations, sorts, filters, automatic totaling, exception highlighting, data analysis, and custom captions can also be accessed through a right-click menu in the OLAP Analyzer view of the cube.
The Cube View is a powerful new report design tool because it lets Crystal Reports developers create some very powerful flat views of the underlying multidimensional/OLAP data in a very short timeframe and subsequently format the created OLAP grid in the Preview tab.
Although both the Cube View tab and the In-Place OLAP Grids within the Crystal Reports Designer offer much of the same functionality, not all the work handled in the Cube View is necessarily translated back into the related OLAP grid on Crystal Reports. Exception Highlighting and Field Formatting are two good examples of functionality that does not cross over. It is generally recommended that the majority of formatting work be done in-place within the Crystal Report’s Design or Preview tabs and that cube and dimension orientation be the primary focus of the Cube View tab.
Using Charts and Maps Based on OLAP Grids
As described in Chapter 8 and discussed briefly in the “Adding Charts via the OLAP Report Wizard” section earlier in this chapter, OLAP grid data can be presented through visually appealing charts and maps. To create either a chart or a map based on OLAP data, an OLAP grid must pre-exist on your report as a data source for the chart/map to be based on. Selecting the Insert Chart or Map command from the Insert menu (or the respective icons on the Insert toolbar) enables the creation of an OLAP-based visualization.
The creation process for both charts and maps requires the specification of an On Change Of field. This is the field that the chart or map will break its summaries on (for example, country, state, product, sales rep, and so on). An additional optional Sub-divided On field can be specified as well. The results of specifying an extra variable to divide the data on will have different results for various chart types. Explore these different charts to find those most suitable for your business problem. Using the Sub-divided On field with a map adds either a bar or pie chart to every main region on the selected map. An example of this might be a pie chart depicting the breakdown of sales for each country.
It is imperative that the On Change Of field be a geographic-based field when creating a map. Otherwise, the mapping component returns an empty map.
Introduction to OLAP Intelligence
OLAP Intelligence is a mature reporting tool from Business Objects that enables organizations to deliver action-based OLAP analysis to business users. It enables better insights to help decision makers affect business performance through interactive analysis. OLAP Intelligence takes OLAP reporting to the next level by enabling you to create intuitive and highly interactive reports that offer a guided analysis approach to business issues.
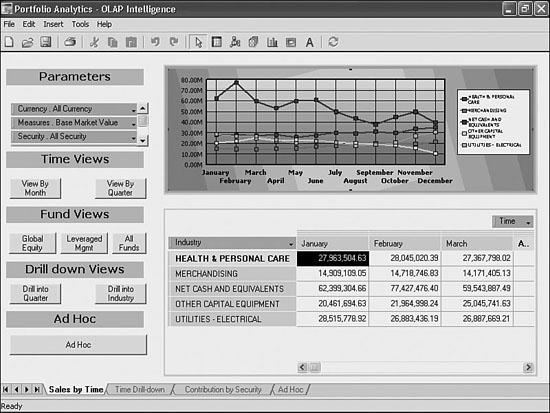
Power users implementing OLAP Intelligence can create analytic reports, based on OLAP data, using a powerful designer (similar in concept to Crystal Reports). OLAP Intelligence Reports can contain many pages, each presenting a different predefined view of the OLAP cube. Data can be presented in tables or visualized through a wide range of charts, exception highlights, data sorts, filters, and analytic transition buttons. Business managers can use the resulting analytical reports to drive the business decisions they need to make every day. Figure 16.19 displays a sample analytic report created in OLAP Intelligence. These reports, in the same manner as Crystal Reports files, can be published to, secured, managed, and distributed by the BusinessObjects Enterprise solution—also available from Business Objects.
Figure 16.19. A Sample OLAP Intelligence report that includes an OLAP grid, chart objects, and several transition buttons for guided analysis.
Details of OLAP Intelligence are beyond the scope of this chapter but are covered in detail in Chapter 19.

Troubleshooting
Adding an OLAP Grid to an Existing Report
I want to add an aggregated OLAP grid view to an existing drill-down report.
This can be quickly accomplished by accessing the Insert OLAP Grid functionality from the main Insert menu. An alternative approach that might make sense in certain situations is to insert a subreport that points to the involved OLAP datasource. Using a subreport to host the OLAP grid enables you to dynamically pass in parameters from the main report into the subreport and its associated OLAP grid. These parameters can be used to dynamically filter the columns, rows, and slices of the involved OLAP grid(s).
Crystal Reports in the Real World—OLAP Summary Report with Drill-down
The scenario discussed here describes the flexibility behind accessing multidimensional and relational data sources in one report. The benefit of this type of functionality is to enable the user to see aggregated information coming from a cube while allowing drill-down on the relational data to provide greater detail. By using parameters in this report you let the user decide which information elements are displayed.
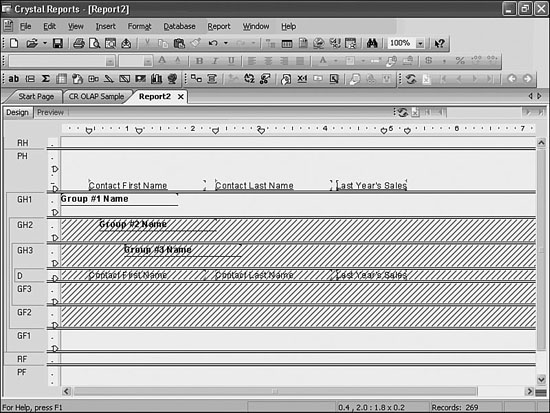
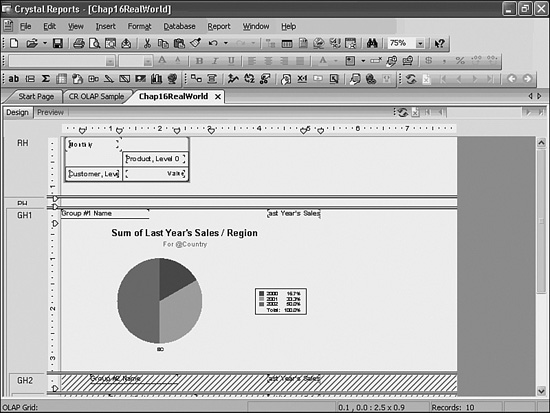
- Start by creating a simple sales report against the sample Xtreme data source. For the data, select the First Name, Last Name, and Last Year’s Sales fields from the Customer table. Group the Report by Region, City, and then Customer. Hide the Details section and the City and Customer groups and enable drill-down on these sections. The report at design time should look like Figure 16.20. Before moving on, also add Summary fields for Last Year’s Sales into each of the Group Header fields (Country, Region, and City).
Figure 16.20. Framework for drill-down integrating both relational and OLAP data.
- Now add an OLAP grid to this report that will go against an offline cube file. Using the steps described earlier in this chapter, point the grid at the sample Holos file xtreme.hdc file located in
C:Program FilesBusiness ObjectsCrystal Reports 11SamplesenDatabasesOLAP Data(You will have to add a new Holos server through the OLAP Connection Browser previously discussed in this chapter). Keep the defaults assigned by the grid expert except in the Rows/Columns tab; here, you will change the Customer Rows to only include AZ, CA, and MA to limit the number of rows displaying in the report. - Drop the OLAP Grid in the Report Header area. Now insert a pie chart based on the relational source that displays Last Year’s Sales on change of values in the Region field and place the chart in the Group Header for Country to enable the user to also visually understand what the contribution of sales is from each of the selected regions. The report in design view should look similar to Figure 16.21. Also, perform the same filtering task in the report select expert so the relational data source is also limited to the same three states (AZ, CA, and MA).
Figure 16.21. A Report using both OLAP and Relational data sources. The pie chart based on the Relational Data enables drill-down into the relational data details.
- If the user viewed this report he would currently see both the chart and the OLAP grid at the top of the report summarizing the same information but sourced from two different data sources—one, a pre-aggregated Holos data cube, the other a relational database. To enable the end user to turn off the display of the grid, you will create a parameter field that will specify whether to display the grid. This will enable the users to decide if they want to look at the summary information in both a grid and chart format or simply the chart.
- Create a parameter of Boolean type called Display Grid.
- Next conditionally suppress sections containing the grid and the chart based on the values supplied to the parameters. To do this, right-click on Report Header and select Section Expert from the Report Explorer. Make sure Suppress is checked and then click next to the suppress option on the formula sign. Inside the formula editor type in
{?Display Grid}=false
and close the editor. Now if the user runs the report he will be prompted to select whether he wants to see the the summary OLAP grid. Save the report. On Display, it should look similar to Figure 16.22.
Figure 16.22. Report showing both the OLAP grid and charts and enabling drill-down from the high level summary information displayed from the OLAP grid into the relational details.
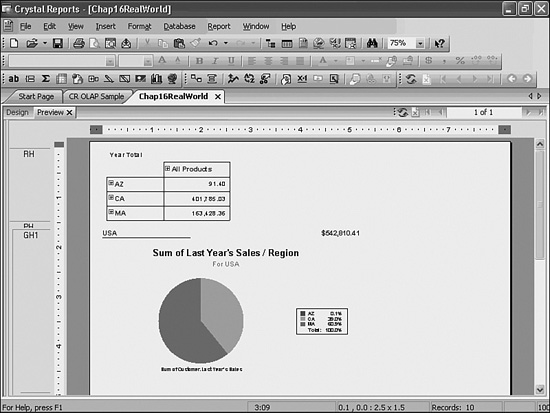
This example illustrates combining relational and multidimensional data in one report to allow for different views based on the same underlying data. This allows drill-down on relational elements and provides aggregate information for views on summary OLAP data.