
Chapter 20 Introduction to Web Intelligence
Report Variables and Formulas 499
Synchronizing Data from Multiple Data Sources 508
This chapter is designed to introduce the Crystal Reports writer to the Web Intelligence report engine. The Web Intelligence engine is an extremely sophisticated reporting engine that functions under a different reporting paradigm than Crystal Reports. A single chapter cannot adequately teach you how to use all the capabilities of the Web Intelligence engine. Because this book is primarily devoted to Crystal Reports development, you should not expect to find equally in-depth how-to knowledge on report development using Web Intelligence. However, after reading this chapter you should be familiar with the Web Intelligence reporting paradigm; understand the tools, nomenclature, and workflow of creating Web Intelligence reports; understand some (but not all) of the key differentiating capabilities of the engine; and be able to provide some high-level guidance to the Crystal Report developer about when to use Crystal Reports or the Web Intelligence report engine.
What Is Web Intelligence?
Web Intelligence is a report engine. If you are somewhat familiar with Business Objects classic technology, the term Web Intelligence was often incorrectly used interchangeably with several other parts of the product suite. Table 20.1 clarifies this.
Table 20.1. Common Misuses of the Term Web Intelligence
People often refer to Web Intelligence by its nickname, WebI (pronounced webby, not web-eye). To understand the Web Intelligence reporting engine, you must first understand the WebI reporting paradigm.
How Is Web Intelligence Different from Crystal Reports?
You might be wondering why Business Objects choose to have two reporting engines in the framework; are they really that different? In some ways they appear similar—both retrieve rows of data and show it in a report. However, Web Intelligence is designed around a completely different user experience of information interaction. What is the reporting paradigm, and why is it different? In Web Intelligence, data is stored in a multidimensional array called a microcube. What does the microcube do and what is its benefit? There are no report bands, but instead there are report blocks and projections. What are these things, and what do they provide the end user? This chapter will help to answer these questions, and a few more.
Reporting Paradigm
The focus of Web Intelligence reporting can be summed up in several themes:
- Users who have no database experience should be able to create their own queries and reports.
- Users should be able to perform an analysis on a report, even if they didn’t create the report originally.
- The interface should be easy to use and intuitive.
- The interface should be very powerful and provide supporting capabilities for those users who can develop sophisticated analyses and scenarios.
In order to achieve these objectives, Business Objects developed a four-tier approach to reporting, which ties together various functional engines to provide a complete reporting and analysis stack that is called the Web Intelligence report engine. Figure 20.1 depicts the stack of functional engines and the basic workflow for creating an ad-hoc report.
Figure 20.1. This figure shows the four functional engines that make up the Web Intelligence reporting engine. The query is first created via a query panel off of the semantic layer, and when SQL is generated and data retrieved, the microcube and report engines perform post-query calculations and display the results.
Security Layer
Fundamental to secure reporting is the ability to provide appropriate access to data. You can think of the access as coarse-grained and fine-grained. Coarse-grained refers to accessing reporting resources in the business intelligence environment (meaning objects in the InfoStore) that specifically relate to the WebI engine, such as universes (semantic layers) and preexisting reports. Fine-grained security refers to providing access to the resource, but limiting it in some way. For example, managers can see data in an HR database, but cannot see salary information. Coarse-grained access is managed via the Central Management Server, or CMS. Fine-grained access is managed in the universe via the Designer and put into practice by the Web Intelligence engine. The security layer provides access to resources (universes, reports, and application functionality) and user-specific security overrides on these resources. Examples of such overrides are listed in Table 20.2.
Table 20.2. Coarse-Grained and Fine-Grained Security

Semantic Layer
Tied closely to the security layer is the semantic layer. There are two semantic layers currently available in Business Objects XI: business views and universes. The semantic layer used with WebI is the universe (see Chapter 18, “Using a Semantic Layer—Business Views and Universes,” for details on universes). The universe provides an abstraction layer for the end user that hides the complexities of the database, and presents database elements as business objects that can be selected in any combination by the business user via a GUI drag-and-drop interface called the query panel. Behind the scenes, a sophisticated SQL generation engine looks at the objects selected and, based on rules defined in the semantic layer, generates correct SQL for the end user (which they are completely shielded from seeing). Because the semantic layer passes through the security layer, all user-specific security overrides apply to SQL generation at the time it is generated, either initially or at subsequent execution.
Microcube Engine
One of the major differences between Web Intelligence and Crystal Reports is the inclusion of the microcube engine. The microcube engine stores the resultsets in a multidimensional array providing OLAP-like capabilities on the data. Working closely with the semantic layer that provides instructions to the microcube on how certain objects should behave when rolled up, the microcube can take the resultset data and project it in any dimensional combination based on the objects selected. Again, see Chapter 18 for a more detailed explanation.
The microcube shows projections, or slices of the data at a particular level. The microcube also allows for report variables to be calculated based on the underlying objects, and will project these calculations as well. Advanced users can specify levels of aggregation for calculation for a particular report variable, thus creating very sophisticated multilevel report variables.
Report Engine
The report engine sits on top of the microcube engine and shows the projections in report blocks. A report block is a table or chart that shows a particular slice or level of the microcube projection. Unlike Crystal Reports, WebI reports are not banded; there is a report block which shows a particular level of the data, and there are sections that can be placed around the report block (grouping headers and footers). There can be multiple sections or levels in a report. The sections also provide projection of objects at those levels, so calculations specific for each section are not necessary (the microcube takes care of this for the user).
The report engine allows the user to navigate the data and provide analysis via Drill mode. This means that as the user interacts with the report block, the user can select an object and drill down on the object to a lower level. Natural data hierarchies are defined in the semantic layer. Drilling down on a report tells the microcube to move the level of projection down one level in the data hierarchy and recalculate the report block at the next lowest dimensional level. All measures are recalculated to show the proper values at that projection level.
As users move or swap objects in and out of the report block, measure values are constantly being recalculated on the fly and reprojected to the reporting engine. This allows the user to move through the data seamlessly and explore relationships between the different dimensional combinations.
This seems very complicated—and it is. However, as you move through the user experience, you can easily see how intuitive it appears to a business user (or any user for that matter), and that describing this intuitive data manipulation is more difficult than actually using it.
Real World Usage
Using the Web Intelligence reporting paradigm, the user generally executes this workflow:
- Select a universe on which to explore the data.
- Select objects from the universe for the query.
- Get results back.
- Start manipulating the data.
- Refine the question; get more data (go to step 2 or step 1 and loop).
- When the user arrives at a sufficient stopping point, save the report.
- The user can schedule, publish, or send the report to other users.
This means that data exploration and discovery are part of the reporting paradigm. Many times business users know they need to “look at the numbers” but don’t know exactly what it is they are looking for. This often makes it impossible to nail down specific user-reporting requirements. In the Web Intelligence paradigm, the burden for report requirement definition is shifted to the business user, who in turn creates his own report. As he explores the data, he might learn things that take him in a completely new direction, ending up at a much different place than his initial intent. Needless to say, this process of discovery and new insights about the data often provides much more business benefit to the user and the organization as a whole.
As the data is secured through the semantic layer and through the security mechanism, it also allows IT to maintain control over what data is accessed and by whom. Because all connections are masked to the database via the universe, the end user is less likely to know how to circumvent the system. Data can still be exported into Excel or in comma separated values (CSV) format so that the user can use the information in ways that are not available via the reporting engine. However, access to the data is secured and all access to the database is controlled via the semantic layer.
Web Intelligence accesses data only via the universe. There is no ability to create a Web Intelligence report off of any other source than a universe. As described in Chapter 18, the universe currently connects to relational data sources and some multidimensional databases. A universe also contains a single database connection, meaning single database access. However, a Web Intelligence report can contain multiple resultsets from different universes, so data can be brought together in the same report from different platforms. These resulting data can be synchronized within the report and the data projected within a single report block.
![]() For more complete details, see “The Microcube Engine,” p. 413
For more complete details, see “The Microcube Engine,” p. 413
Report Anatomy
The universe that ships with Business Objects XI cannot adequately demonstrate the capabilities outlined in this chapter. Therefore, all examples in this chapter are drawn from two universes that are readily available and shipped with Web Intelligence 6.5.1. The universes are called eFashion and Island Resorts, and are sourced off of Microsoft Access databases. These universes, along with instructions for putting them into the XI infrastructure are available on this book’s website. Note that because there is no change in universe file format, all existing Business Objects universes are fully functional via Web Intelligence inside the XI framework.
As mentioned in the preceding section, Web Intelligence reports are not banded as they are in Crystal Reports, but they consider the innermost band or Details section of a Crystal Report to contain a WebI report block. The report block is a projection of the data in the microcube. As such, it does not necessarily represent the atomic level of data in the report resultset. For example, if a query is run that selects Year, Quarter, Month, and Sales Revenue, the report block could show only Year and Sales Revenue. Although the data for all four objects is contained within the report, the user sees the projection based only on the objects displayed in the report block. In this case, the Sales Revenue numbers would be automatically rolled up to the year level, and only one record per year would exist in the report block.
In Web Intelligence, the report designer or user is generally more interested in seeing the data at some level of aggregation (projection) in which her analysis starts, so often times the projection is quite high up in the data hierarchy. This is because a user will interact with the report and drill down into the level necessary when using the report. This also means that the report contains other data elements besides just the values shown, as is evidenced in Figure 20.2.
Figure 20.2. Web Intelligence report with simple table and resultset objects in left pane.

Figure 20.2 shows objects contained in the resultset on the left, and the report block on the right. Clearly, data exists in the report for each month, but when seen in the report block on the right, the data is projected at the year level. When objects are placed into the report block from the left side, the report block automatically recalculates the projection for the proper combination of dimensions.
There are different kinds of block types, which are discussed in the next subheading. All are interactive and allow for drilling into detail.
Creating Reports
In Web Intelligence, a report is created using a report panel. This is often referred to as the query panel, and the terms are interchangeable. Three report/query panels are available:
- Web Intelligence Java report panel—This is a Java applet that is automatically downloaded from the XI framework onto the client PC and is accessed via the user’s browser. The WebI Java report panel provides the most functionality of all three options in terms of query creation and report formatting.
- Web Intelligence HTML report panel—This totally thin solution provides a tab-driven approach to creating a Web Intelligence report, as well as some formatting capabilities. The paradigm is not as familiar to the Business Objects user who has used the query panel interface in either Web Intelligence or the Business Objects desktop client because it does not have the same layout.
- Web Intelligence Query—HTML—This is a pure query panel, meaning it does not allow for report formatting. Unlike the HTML report panel, it is very similar to the Java report panel query creation paradigm. In Business Objects XI, report formatting can be done on the report itself when viewing it in Interactive mode. This means that the Web Intelligence Query – HTML used in conjunction with on-report analysis provides for the query and analysis paradigm in a totally thin zero-client solution.
Really, the Java Report Panel and the HTML Report Panel are both query and report panels because they provide the capability to both generate the query and do report formatting. The Query – HTML is a true query-only panel because no report formatting is available through this interface. It is intended for use with the On-Report analysis feature to provide for a totally thin query and report formatting solution.
The Web Intelligence HTML report panel was a first generation totally thin reporting solution. It is being supplanted by the Web Intelligence Query – HTML query panel in combination with the on-report analysis features. This paradigm is more akin to the original and highly successful report query and formatting paradigm of the Business Objects desktop product with which the majority of existing customers are already familiar. The Web Intelligence HTML report panel is not discussed in this book.
A report created in one query panel can be opened in another. A report created in the Java report panel could be opened in the HTML report panel. Not all functionality is exposed within each tool, so it might not be feasible to do all functions in each report panel. However, because all solutions are built off of the same underlying object model, the functionality exists even if not exposed through the interface. The query/report panels will be enhanced to bring them to parity in future releases. Prior to the XI release, people often chose to use the Web Intelligence Java report panel. With the XI release, it is anticipated that a significant number of users will use the Web Intelligence Query – HTML and the on-report analysis features instead of the Java report panel.
Web Intelligence Java Report Panel
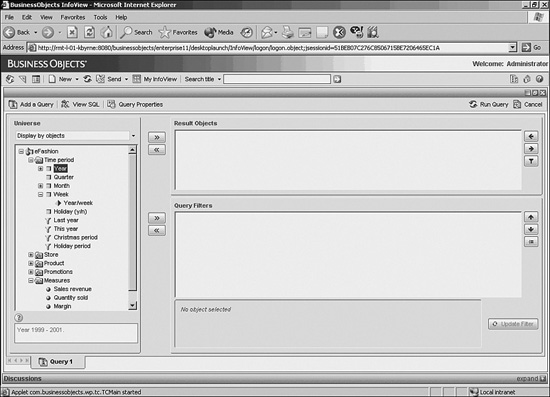
The Web Intelligence Java report panel (henceforth referred to as the Java report panel) will open when the user’s preferences are set to this option in the Preferences section of InfoView and after a user chooses a universe for building a query. Figure 20.3 shows the Web Intelligence Java report panel with the eFashion universe opened. The Year object was selected from the Time Period class and is in the midst of being dragged and dropped into the result objects pane. Objects can be moved to any of the panes on the right side of the window. Note the help text in the panes telling the user how to use each pane.
Figure 20.3. The Web Intelligence Java report panel.
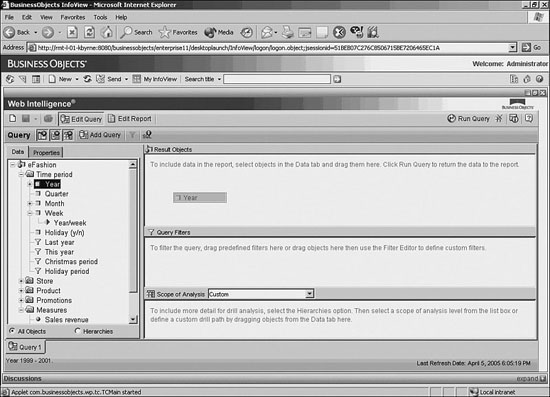
The window is broken into panes. On the left side is the data pane that contains the universe objects. As you can see in Table 20.3, there are four different object types.
Users drag and drop objects from the left pane to the various right panes. Objects put in the result objects pane show up in the report block by default during the fist execution. Objects put in the query filters pane do not show up in the resultset unless a corresponding object is in the result objects pane. Rather, these objects restrict the query (WHERE, HAVING, or subselect clauses), depending on how the filters are constructed. The objects in the scope of analysis pane are included in the query, but are not seen directly in the report block. So this is extra data contained within the report, but not displayed until required.
Scope of analysis refers to the inclusion of objects in an object hierarchy. For example, a common hierarchy is Time—Year, Quarter, Month, Week, Day, and so forth. If the Year object is chosen as a result object and then the scope of analysis is set to two levels, the next two levels of the time hierarchy are also added to the query (Quarter, Month). Consequently, if Quarter had been chosen in the result objects pane instead of Year and the scope of analysis was set at two levels, the Month and Week objects would be added to the query. The scope of analysis brings in the number of levels specified below the object named in the result object pane. If multiple dimensions belong to hierarchies, all hierarchies are included in the scope of analysis. This will be discussed more in the “Drilling” section later in this chapter.
The interface is fairly simple—pull over the objects you want in the query and press the Run Query button in the top right. The user can use the Condition objects (yellow funnel icons) to place restrictions on the query, or he can build his own filters. If objects are dragged into the query filters pane, the left pane automatically changes to walk the user through the filter creation process. Figure 20.4 shows creation of a filter on the Lines object.
Figure 20.4. When the Lines object is dropped into the Query Filters pane, the Filter Editor dialog immediately opens to walk the user through the filter creation process.

In Figure 20.4, the Lines object has been selected to be filtered, as is indicated in the top left of the Filter Editor dialog. A list of operators is available via a drop–down menu. You can also select an operand type. The operators are common functions, such as Equal To, Different From, In List, Not in List, Between, Is Null, and so forth. The operand types tell how the variables should be handled. The report author can enter a constant value, he can choose the values from a pick list, or he can create a prompt so that in subsequent runs of the report, the user can enter different parameters. The right side of the dialog changes context, depending on the operator and operand type chosen.
Additionally, the user can choose the Advanced Filter check box. This is the mechanism for putting specific types of subqueries into a query. Discussion of this feature is beyond the scope of this chapter, but the Crystal Report author should note that subquery capability exists within the Web Intelligence query panel.
If multiple filters are chosen, the filters can be nested, with and/or operators applied. For example, a query could be restricted on all Customers with an Order level less than 20,000 last year or Customers with an Order level less than 10,000 this year, and, either way, exclude all Customers from Texas.
Keeping in mind that the objects themselves can contain quite sophisticated SQL (such as CASE statements or complex formulas), and understanding how objects can be put together in any combination in the query panel, you can see that sophisticated SQL can be generated by a business user without him knowing any of the underlying database structures or SQL syntax. For those users who might be more familiar with database structures and SQL, there is a Show SQL button that presents the user with the SQL generated from the query panel. As previously mentioned, this application feature is securable via the CMC, so it can be turned off to avoid exposing the database layer to specific users. However, it is a valuable tool for support staff helping to troubleshoot queries when business users run into complications.
Within the Java report panel is an Add Query button. This button enables multiple queries to be generated within a single report. This means that data from multiple and disparate databases can be brought together within a single Web Intelligence report and presented side-by-side.
Web Intelligence Query Panel – HTML
The Web Intelligence Query Panel – HTML (henceforth referred to as Query – HTML) provides the same functionality described in the preceding section but in a truly thin client. The Query – HTML panel is enabled through the preferences in InfoView by choosing Query – HTML from the list of report panels. Figure 20.5 shows how to set the Web Intelligence preferences for a user.
Figure 20.5. Preferences in InfoView, showing Web Intelligence viewing and report panel preferences.

The Query – HTML panel can be seen in Figure 20.6.
Figure 20.6. The Query – HTML panel.
Below are some of the HTML panel features:
- The same universe display is available as in the Java report panel (classes and objects in a hierarchical tree structure).
- Objects are moved to the result objects pane or query filters pane (scope of analysis is found in the Query Properties dialog).
- Multiple queries are available via the Add Query button.
- SQL can be viewed.
There are fewer features in this panel than the Java report panel because it contains no capabilities for report formatting. However, with the exception of the advanced query filters, the panel provides the same query functionality as the Java report panel. As stated previously, reports created with one report panel can be opened with another. So, for example, if a report was created with the Java report panel and it included an advanced query filter, another user could open that report in the Query - HTML panel and edit it and the report would still maintain the advanced query filter (depicted with a blue funnel to distinguish it from a simple filter). The user would not be able to edit the advanced filter, but could remove it or nest it in conjunction with other query filters. Again, all query panels utilize the same underlying object model, so reports are not query-panel dependent.
After you develop a report with the Query – HTML panel, formatting is the next step. In Web Intelligence, the concept of on-report analysis consists of manipulating the results directly on the HTML by the end user. A key focus of the reporting paradigm is the ability to manipulate a report either newly created via ad-hoc or previously created and published.
On-Report Analysis
Users are expected to use Web Intelligence to explore data, create reports, and then publish those reports for others to see and analyze. Often there are many more users who consume existing reports than users who author reports. However, for this large number of users, there are various report interaction levels that might be desired or allowed by the application administrator. To accommodate different levels of interactivity, Web Intelligence documents can be viewed in three default formats: PDF, which renders them almost totally static; HTML, which provides a little more interactivity; and interactive, which provides the full breadth of analysis and formatting available. Table 20.4 compares the three formats.
Table 20.4 Web Intelligence Report Viewing Options

The next section focuses on the capabilities of viewing Web Intelligence documents in Interactive mode.
Viewing a Document in Interactive Mode
Figure 20.7 is a screenshot of a report created on the eFashion universe as seen in Interactive mode. The query contains the objects seen in the WebI Query – HTML panel example (refer to Figure 20.6) with two levels in the scope of analysis. The left pane of InfoView that shows the folders has been hidden to provide more screen space for the report.
Figure 20.7. A Web Intelligence report open in Interactive mode.

In Figure 20.8, you will first notice that the left side of the screen has a pane with a drop-down list. This pane contains metadata about the report. For example, in the document summary currently seen, a user unfamiliar with the report can learn a great deal about the origin and content of the report. Most notable are the prompts requested and the values selected for the report. This report contains data for the years 2001 through 2003, and data for a long list of clothing lines. So if there is ambiguity about the content of the report, a business user can look at the description and see exactly what objects and conditions were used in gathering the data. Also, an important attribute is the last refresh time, letting the user know if the information is fresh.
Figure 20.8. Document summary in WebI left pane.

In the Data Summary, the objects are selected and their associated descriptions (defined in the semantic layer) are displayed. You can also see the universes used for each query.
The left pane contains a number of drop-down boxes to help orient the user to the content and layout of the report, as well as to aid in navigating the report via the navigation map. The navigation map provides a navigation tree starting with each report tab, and shows each underlying section and subsection defined within the report. When the user clicks on the section, the screen moves to this section of the report, as depicted in the cross-tab table reflecting the Leather line in Figure 20.9.
Figure 20.9. Navigation map with leather selected; report moves to leather section.

A user can also change the prompt values by going to the User Prompt Input drop-down menu and manually editing the dialogs for each prompt, or she could achieve the same result by refreshing the report by clicking on the Refresh Data button in the top-right corner, which brings up the Prompts dialog with the previous refresh values, as seen in Figure 20.10.
Figure 20.10. A WebI report showing the User Prompt Input in the left pane. The report was refreshed and the Prompt dialog shows the previously selected values.

The user can also search for text within the report via the Find drop-down menu. The search does a partial string search unless full word is specified; the case can also be specified, as well as the direction of the search.
Toolbars
Notice the toolbars available for report analysis and formatting. These toolbars closely mimic the toolbars available in the Business Objects desktop reporting tool, so they should be familiar to Business Objects users. They provide access to report formatting, report manipulation, and formula creation functions. Also note that the standard Microsoft button icons are used whenever possible for ease of adoption by end users. Some of the capabilities are discussed in the next subheadings.
Data Manipulation
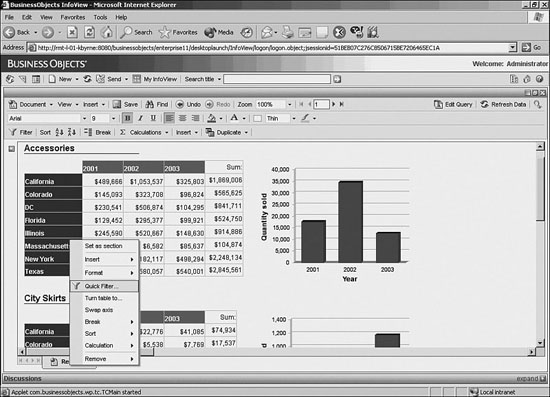
The most common activities users request are sorting and filtering of data on the report. Both are easily achievable by choosing the Sort and Filter buttons. The user can also right-click on the report to bring up a context-sensitive menu that accesses the same function calls. For example, if the user wants to filter the data in the sample report to show California, Colorado, and Texas only, she could right-click on the States column on the report and that would bring up the context-sensitive analysis menu, as seen in Figure 20.11.
Figure 20.11. The cross-tab table with State highlighted and the context-sensitive menu open, with Quick Filter highlighted.
Choosing the Quick Filter option brings up a dialog for the object showing all of the possible values that exist in the report. The user can select the ones she wants and choose OK; the report is instantly filtered with the values. Figure 20.12 shows the Quick Filter dialog with some states selected.
Figure 20.12. The Quick Filter dialog with some states selected.

Figure 20.13 shows the result of applying the filter on State. The filter was applied to the cross-tab table and not the chart, so the values were filtered by report block. This underscores that the report block is showing a particular intersection of the microcube beneath it, and each report block can function independently of the other, or can be synchronized to reflect common filtering during drill-down analysis (more on this later). Although this is a complicated technical concept, to a business user this makes intuitive sense; the chart is a different presentation than the cross-tab and therefore follows different filtering rules, unless it is explicitly told to follow the same rules. Note that this shows considerable difference from the banded report writing approach seen in Crystal Reports.
Figure 20.13. The report with the filter applied; only the selected values appear in the report. The data dynamically recalculates to accommodate the filter.

Suppose that the user wants to sort these rows descending alphabetically. The user can simply click on the values (click directly in one of the cells) and then just click on the Descending Sort button on the toolbar, and the results are instantly sorted. More than one column can be sorted and sorts occur in the order applied.
The left pane in Figure 20.14 now shows the Document Structures and Filters view. This shows that at the report level, the Year and Line filters apply to the entire document. It also shows that the cross-tab has a filter on State and the values of that filter. It shows that there are no filters applied to the bar chart—again, all this metadata is useful for the business user when determining exactly what makes up the results in the report.
Figure 20.14. The Document Structure and Filters view is in the left pane. Notice that the query filters are applied globally, but the State filter is applied to the cross-tab block only and not to the bar chart.

Pivoting and Swapping Objects
Imagine that the user would like to swap the axes within the cross-tab, showing states across the top and years down the side. The easiest way is to just drag and drop the row or column names directly on the report. Another way that shows a bit more of the internals of the reporting engine is achieved by right-clicking on the report to bring up the context-sensitive menu and by then choosing Format/Table. The following dialog appears as shown in Figure 20.15, the last tab of which is labeled Pivot.
Figure 20.15. The Format Table dialog with the Pivot tab highlighted. Objects can be moved to change the values of the cross-tab. Objects can be chosen from any in the Available Objects pane or can be swapped from within the rows and columns boxes by dragging and dropping.

The dialog displays the objects in the cross-tab configuration. The objects can then be dragged from the Row area to the Column area and vice versa, thus swapping the columns and rows. Note too that all other objects in the report are available on the left side, so completely different objects could be put into the cross-tab, or all of the objects completely replaced with a new selection. Likewise, report variables could be used as well (more on how to create report variables in the next subheading). So the reports can be completely redesigned by the end user, all through the Interactive mode, with no trip back to the query panel. This allows report designers to give the users maximum analytic flexibility while further shielding them from the database. Because reports can function as containers of predefined finite resultsets, the users can pick the reports and manipulate and analyze them in myriad ways without going back to IT for report refinement. Figure 20.16 shows the result of the pivot.
Figure 20.16. The axes are swapped, along with sums.

You could have more easily chosen Swap Axis from the context-sensitive menu, but then you would not have been able to see the ability to move objects in and out of the cross-tab. In Web Intelligence there are often several ways to accomplish the same thing. Just as in Microsoft Word, where a user can select text to copy and press Ctrl-C, click on the Copy button, or choose Copy from the Edit menu, so, too, in Web Intelligence users can choose one of several ways to manipulate the interface that is more compatible with their computing style.
Report Variables and Formulas
What if, in this report, you wanted to know the sales per unit? You could go back to the universe and see if there is a Sales per Unit measure object. In this case there is not, but because you have Sales Revenue and Quantity Sold objects, you can calculate the sales per unit within the report itself. Web Intelligence has a formula language just like Crystal Reports, with dozens of available functions.
The formula language can be used in two ways. First, a user could just type a formula into a cell and have the formula applied to the report block directly. As such, it resides only within that one cell for that one report block. The formula can also be within an object defined within the report. This is called a report variable. As an object, it is available for projection and reuse just like a measure object, meaning it can be swapped in and out easily or reused in multiple charts or tables.
Although both report formulas and variables can be created in the WebI Java report panel and in the Interactive Viewing mode, the XI release provides a bit more support in the user interface when using the Java report panel. The examples in this section use the Java report panel for ease of understanding.
When developing a report and using formulas, it is best practice to encapsulate the formula in a Report Variable object so other users can interact with the object when doing analyses.
In the Java report panel, there is an icon with three little objects on it and a down arrow (indicating it will drop down into the report space). This is the Show/Hide Variable Editor button. Clicking this reveals the variable editor, as seen in Figure 20.17.
Figure 20.17. The Java report panel with the variable editor showing
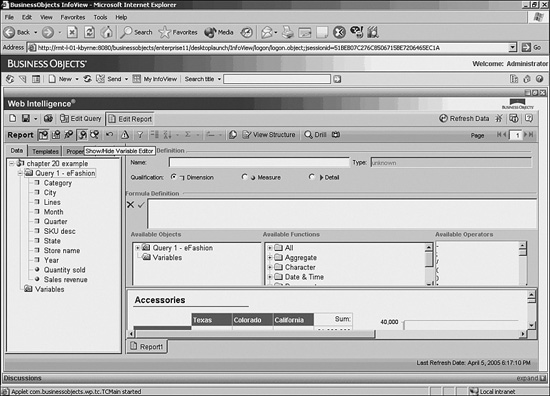
The variable editor contains an area to write the name of the variable, a text box to type in the formula (Formula Definition box), and helper boxes where objects, functions, and operators can be double-clicked and included in the Formula Definition box.
The Available Functions box groups the functions into folders so that they can be easily found, or the user can choose the All folder to see all available functions. The major function categories are
- Aggregate—These are aggregate functions:
sum,count,max, and so on. These aggregate functions also dictate how the variable behaves as it is projected within the microcube. These functions apply to report variables that are also measures. - Character—Typical string manipulation functions:
Ltrim,Substr,Length,Formatdate,replace, and so forth. - Date & Time—Typical date and time functions:
CurrentDate,CurrentTime,DayNumberofWeek,DaysBetween,RelativeDate, and the like. - Document—Functions detailing document specific parameters:
DocumentAuthor,DocumentDate,DocumentName,DocumentPartiallyRefreshed,DocumentTime, andDrillFilters. - Data Provider—Functions that describe the individual data providers (resultsets) within the report:
DataProvider,LastExecutionDate,LastExecutionTime, andUserResponse. - Misc—Miscellaneous functions.
- Logical—Typical logical functions:
IsDate,IsError,IsNull,IsNumber,IsString, andIsTime. - Numeric—Typical numeric functions:
Abs,Sqrt,Floor,Exp,Log,Truncate,Round, and so forth.
Readers that are more familiar with the Business Objects full client will note that the function library available in Web Intelligence is not as extensive as the one available in the desktop version. The function capabilities are continuously expanded and there will be many additional functions supported in the next release, with continual expansion for all subsequent releases.
The Crystal Reports function library is more extensive than the Web Intelligence function library. This is due mainly to two reasons. First, Crystal Reports can provide highly sophisticated formatting, so it requires a function language that enables this. Web Intelligence functions are focused on report object creation for on-report analysis. Second, the Web Intelligence function library is relatively new compared to the Crystal Reports function library, so expect it to expand significantly in future releases.
This example creates a Sales per Unit report variable. First, type in the report variable name in the Variable Definition box, and choose Measure as the Variable Qualification (this tells it what type of object it is). Then create the variable formula. In this case, you want to divide Sales Revenue by Quantity Sold to get the Sales per Unit. Find the Sales Revenue object in the Available Objects box and double-click it; it appears in the Formula Definition box. Select the solidus (division bar) from the Available Operators box, and then go back to the Available Objects box to double-click on the Quantity Sold object. You can check the variable formula before saving it by clicking on the green check mark just to the left of the Formula Definition box, and, if it passes, save the formula by pressing the Save button. Figure 20.18 shows the outcome of the actions just described.
Figure 20.18. The Variable Editor dialog with a completed formula.
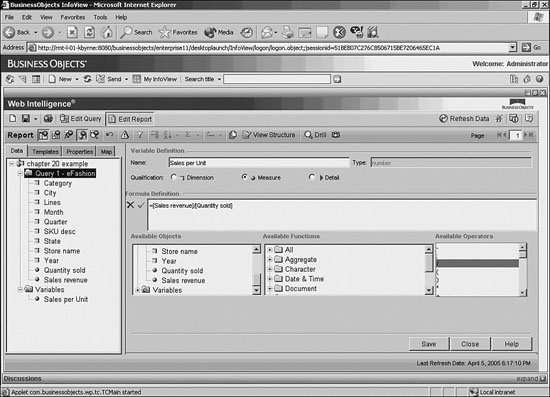
Notice the Web Intelligence syntax—all formulas start with an equal sign and universe objects are noted with square brackets [ ] around the object name. The formula shows the Sales Revenue object divided by the Quantity Sold object.
Because these values change at all dimensional intersections in the microcube, this formula changes its results in the report block. So, unlike Excel where the formula is dependent on a particular row/column combination, the Web Intelligence formula is not, and recalculates as the projection in the report block changes. Simply put, you can use it like any other object—swap it in and out of the table, place different dimensions next to it, drill on it—and it recalculates the proper values for each appropriate level.
An in-depth discussion on creating report variables is beyond the scope of this chapter. If you would like more information, refer to the Web Intelligence User Guide that has a more thorough discussion of all functions and uses.
Drilling
Drilling shows the power of the various engines in the reporting stack seen in Figure 20.1 working in unison. The report engine provides the display of the microcube and interactivity; the microcube creates the calculations, and the semantic layer provides behavioral rules for the engine when the data is being manipulated, calculated, and projected. In drilling, this becomes even more apparent as the semantic layer defines the data hierarchies through which the data can be navigated. Likewise, the semantic layer also provides the means for the user to drill “beyond the cube” seamlessly and return to the database when his analysis goes beyond the content contained within the report. Thus, SQL is autogenerated on the fly, and the data is returned to provide the next step for the business user. The next subheadings cover this in detail.
Hierarchies
Hierarchies are natural data relationships that exist in the data. The term hierarchy refers to the aggregate relationship between entities. For example, time is often thought of as a hierarchy of entities—Year, Quarter, Month, Week, Day, and so on. The nature of the entities is such that they can be thought of as parent-child relationships—all of the days comprise a Week, a certain number of weeks comprise a Month, three months comprise a Quarter, and so forth.
When navigating data, drilling refers to moving up and down the data hierarchy. If the user is looking at Year and wants to explore the data at the Quarter level, this is referred to as drilling down because it moves from the parent to the child (year to quarter). Drilling down therefore refers to moving downward through the hierarchy, from parent to child. Drilling up refers to moving upward through the hierarchy, from child to parent.
Business Objects uses a third term, drill by. Drill by refers to moving more than one level up or down, or moving from one dimensional hierarchy to another—say, from Time to Geography. So, if the user drilled down from Year to Quarter, but then wanted to see the data by Region, this would be drilling by (Region).
The microcube not only takes the resultset from the query, but it understands the hierarchies defined in the semantic layer and allows for navigation down, up, and by these hierarchies. As mentioned previously, the microcube recalculates as the dimensions change, so measures are recast as the drilling takes place.
Drilling on the Web Intelligence Report
In order to activate Drill mode, click the small magnifying glass button in the top-right of the report window. When clicked, the report redraws itself with hyperlinks under the dimensions and measures. Drilling can take place on any of the report blocks or sections, and can take place on dimensions as well as measures. Detail objects, depicted by the small green tetrahedron, are not drillable. Figure 20.19 shows the document in Drill mode.
Figure 20.19. The document in Drill mode. Note that the rows, columns, and values are all underlined, indicating they are drillable.

The ToolTip in Figure 20.19 tells the user what the next dimension is in the hierarchy. The option here is to drill down because year is at the top of the hierarchy—there is nowhere to go up from here. Note that California is also drillable, as are the measures in the cross-tab. Likewise, the chart to the right is also drillable. Drill down on 2001; the result is seen in Figure 20.20.
Figure 20.20. When the report is drilled down by Year, Quarter is replaced in the row of the cross-tab block and Year appears on the Analysis Context in the Year drop down.

Notice in Figure 20.20 that the Year object is replaced with the Quarter object in the rows. Also note the up arrow that allows the user to drill up the hierarchy. The hyperlink on the Quarter values implies drilling down. Also note that the chart shows only 2001 data. Unlike report filters, drill filters apply globally to the report tab.
At the top of the pane is the Analysis Context drop-down menu containing 2001. This box allows the user to change the values of the Year variable and change the report display automatically.
Now drill up to Year, and then drill down on California.
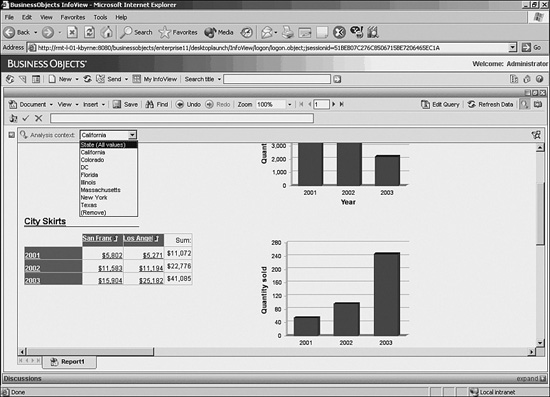
In Figure 20.21, note that the columns in the cross-tab changed to Los Angeles and San Francisco. The drop-down list on State shows all the possible values contained within the report. If you choose another state, the report will show the projections for that state.
Figure 20.21. When the report is drilled down by State, City replaces State in the column of the cross-tab block and State appears on the Analysis Context bar in the State drop down.
Now drill up to the original state, and then drill down on the measure intersection for California and 2001.
Figure 20.22 shows drilling on the measure moved both dimensional hierarchies down, from Year to Quarter and from State to City. There are now two drop-down lists in the Analysis Context bar.
Figure 20.22. The report is drilled down by the measure object, and Quarter and City replace Year and State in the row and column of the cross-tab block, and Year and State appear in drop downs on the Analysis Context bar.

Now right-click on Quarter and choose Drill By, as seen in Figure 20.23.
Figure 20.23. The context-sensitive menu is visible and Drill By is selected. All hierarchies represented in the report are available, so drilling by will swap the row with any dimension from any hierarchy.
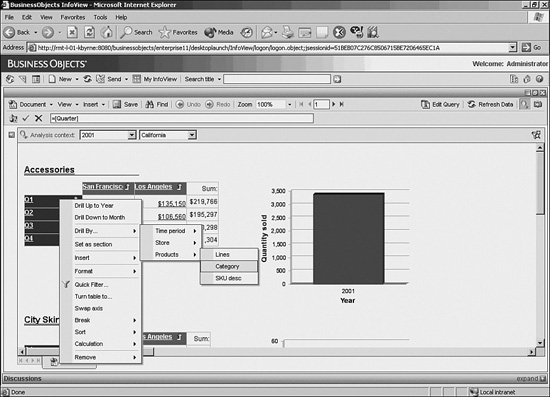
When drilling by, all dimensional hierarchies present in the report can be seen. By choosing one hierarchy, you see the elements in the hierarchy starting at the top of the hierarchy and moving down, as is demonstrated by Lines, Category, and SKU Desc in the Product hierarchy. By choosing Category, you swap the Quarter object with the Category object, and the cross-tab is redrawn, as shown in Figure 20.24.
Figure 20.24. This is the report after drill by, with Category replacing Quarter. The Quarter object is now in the Analysis Context bar with the State and Year drop-down menus.
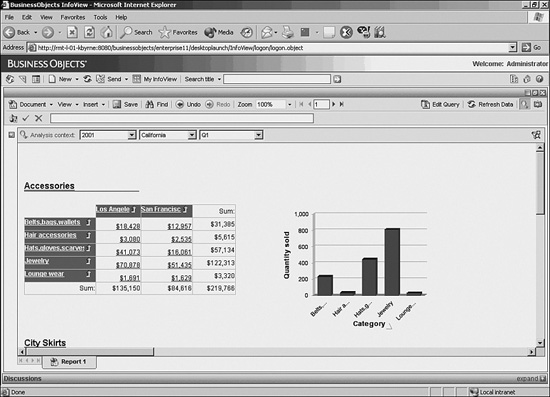
Do you see a difference in the accompanying bar chart? It now reflects the categories in the cross-tab. Another feature of drilling is synchronizing the dimensional drills of report blocks when they are being displayed. To synchronize the cross-tab and chart, go to the InfoView Preferences and change the drill behavior to Synchronize Drill on Report Blocks. As previously mentioned, the table and chart do not need to be in sync, but they can be. Regardless of whether the dimensions change in the chart, the chart data is filtered by the values in the Analysis Context drop-downs. The only difference is changing the dimensional display in the chart to match the cross-tab display. Without the synchronization option, the x-axis on the chart would show the Year object (filtered for 2001).
Drilling Beyond the Cube
The report contains a small resultset, but presumably the database contains much more data. Some of this data might be defined within the data hierarchies in the semantic layer, but the objects were not chosen at report runtime. When drilling, the user can drill beyond the data in the report. He would then be faced with some options that are explored next.
It is possible via the CMC to disable the user from drilling beyond the cube and into the database. If the administrator turns this feature off, the user will not be able to explore data outside of the resultset contained within the report itself.
Go back to the original drill showing Quarter and City (Figure 20.23), and drill down to month. Click on the Month drill-down hyperlink, which presents the following dialog in Figure 20.25.
Figure 20.25. The Extend the Scope of Analysis dialog. The hierarchy selected shows the same values in the Analysis Context drop-downs.

The Drill dialog asks to extend the scope of analysis on the Time dimension by including Week, which is the next object in the hierarchy. It also shows another object, Holiday, which is the fifth and final object in the hierarchy, with a check box to include it in the results if desired. The filters under each dimension reflect the current state of the drill filters displayed in the report. When fetching more detail data, the results can be quite large. Therefore, the user is presented with the option of filtering the results at any level, based on the current drill filters, to help ease the resultset size.
On very large databases, this can be a significant performance enhancement. Runaway queries are managed by the semantic layer and security layer, when row restrictions and query run time governors are in place. This means that multimillion row resultsets can be avoided through proper security administration.
Choose the Week option from the dialog. Figure 20.26 shows the result.
Figure 20.26. The report after Week was chosen. The SQL was dynamically generated and executed, the microcube was dynamically updated, and the crosstab row reflects the Week object. Month now appears in the Analysis Context bar with the other dimensional drop–downs.

Synchronizing Data from Multiple Data Providers
As of Business Objects XI Release 2, merged dimensions are available and used to combine data from multiple data sources and synchronize the data for display in a single report block. This feature enables you to further analyze data stored within different databases, and possibly even different database management systems, within one report without replicating the data. The blocks of data have to have common dimensions allowing the synchronization; however, the data can be stored and retrieved at differing levels of granularity.
When analyzing sales figures per salesperson, it would be beneficial to have an understanding of the number of hours each salesperson worked. In this example, snippets of data are required from different databases within one report. The “hours worked” data is from the HR database per salesperson, per week. The sales data is from the enterprise data warehouse at varying levels of granularity. Combining the figures in one report makes it possible to calculate the average hourly sales per salesperson within the report.
Business Objects, by default, displays only dimension values for which data has been returned. For example, if a yearly report is run in March, only data for January through March is returned and displayed. If the data is displayed in a cross-tab report with the date across the top, columns are displayed for only January through March. Using merged dimensions, it is possible to display all months regardless of whether the main data provider returns data for the month.
The following steps can be followed to accomplish this. After the main data provider has been created, add a query that returns all the values to be displayed for the dimensions, in this example Month and Year as displayed in Figure 20.27. Merge the Month Objects and Year Objects and display the common dimension on the report. Figure 20.28 displays the completed report; in this example, we restricted the main data provider to return data for only January through March. However, the report will always display columns for January through December, regardless of whether there was revenue. The same steps can be followed for multiple dimensions on a single report.
Figure 20.27. The main data provider was created, and a second data provider, returning only the dimensions for which we would like to have all values displayed, was added. Note that if restrictions were placed on the dimension on the main query, these should generally be placed on the dimension in the second query. This example returns data for only 1999.

Figure 20.28. The report after the dimensions are synchronized and displayed in the report. All months are displayed, regardless of whether there was revenue. Note: If the document Auto-merge Dimensions property is set, Web Intelligence automatically merges dimensions from the same universe, with the same name and with the same data type, when you create a report. Alternatively, dimensions can be merged manually or removed from the merged dimension.

Conclusion
You should understand that this is in no way a full description of the reporting capabilities of Web Intelligence. However, the goal of this chapter was to introduce the Web Intelligence reporting paradigm and to show some of the main features that differentiate Web Intelligence from Crystal Reports. Having both of these engines available within a single framework is an extremely powerful set of report authoring and analysis capabilities. If you are interested in learning more about the intricacies of the Web Intelligence reporting engine, refer to the extensive product documentation that accompanies the product because it is quite detailed and will lead you through the full breadth of WebI capabilities. There are extensive features on report formatting and placement for printing, linking of reports, complete description of the formula language, in-depth discussion of the advanced query filters, and how multipass SQL is handled by the microcube for starters.